* Professor, Department of Geography, Kyung Hee University, [email protected]
** Associate Professor, Department of Geography, Kyung Hee University, [email protected]
Change in Travel Behavior of the Elderly in Seoul Metropolitan Area
Shi Hak Noh* · Chang-Hyeon Joh**
수도권 노인 통행행태의 변화
노시학*·조창현**
Abstract:Mobility of elderly people is an important issue in Korea (ROK) where the aging process of the population is so rapid. This paper aims to examine the unique characteristics of elderly travel behavior in comparison to younger people and the changes in such characteristics given that Korea (ROK) has the world’s fastest aging population. To this end, the paper analyzes two recent large scale survey data sets, each including more than a quarter of a million individuals’ travel diaries in metropolitan Seoul, collected in 2002 and 2006, respectively. The analysis found that elderly travel differs greatly from younger people’s in many aspects, and the mobility of the elderly, particularly those aged 65 to 69, has increased a great deal. Recent reforms of public transportation systems in the city could contribute to the increase in elderly mobility.
Key Words : elderly, travel behavior, metropolitan Seoul, household travel survey, aging society, public transportation system reform
요약:우리나라 인구의 급격한 노령화 추세로 인해 노인 인구의 모빌리티는 중요한 사회적 이슈가 되어 있다. 본 연구는 청장년과 비 교한 노인의 통행행태의 특성을 검토하고 세계에서 가장 빠른 노령화가 진행되는 우리나라에서 그러한 특성이 어떻게 변화하고 있는 지를 살펴보고자 한다. 이를 위해 본 연구는 2002년도와 2006년도의 수도권 가구통행실태조사 자료를 분석한다. 연구 결과, 노인통 행은 청장년과는 많은 측면에서 큰 차이들을 보이며, 노인 인구, 특히 65세에서 69세 사이의‘젊은’노인 인구의 모빌리티는 크게 증 가한 것을 알 수 있었다. 최근의 도시 대중교통체계 개편은 이러한 노인 인구의 모빌리티 증진에 영향을 미친 것으로 보인다.
주요어 : 노인, 통행행태, 수도권, 가구통행실태조사, 노령화사회, 대중교통체계 개편
1. Introduction
Korea (ROK) is the most rapidly aging society in the world. Those over the age of 65 accounted for 9.3% of the population in 2005. The UN expected Korea (ROK) to become one of the most aged countries in the world, with an elderly
proportion of 34% by 2050 (Table 1 for endnote).
However, the aging process has proven to be even faster than the UN’s expectations and reached 11.2% in 2010. A variety of issues related to the aging society in Korea (ROK) are currently under discussion, and the accessibility and mobility of the elderly are major problems that
older people face on a daily basis. Limitation in the ability to travel due to such factors limits individual’s quality of life. People who cannot travel as they want cannot participate in activities in different locations, which results in a reduced quality of life.
The accessibility and mobility of the elderly have been widely studied in this regard, as they are treated as a measure of one’s quality of life.
Related studies include the impact of accessibility and mobility on the elderly and their overall quality of life (Metz, 2000; Alsnih & Hensher, 2003; Harrison & Ragland, 2003; Banister &
Bowling, 2004; Jamie et al., 2009), the impact of physical and economic difficulties due to the aging process on the travel patterns of the elderly (Smith & Sylverstre, 2001; Kim & Ulfarsson, 2004;
Newbold et al., 2005), and the improvement of policy measures for the elderly travel environment (Metz, 2003; Mercado et al., 2006;
Balcome et al., 1998; Tyler, 2002).
The relationships between transportation and social exclusion have also been studied widely (Pacione, 1995; Barry, 1998; Delbodc & Currie, 2011; Littlewood & Herkammer, 1999; Lyons, 2003; Preston & Rajé, 2007). More specifically, the research on this issue includes the research on the type of social exclusion induced by transportation (Church & Frost, 1999; Litman, 2003), the index of transportation-related social exclusion (Duguid, 1995; Gibb et al., 1998), the empirical evidence of the transportation impact on social exclusion (McGregor & McConnachie, 1995; Priya & Uteng, 2009; Stanley & Vella- Brodrick, 2009; Young, 1999; Lee & Murie, 1999;
Kenyon et al., 2002), and the policy alternatives to lessen the transportation-induced social exclusion. Research on transportation of the elderly and the disabled have also been widely studied in Korea (ROK). Related works in Korea (ROK) include the elderly travel pattern (Noh, 1994, 1998; Keum, 1999; Kim 2001) and travel
safety of the elderly and the disabled (Park, 2007;
Park et al., 1999; Shin, 2000, 2002; Seol et al., 2004).
It is important to understand the physical and social characteristics of the elderly that differ from younger people in order to provide the elderly with a user-oriented transportation policy measure. Given the world’s fastest aging process exists in Korea (ROK), it is even more important to understand the nature of the mobility changes of the country’s elderly travel behavior that would also be very different from younger people. The above-mentioned existing research works lack thorough investigation into the processes of the changes in elderly travel behavior over time compared with younger people in light of a rapid aging process of the entire society. This is, however, a matter of high importance as the aging society issue becomes a worldwide phenomenon. Travel is derived from activity participation, and the organization of activities in daily life is necessarily affected by the changes in social trends over time. The large scale data set newly provided by national transportation institution offers the opportunity to examine elderly travel behavior with a high relevance to the current Korean society that experiences rapid development for an aged society. The current study intends to accommodate this research needs that are potentially useful to both academic and policy perspectives.
The paper aims to examine the unique characteristics of elderly travel behavior in comparison with younger people and the change in such characteristics given the rapid aging process in Korea (ROK). To this end, as a preliminary study of this research purpose, the paper analyzes two recent large scale survey data sets, each including more than a quarter of million individuals’ travel diaries, respectively collected in 2002 and 2006, in metropolitan Seoul, the country’s capital region. In fact, large
scale data has been collected and analyzed in geographical research such as for example, Joh (2009), Lee and Lee (2009), and Lee et al. (2010).
Their research however did not focus on elderly travel. The paper is organized as follows. Section 2 briefly discusses the methods used in analyzing the individual travel diary. Section 3 describes the household travel survey data collected in 2002 and 2006. Section 4 then discusses the analysis results that distinguish the travel characteristics and behavioral changes between young and old and between old people of different age groups.
The paper ends in Section 5 with conclusions and a future research agenda.
2. Analysis Methods
The analysis of the current paper concerns important characteristics of travel behavior by age group such as behavioral and spatial characteristics of the visited destination.
Behavioral characteristics include (1) whether the person traveled at each time during the day, (2) whether the person traveled at each time during
the day for a particular purpose to the destination, (3) total distance traveled, total travel time, and trip frequency, (4) frequency of inner trips traveling within the neighborhood of the person, distance to the destination of the longest distance from home, and ratio of distance to the farthest destination to total travel distance, and (5) modal split. Characteristic 4 relates to the concept of activity space. Activity space assesses individuals’ quality of life, based on time- geographic theory (See Dijst, 2004). Size and shape constitute the important properties of an activity space. A larger activity space would suggest wider accessibility and thus a higher quality of life. Given the size, the shape close to a circle would suggest a diverse use of space along the day (Figure 1(a)), whereas the shape close to a single line would suggest a space use focused on a single purpose (Figure 1(b)). To observe relationships between travel behavior and land use, the paper further examines spatial characteristics of the visited destinations and the number of employees of particular industries in the visited destination area.
Each of these variables has been averaged for each age group for the day to achieve a
Figure 1. Shape of activity space of the same distance to the farthest destination from home
(a) Shape of diverse use (b) Shape of focused use
comparison between age groups. The results will show differences in the level of quality of life among age groups in relation to transportation issues. It is important to note that the analysis examines not only the differences and changed in travel behavior between young and old but also between old people among different age groups.
3. Data
The Metropolitan Transport Association (MTA) is responsible for collecting the household travel survey data of metropolitan Seoul every five years. Local governments of the area conduct the survey, and the MTA monitors the survey and manages and distributes the data collected. Two percent of the households in the area are randomly sampled, and individuals of the household who are aged seven or older report their entire trip occurrences on a weekday of the survey. The household survey consists of three parts of information, including household, personal, and travel characteristics.
A total of 162,223 households representing 590,310 individuals and a total of 227,288 households representing 774,542 individuals returned valid responses in 2002 and 2006, respectively. The analysis, however, includes only those aged over 25 who had graduated from a university. As a result, the analysis includes 362,606 and 493,592 persons for the years 2002 and 2006, respectively. Among these, 232,588 persons (64.1%) in 2002 and 336,774 persons (68.2%) in 2006 reported actual travel on the surveyed day. All the travel and spatial characteristics of the analysis are computed from these respondents.
Age groups and travel characteristics that were input in the analysis are summarized in Table 2 for endnote. Representativeness of overall socio-
demographic variables that are not in the analysis is guaranteed by the sampling procedure for the year of 2002 and 2006, respectively (Seoul Metropolitan Government, 2003, 2007). The elderly were rather underrepresented in 2002.
Several observations are available in Table 3.
Zero-trip patterns much reduced in 2006. Trip complexity stays almost the same, where simple trip patterns (no more than two trips per day) are dominant. Modal split shows a clear decrease in car use and an increase of the same amount in walking and use of the metro/train. The most striking feature is that frequency and total travel time stayed almost the same, whereas travel distance dramatically increased in 2006.
4. Analysis Results
1) Trip ratio
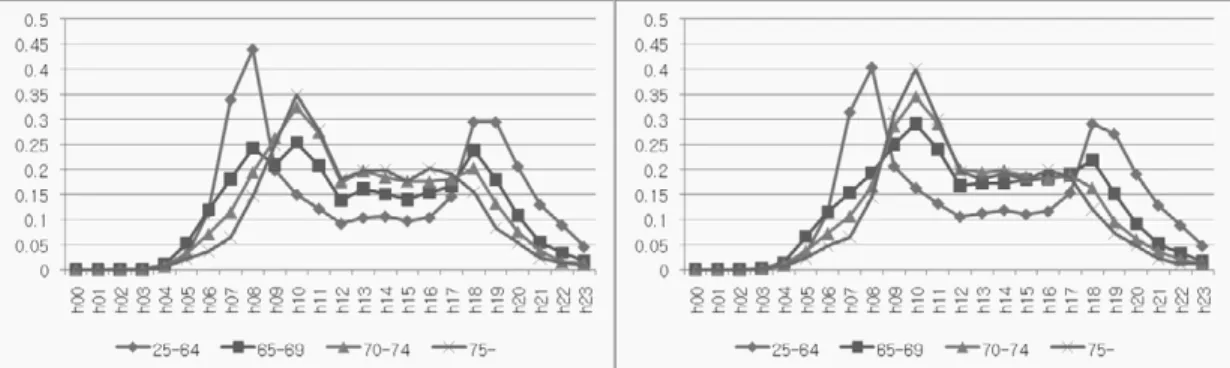
This study assesses mobility level by investigating whether an individual traveled at each time throughout the day. Figure 2 illustrates the proportion of the people who traveled at each time daily. A person was recognized as having traveled at for example 9 a.m. if the person was on the move at any time between 9:00 and 9:59 a.m. Morning peak proportion reduced with the younger and increased with the older people in 2006, and after peak and daytime, proportions slightly increased with younger people and the elderly of 65 to 69. The number of elderly people increased at 10 a.m.
and the younger and particularly the elderly aged 65 to 69 increased their proportions in the afternoon. Overall, mobility was increased in 2006, and the elderly travel became more active.
The ten categories of trip purposes identified in the survey were: pickup, return home, go to work, go to school, go to education other than
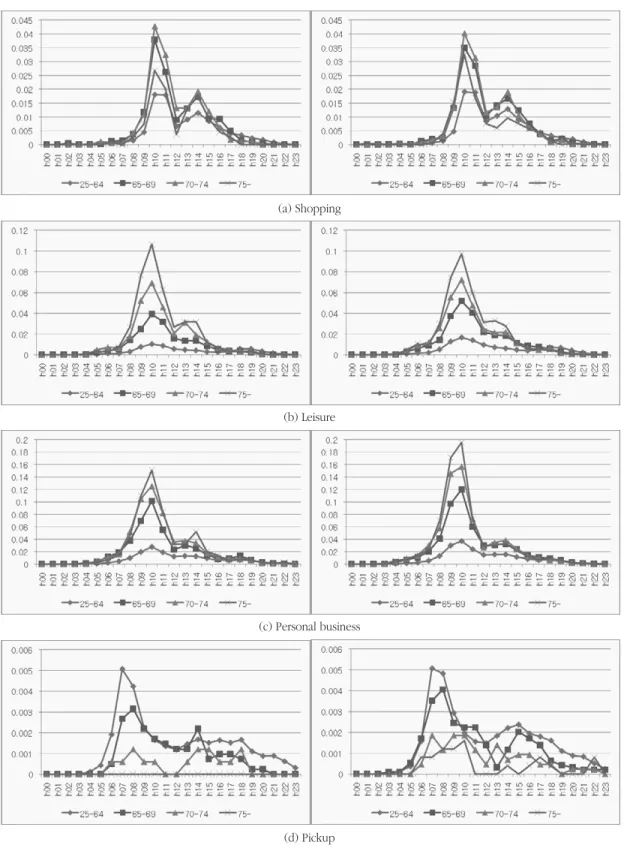
school, travel for business, return to work, shopping, leisure and personal business. Overall, pickup amounts to 1.7% of the total trip purposes, return home 42.8%, work-related 40.7%, schooling-related 2.3%, shopping 3.7%, leisure 2.6%, and personal business 6.1%. The differences in work related characteristics between young and old are obvious, and hence the paper illustrates only the proportion of such trip purposes as shopping, leisure, personal business and pickup in Figure 3. Unlike leisure and personal business, shopping clearly has another peak in the afternoon as well as in the morning for the entire smaple (Figure 3(a)). In general, the elderly engaged in shopping more often than the younger. The elderly aged 70 to 74 are the most frequent shopping travelers at peak hours and seem to have more time for shopping than those aged 65 to 69. The elderly over 75 would have even more time, but shopping requires physical strength as well as money to spend. They hence travel for shopping less frequently compared with the younger elderly. A clear difference between 2002 and 2006 is, however, that this eldest group conducted their shopping trips like the youger elderly groups at the morning peak while reducing their travel during the afternoon peak times.
The elderly aged over 75 are the most frequent
leisure travelers (Figure 3(b)). The difference between elderly age groups was high in 2002.
This difference reduced in 2006, however, as the 65 to 69 increased their travel for leisure during the morning peak. Yet, the differences between age groups of elderly people remain clear. As for personal business trips, such differences became larger and clearer between age groups of elderly people in 2006 (Figure 3(c)). Personal business purposes for the elderly are comparable to work purposes for the younger as the proportion graph shows a single, very high peak. Trips for pickup are mostly related to childcare duty for children under school age (Figure 3(d)). Hence the order of proportion size follows the age from young to old. Changes observed in 2006 are that the elderly in general engaged in this duty more frequently than in 2002, and in particular, those over 75 became newly involved with this duty in the morning. This has often been the case when young and old live together and/or young dual earners live with or near parents and rely on their parents for this duty. This potentially complicates the daily schedule of the elderly. Overall, the distinguishing characteristics of elderly travel behavior have been strengthened through the change in those periods.
Figure 2. Proportion of traveled people over time in 2002 (left) and 2006 (right) by age group
Figure 3. Proportion of traveled people over time by trip purpose in 2002 (left) and 2006 (right) by age group (d) Pickup
(c) Personal business (b) Leisure (a) Shopping
2) Distance, duration and frequency of travel
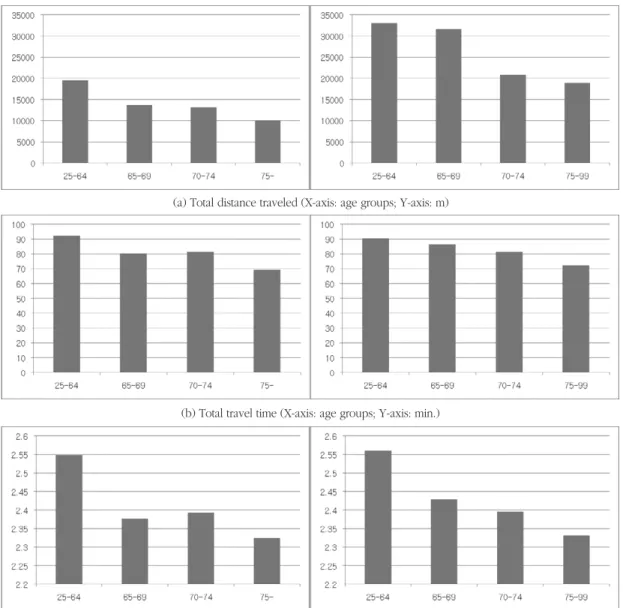
As expected, younger people traveled more frequently and greater distances, and hence spent more time on travel (Figure 4). The most clearly observed change from 2002 to 2006 was that travel distance sharply increased, particularly with
the elderly aged 65 to 69 (Figure 4(a)), whereas travel time and trip frequency remained almost the same (Figure 4(b) and (c)). A relatively high increase of these two characteristics can, however, be observed with the elderly aged 65 to 69. This age group especially showed similar characteristics to younger people in total travel distance.
Figure 4. Distance, duration and frequency of travel in 2002 (left) and 2006 (right) (c) Trip frequency (X-axis: age groups; Y-axis: number of trips)
(b) Total travel time (X-axis: age groups; Y-axis: min.) (a) Total distance traveled (X-axis: age groups; Y-axis: m)
3) Activity space
The time geographic notion of the quality of life is represented by accessibility and mobility that often spatially delineate the size and shape of the activity space. The range and shape of physical movement is particularly important in assessing older people’s quality of life. This study
measures these as depicted in Figure 5. Inner trips in Figure 5(a) indicate a trip within the same neighborhood where the survey respondent lives.
A higher frequency of inner trips given total trip frequency implies a smaller activity space. The elderly had much higher inner trip proportions given even smaller total frequency compared to younger people. Given almost the same trip
Figure 5. Characteristics of activity space in 2002 (left) and 2006 (right) (c) Ratio of distance to the farthest destination to the total travel distance (X-axis: age groups)
(b) Distance to the farthest destination visited (X-axis: age groups; Y-axis: m) (a) Inner trip frequency (X-axis: age groups; Y-axis: number of trips)
frequency of 2002 and 2006, however, inner trip frequency of the elderly has decreased significantly, implying an enlarged activity space for this population. Figure 5(b) shows how far people went away from home on the surveyed day. This would directly indicate the size of the activity space. As expected, younger people traveled longer distances than older people. Two significant changes are observed in the figure.
First, the farthest distance almost doubled from 2002 to 2006. Second, the difference between age groups was clearly between the young and old in 2002, whereas the clear difference in 2006 was between the elderly aged 65 to 69 and the elderly over 70.
Figure 5(c) relates to Figure 1. A higher ratio of distance to the farthest destination visited to total travel distance is more related with simple trip patterns focused on a single trip purpose as in Figure 1(b), whereas a low ratio is likely related to diverse trip patterns as in Figure 1(a). Young people conducting a number of errands to different locations likely have a low ratio, while the elderly would have a high ratio. Figure 5(c) clearly shows this trend. However, 2002 distinguished the young and old as those between 25 to 64 and 65 to 69, whereas 2006 distinguished between those 65 to 69 and over 70. These results imply that the elderly of 65 to
69 have developed activity space characteristics that are more similar to young people than older people in 2006.
4) Modal split
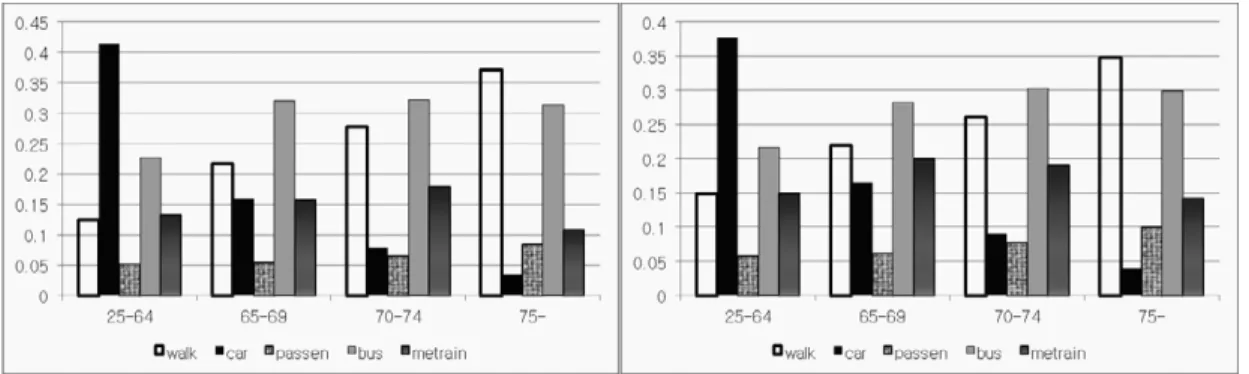
The basic structure of modal split across age groups is largely the same for 2002 and 2006 as shown in Figure 6. Car use ratio was very much reduced with the elderly. The difference is also very large among elderly age groups. The opposite tendency was for the walk mode ratio, increasing linearly along the ages. Car passenger ratio was particularly high with the elderly over 75. Bus ratio clearly distinguished between young people (around 20%) and the elderly (around 30%). Metro and train ratio was high with the elderly of 65 to 74. The over 75 population showed a low ratio of metro and train use.
Physical condition of the elderly seemingly limited the use of this mode in this age. Other modes such as taxis and slow modes are not included in the figure as they had a very low ratio.
The car use ratio has been greatly reduced and the walk ratio has significantly increased among young people from 2002 to 2006., while the ratios of the elderly have stayed the same. Bus ratios were almost the same between 2002 and 2006
Figure 6. Modal split in 2002 (left) and 2006 (right) (X-axis: age groups; Y-axis: modal split %)
across age groups except for those aged 65 to 69.
The 65 to 69 and over 75 populations increased their metro and train use significantly.
5) Spatial characteristics of the destinations visited
This study examines spatial characteristics of the destnations visited with regard to the average number of workers of particualr industries. The industries listed here are those of which the census provides the employment information at the level of dong, and that provide clear interpretations. Such characteristics indicate frequent activities at the travel destinations, which in turn indicate major interests of daily life of the individuals who generate travel. Economic activities and workers in general attract younger people more than older people. In more detail, however, there were identified four types of changes in destination characteistics from 2002 to 2006.
An example of the first type of change is given in Figure 7(a), where almost no change was observed between 2002 and 2006 in frequency distribution across age groups. The slope of distribution of accommodation and restaurant workers in the visited destinations across age groups is almost the same between the two years.
Figure 7(b) shows a high concentration of communication industry workers’ spatial distribution for younger people’s travel destinations. The negative slope of the distribution along the age groups became steeper in 2006. Figure 7(c) shows the opposite direction of change in the distribution slope from negative to positive along the age groups. Leisure and game industry workers’ spatial distribution changed to be located in the area, where the elderly visited more than young people. Figure 7(d) illustrates yet another type of change in workers’ spatial distribution, where the growth
was selective for particular age groups due to the nature of the industry. Health is everyone’s concern. Immediately following retirement, people aged 65 to 69 became more and more interested in managing their health. Many people over 75 have actual needs for health care on a daily basis. Such needs have previously existed.
However, due to the improved welfare and public transportation systems, the elderly seem to have had greater access to those services both economically and physically in 2006.
It is well known fact that transportation and land use are interrelated. Seoul household travel surveys suggests that different types of change in the distribution of workers across age groups seems first driven by the change in industrial activity distribution across urban spaces, which then induces change in individual travel behavior.
Some industrial activities such as hotels and restaurants seem to have had no significant change in their spatial distribution during the period, whereas other industrial activities such as communication and information technology have observed a rapid growth in a few selected, economically viable spaces that were typically the spaces for young people’s daily activities in the urban area. Other industrial sectors that are related more to elderly activities showed elderly oriented growth in spatial distribution of workers in the industries. All these changes in land use activities induced different types of changes in travel behavior among age groups, where some particular industrial sector activities were more related to elderly travel behavior.
6) Discussion
The anaysis results show the difference between age groups in two major aspects. First the behavioral characteristics of elderly travelers were very different from younger people’s travel behavior in each survey year (Figure 2, 3). This
Figure 7. Employment characteristics of the destinations visited in 2002 (left) and 2006 (right) (d) The number of workers in health industry (X-axis: age groups)
(c) The number of workers in leisure and game industry (X-axis: age groups) (b) The number of workers in communication industry (X-axis: age groups) (a) The number of workers in accommodation and restaunrant industry (X-axis: age groups)
was expected, which can be attributed to the difference in physical and social characteristics between the two age groups. A modal split where the elderly heavily used public modes of transportation, compared to younger people who dominantly used cars particularly reflects the nature of transportation systems in metropolitan Seoul that are transit friendly (Figure 6). Second, and more importantly, the elderly changed their travel behavior much more than younger people did in may aspects. Elderly mobility has increased significantly (Figure 4), and the activity space for this group was enlarged (Figure 5). As for the spatial characteristics of trip destinations, a number of changes were identified (Figure 7).
The explanation for these changes is potentially twofold. The first reason for such change is the rapid aging of the society overall. Rapidly increased elderly poplulation throughout the area during the two survey periods changed the mentality of the elderly, particualrly those aged 65 to 69. The elderly do not think of themselves as old as they once did, and do not distinguish themselves from yonger peole in many aspects of activity participation. The elderly of the current society participate in many more activities than they once did. This generates an enlarged demand for travel.
Secondly, recent reforms of the public transportation system in Seoul in 2004 recognized this enlaged travel demand. On July 1, 2004, the city of Seoul launched a policy measure that reformed public transportation systems. The most important policy package, among others, concerned the issuance of a new transfer system (Shin et al., 2008). It offered travelers an almost free transfer between public modes of transportation, including bus to bus, bus to metro and metro to bus transfers when the transfer takes place within half an hour between two modes. For example, the traveler pays only USD (USA dollar) 0.3 when transferring from a local
bus (USD 0.6) to the metro (USD 0.9) or pays no money from mainline bus (USD 0.9) to metro and from metro to local/mainline bus. That is, the traveler pays only the basic (terminal) cost once for any number of transfers in single travel. This integrated public transportation system provides passengers with an easier way to connect between public modes of transportation as well as a substantial monetary benefit. This new system resulted in increased mobility and improved modal split of the general population.
As shown in Table 2, these reforms resulted in faster and longer travel by public modes, particularly in the metro and train systems.
The impact of the reform, however, is seen more substantially among the elderly, aged 65 to 69 in particular. The fact that transfers between the bus and metro became free, together with the fact that using the metro has been free for those over 65 since 1984, would explain the sharp increase in travel distance of this age group.
Compared to this group, other elderly groups increased their travel distance less radically, which might be due to the fact that they were not as able to travel long distances because of the lack of physical strength. The reform also helped the increased travel speed shown by almost the same total travel time given the high increase in travel distance. Given these factors, the fact that trip frequency stayed the same is consistent with that trip pattern complexity staying the same, where simple trip patterns were still dominant.
Change in trip frequency is more likely related to the change in organization of daily activities than travel distance and travel time. Policy reform immediately impacted travel distance and travel time, but it may take more time to impact trip frequency. The reform seems to also have had an impact on activity space enlargement, particualrly among those aged 65 to 69. Another important impact of the reform was on modal split. It facilitated the elderly, in particular the aged 65 to
69 group, to use the metro and train more frequently, while bus travel remained amost the same, and as a result, the metro gained most of the increased travel of the 65 to 69 group.
5. Conclusion
This paper aimed to examine different characteristics of elderly travel behavior and changes in comparison with younger people, given that the world’s fastest aging process is occurring in Korea (ROK). To this end, the paper analyzed household travel survey data collected in 2002 and 2006 in metropolitan Seoul. The number of participants in the survey was 590,310 and 774,542 in 2002 and 2006, respectively. The data provides detailed information of individual travel history on the survey day together with household and personal information. The analysis focused on identifying changes in travel behavior and spatial characteristics of trip destinations.
The results are summarized as follows. First, mobility measured by proportion of zero-trip patterns and proportion of traveled people over time by age groups has been improved during the period from 2002 to 2006. The reform seems to have helped the elderly more actively participate in various activities and resultant travel behavior. Second, the elderly more actively participated in non-work activities such as shopping, leisure and personal business. Third, during the period, overall travel distance has been significantly increased while travel time remained the same. The elderly aged 65 to 69 reacted to the changed environment in public transportation systems most actively. Fourth, activity space has been enlarged during the period across age groups, where the elderly from 65 to 69 enlarged the activity space to the largest extent and showed the most diverse use of
activity space. Fifth, the elderly, in particular those 65 to 75 greatly increased their metro use.
Sixth, changes in spatial characteristics of destinations visited indicate that different types of change in the distribution of workers across age groups seemed first driven by the change in industrial activity distribution across urban spaces, which then induced changes in individual travel behavior.
The analysis results of the current paper suggest the following research agenda. First, more investigation is needed regarding which parts of change were from the policy reform measures and which were from social and institutional changes in the society in general.
Second, future research should focus on not only the simple impact of single age variables, but also the combined impact of various factors. For example, income and household composition need to be examined to obtain more sophisticated insight on age effects among elderly age groups. Finally, the relationships between land-use and travel behavior need a detailed investigation to derive a more tangible results for both the academic and policy purposes. This should also include an in-depth study on the relationships between urban spatial structure and individual travel behavior of the elderly people.
We set these works as a future research agenda to develop a customized policy measure differentiating transportation services among different age groups.
References
Alsnih, R. and D. Hensher, 2003, The mobility and accessibility expectations of seniors in an aging population, Transportation Research A, 37, 903- 916.
Balcombe, R., A. Astrop, and E. Hill, 1998, Concessionary Fares: Trip Generation among
Elderly Population, TRL Report 366.
Banister, D. and A. Bowling, 2004, Quality of life for the elderly: The transport dimension, Transport Policy, 11, 105-115.
Barry, B., 1998, Social exclusion, social isolation and the distribution of income, Center for Analysis of Social Exclusion, London School of Economics.
Church, A. and M. Frost, 1999, Transport and Social Exclusion in London: Exploring current and potential indicators, London: London Transport Planning.
Delbosc, A. and G. Currie, 2011, Exploring the relative influences of transport disadvantage and social exclusion on well-being, Transport Policy, 18, 555-562.
Dijst, M., 2004, ITCs and accessibility, in M. Beuthe, V.
Himanen, and L. Zamparini (eds.), Transport Developments and Innovations in an Evolving World, Springer, 27-46.
Duguid, G., 1995, Deprived Areas in Scotland: result of an analysis of the 1991 Census Edinburgh, The Scottish Office: Central Research Unit.
Gibb, K., A. Kearns, M. Keoghan, D. MacKay, and I.
Turok, 1998, Revising the Scottish Area Deprivation Index, The Scottish Office: Central Research Unit.
Harrison, A. and D. Ragland, 2003, Consequence of driving reduction or cessation for older adults, Transportation Research Record, 1843, 96-104.
Jamie E., L. Spinneya, M. Scottb, and K. Newboldb, 2009, Transport mobility benefits and quality of life: A time-use perspective of elderly Canadians, Transport Policy, 16, 1-11.
Joh, C. H., 2009, Daily Travel Pattern using Public Mode Use in Seoul:An Analysis using a Multi- Dimensional Motif Search, Journal of the Korea Geographical Society, 44(2), 176-186.
Kenyon S., G. Lyos, and J. Rafferty, 2002, Transportation and social exclusion: investigating the possibility of promoting inclusion through virtual mobility, Journal of Transport Geography, 10, 207-219.
Keum, K. J., 1999, Study of the travel characteristics of the aged and the disabled with the focus on the basic transportation environment, Journal of the Korean Society of Civil Engineers, 19(3), 361-368.
(in Korean)
Kim, K. H., 2001, Survey of the travel demand of the aged and the disabled and the policy measures, Seoul Development Institute. (in Korean)
Kim, S. and G. Ulfarsson, 2004, Travel mode choice of the elderly: Effects of personal, household, neighborhood, and trip characteristics, Transportation Research Record, 1894, 117-126.
Lee, H. S. and H. Y. Lee, 2009, Differential Changes in Commuter’s Mode Choice after the Intergrated Public Transit System in Seoul Metropolitan City, Journal of the Korea Geographical Society, 44(3), 323-338.
Lee, P. and A. Murie, 1999, Literature review of social exclusion, Edinburgh: Central Research Unit.
Lee, K., J. S. Park, H. S. Kim and C. H. Joh, 2010, Relationship between Diurnal Patterns of Passenger Ridership and Passenger Trip Chains on the Metropolitan Seoul Metro System, Journal of the Korea Geographical Society, 45(5), 592- 608.
Litman, T., 2003, Social inclusion as a transport planning issue in Canada, Victoria Transport Policy Institute.
Littlewood, P. and S. Herkammer, 1999, Identifying social exclusion: Some problems of meaning, in P. Littlewood (eds.), Social Exclusion in Europe:
Problems and Paradigms, Ashgate.
Lyons, G., 2003, The introduction of social exclusion into the field of travel behavior, Transport Policy, 10, 339-342.
McGregor, A. and M. McConnachie, 1995, Social Exclusion, urban regeneration and economic reintegration, Urban Studies, 32(10), 1587-1600.
Mercado, G., Paez, A., and K. Newbold, 2006, Transport Policy in aging societies: An international comparison and implications for Canada, Paper presented at the 85th Transportation Research Board Annual Meeting, Washington, D.C.
Metz, D., 2000, Mobility of older people and their quality of life, Transport Policy, 7, 149-152.
Metz, D., 2003, Transport policy for an aging population, Transport Reviews, 23, 375-386.
Newbold, K., D. Scott, and J. Spinney, 2005, Travel behavior within Canada’s older population: a
cohort analysis, Journal of Transport Geography, 13(4), 340-351.
Noh, S. H., 1994, Analysis of the elderly travel pattern in Seoul, Journal of the Korean Gerontological Society, 14, 1-16. (in Korean)
Noh, S. H., 1998, On the geographical research of the transportation excluded population in urban area, Journal of Korea Urban Studies, 14, 47-60.
(in Korean)
Pacione, M., 1995, The geography of deprivation in rural Scotland, Transactions of the Institute of British Geographers, 20, 173-192.
Park, E. J., J. H. Seol, and I. S. Kim, 1999, Research on the special transport system for the disabled and the elderly, Korean Sports Association of the Welfare of the Disabled. (in Korean)
Park, G. S., 2007, Psychological factors affecting the subjective security of the Korean elderly drivers, Proceedings of the Annual Meetings of Korean Psychological Society. (in Korean)
Preston, J. and F. Rajéa., 2007, Accessibility, mobility and transport-related social exclusion, Journal of Transport Geography, 15, 151-160
Priya, T. and A. Uteng., 2009, Dynamics of transport and social exclusion: effects of expensive driver’s license, Transport Policy, 16(3), 130-139.
Seol, J. H., Y. S. Shin, and I. K. Park, 2004, Study for the service improvement of welfare transportation of the aged and disabled, Korea Transportation Institute. (in Korean)
Seoul Metropolitan Government, 2003, Report on the 2002 Household Travel Survey. (in Korean) Seoul Metropolitan Government, 2007, Report on the
2006 Household Travel Survey. (in Korean) Shin, S. I., C. J. Lee, and Y. C. Cho, 2008, A methodology
to evaluate regional public transportation
services using public transport use data, Transportation Technology and Policy, 5, 111- 127. (in Korean)
Shin, Y. S., 2000, Study on the guideline of the transport mode and facility provision for the aged and disabled, Korea Transportation Institute. (in Korean)
Shin, Y. S., 2002, Manual for the evaluation and maintenance of the pedestrian transportation environment for the aged and disabled, Korea Transportation Institute. (in Korean)
Smith, G. and G. Sylverstre, 2001, Determinants of the travel behavior of the suburban elderly, Growth and Change, 32, 395-412.
Stanley, J. and D. Vella-Brodrick, 2009. The usefulness of social exclusion to inform social policy in transport, Transport Policy, 16, 106-114.
Tyler, N. (ed.), 2002, Accessibility and the Bus Systems, Telford, London.
United Nations, 2009, World Population Prospects: The 2008 Population Data Base, United Nations.
Young, R., 1999, Prioritizing family health needs: A time- space analysis of women’s health-related behaviors, Social Science and Medicine, 48, 797- 813.
Correspondence: Chang-Hyeon Joh, Department of Geography, Kyung Hee University, 1 Hoegi-dong, Dongdaemun-gu, Seoul, 130-701, Republic of Korea (e-mail:
[email protected], Phone: +82-2-961-9264)
교신: 조창현, 서울시 동대문구, 회기동 1 경희대학교 지리학과 (이메일: [email protected], 전화: 02-961-9264)
Recieved November 17, 2011 Revised December 22, 2011 Accepted December 28, 2011
Endnote
Table 1. Percentage of the population aged over 65 (United Nations, 2009)
Korea (ROK) Japan North America Europe World
2005 9.3 19.9 12.5 15.9 7.3
2010 11.0 22.6 13.1 16.3 7.6
2020 15.4 28.5 16.3 19.0 9.3
2050 34.2 37.8 22.0 27.4 16.2
Table 2. Travel characteristics of household travel survey data
Apr. 16 - Apr. 18, 2002 Oct. 30 - Nov. 7, 2006
# persons over 25 yr. 362,606 493,592
Age category 25-64 (93.3), 65-69 (2.9), 70-74 (1.7), 25-64 (91.7), 65-69 (3.7), 70-74 (2.2),
≥75 (2.1) ≥75 (2.4)
If trip conducted Zero-trip (35.9), Non zero-trip (64.1) Zero-trip (31.8), Non zero-trip (68.2)
# persons traveled 232,588 336,774
Trip pattern Simple (72.5), Complex (27.5) Simple (71.9), Complex (28.1)
Total distance traveled 19.3 km 32.8 km
Total travel time 91.9 min. 90.2 min.
Trip frequency 2.54 2.55
Inner trip frequency 0.49 0.48
Distance to the farthest 9.0 km 15.6 km
Walk (12.8), Car-driver (40.6), Car- Walk (15.4), Car-driver (36.5), Car- Modal split passenger (5.2), Bus (23.0), Metrain (13.4), passenger (5.8), Bus (22.0), Metrain
Taxi (2.0), Other mode (2.9) (15.1), Taxi (1.5), Other mode (3.7) Note: Figures in the parentheses denote percentage of the category. Simple trip pattern includes one or two trips, whereas
complex trip pattern includes three or more trips. Bus includes commuting bus, mainline bus, local bus, express city bus, express intercity bus, and shuttle bus. Metrain includes metro, train and high speed train. Other mode includes motorbike, bike, and other slow modes.