- 1 -
국제 해상운송 네트워크 분석에 대한 연구
선사의 운송네트워크를 중심으로
송민근 *, 차영두 **, 여기태 ***
An analysis of the International Maritime Transportation focusing on Maersk Line Container Networks
Song, Min-Geun · Cha, Young-Doo · Yeo, Gi-tae
Abstract
By using social network analysis, this study examined 102 countries, 281 ports, and 6,318 maritime routes associated with the global network of the Maersk Line.
With the ‘Belt and Road’ in place, China is developing ports, expanding the cooperation with major ports, and increasing its influence on maritime transport. China’s ports’ reform and development implies establishing stable and independent logistic networks for supply of raw materials as well as exports and imports. This is closely related not only to individual ports’ competitiveness, but also to relational structures between maritime powerhouses such as the US which has the largest share and influence in the global market and the sur— — - rounding countries. In this regard, an analysis of the maritime transport needs to consider the characteristics of individual ports together with those of each country. This study iden- tified the characteristics of each port in light of the relationships in the global network of Maersk and applied them to each country. Moreover, the individual networks of China, the US, and Korea are compared. The findings showed that China, the US, Panama, Malaysia, and Spain accounted for large shares of the global network, while the shares of China, Korea, Taiwan, and Vietnam were high in China’s network. In addition, by comparing in- dividual networks of China, the US, and Korea, it emerged that Korean ports such as Busan and Gwangyang had secured a high level of competitiveness in the Chinese network.
Key words: Maersk, Maritime routes, Port, China, Network Analysis
▷ 논문접수: 2017. 01. 31. ▷ 심사완료: 2017. 06. 05. ▷ 게재확정: 2017. 06. 24.
인천대학교 동북아물류대학원 박사 제 저자
* , 1 , [email protected]
인천대학교 동북아물류대학원 석사과정 제 저자
** , 2 , [email protected]
인천대학교 동북아물류대학원 교수 교신저자
*** , , [email protected]
서 론 .
Ⅰ
・
・ ・
・
・
・
・
・
・
・
・
・
≠
・
식
식그림 1. 머스크라인 해상네트워크 확인경로
표 1. 해상운송 네트워크 분석의 대상 개요
대상기관 국가 항만 경로
Maersk Line 102국가 281항만 6,318경로
표 2. 머스크 해상네트워크의 국가별 항만수
순위 국가 항만 수( )
비중(%) 전체항만 (
개 281 )
1 US 20 7.1
2 Brazil 15 5.3
3 China 13 4.6
4 Italy 11 3.9
5 Turkey 9 3.2
6 India 8 2.8
6 New Zealand 8 2.8
8 Japan 6 2.1
8 UK 6 2.1
10 Australia 5 1.8
10 Chile 5 1.8
10 Colombia 5 1.8
10 Saudi Arabia 5 1.8
10 Spain 5 1.8
15 Algeria 4 1.4
15 Canada 4 1.4
15 France 4 1.4
15 Mexico 4 1.4
15 Nigeria 4 1.4
15 Portugal 4 1.4
15 Russia 4 1.4
21 Egypt 3 1.1
21 Germany 3 1.1
21 Korea 3 1.1
21 Malaysia 3 1.1
21 Morocco 3 1.1
21 Mozambique 3 1.1
21 Philippines 3 1.1
21 South Africa 3 1.1
21 Sweden 3 1.1
합계 176 62.6
표 3. 머스크 해상네트워크 연결중심성 연결중심성 상위 30위 항만
순위 항만 국가 Deg
ree 평균 대비 배 ( )
1 Algeciras Spain 44 7.8
2 Tanjung Pelepas Malaysia 39 6.9
3 Singapore Singapore 31 5.5
4 Busan Korea 25 4.4
5 Manzanillo Panama 22 3.9
5 Santos Brazil 22 3.9
5 Salalah Oman 22 3.9
8 Shanghai China 21 3.7
9 Rotterdam Netherlands 20 3.6
9 Jebel Ali Dubai UAE 20 3.6
11 Tangier Port Morocco 19 3.4
12 Hong Kong China 19 3.4
13 Port Said East Egypt 18 3.2
14 Antwerp Belgium 18 3.2
15 Bremerhaven Germany 18 3.2
16 Ningbo China 18 3.2
17 Valencia Spain 17 3.0
18 Newark US 16 2.8
19 Yantian China 16 2.8
20 Tauranga New Zealand 15 2.7
21 Yokohama Japan 15 2.7
22 Marsaxlokk Malta 14 2.5
23 Cartagena Colombia 14 2.5
24 Balboa Panama 13 2.3
25 Charleston US 13 2.3
26 Nansha New Port China 13 2.3
27 Savannah US 13 2.3
28 Chiwan China 13 2.3
29 Port Klang Malaysia 12 2.1
30 Qingdao China 12 2.1
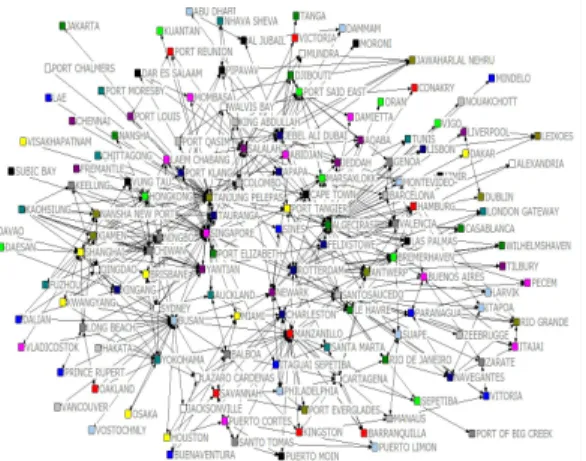
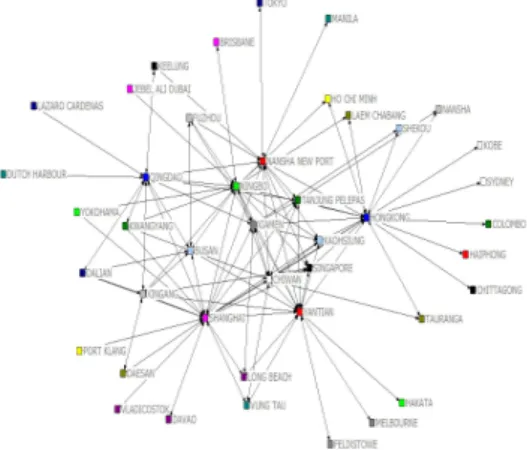
그림 2. 머스크 해상네트워크 SNA 분석지도
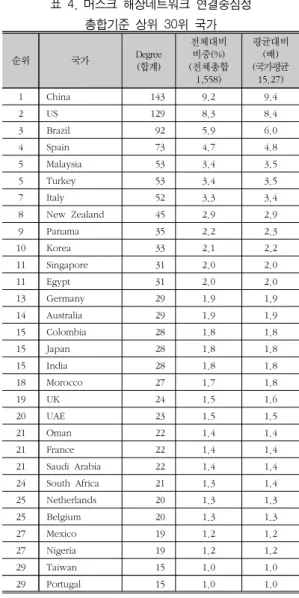
표 4. 머스크 해상네트워크 연결중심성 총합기준 상위 30위 국가
순위 국가 Degree
합계
( )
전체대비 비중(%) 전체총합 (
1,558)
평균대비 배 ( ) 국가평균 (
15.27)
1 China 143 9.2 9.4
2 US 129 8.3 8.4
3 Brazil 92 5.9 6.0
4 Spain 73 4.7 4.8
5 Malaysia 53 3.4 3.5
5 Turkey 53 3.4 3.5
7 Italy 52 3.3 3.4
8 New Zealand 45 2.9 2.9
9 Panama 35 2.2 2.3
10 Korea 33 2.1 2.2
11 Singapore 31 2.0 2.0
11 Egypt 31 2.0 2.0
13 Germany 29 1.9 1.9
14 Australia 29 1.9 1.9
15 Colombia 28 1.8 1.8
15 Japan 28 1.8 1.8
15 India 28 1.8 1.8
18 Morocco 27 1.7 1.8
19 UK 24 1.5 1.6
20 UAE 23 1.5 1.5
21 Oman 22 1.4 1.4
21 France 22 1.4 1.4
21 Saudi Arabia 22 1.4 1.4
24 South Africa 21 1.3 1.4
25 Netherlands 20 1.3 1.3
25 Belgium 20 1.3 1.3
27 Mexico 19 1.2 1.2
27 Nigeria 19 1.2 1.2
29 Taiwan 15 1.0 1.0
29 Portugal 15 1.0 1.0
표 5. 머스크 해상네트워크 연결중심성 평균기준 상위 30위 국가
순위 국가 연결중심성
평균
( )
평균대비 배( ) 국가평균 (
5.43)
1 Singapore 31.0 5.7
2 Oman 22.0 4.1
3 Netherlands 20.0 3.7
4 Malaysia 17.7 3.3
5 Panama 17.5 3.2
6 Spain 14.6 2.7
7 Malta 14.0 2.6
8 Bahamas 12.0 2.2
9 UAE 11.5 2.1
10 China 11.0 2.0
10 Korea 11.0 2.0
12 Egypt 10.3 1.9
13 Belgium 10.0 1.8
13 Sri Lanka 10.0 1.8
15 Germany 9.7 1.8
16 Morocco 9.0 1.7
16 Benin 9.0 1.7
18 Namibia 8.0 1.5
19 Taiwan 7.5 1.4
20 South Africa 7.0 1.3
20 Israel 7.0 1.3
20 Honduras 7.0 1.3
20 Jamaica 7.0 1.3
24 US 6.5 1.2
25 Brazil 6.1 1.1
26 Dominica 6.0 1.1
26 Mauritius 6.0 1.1
28 Turkey 5.9 1.1
29 Australia 5.8 1.1
30 New Zealand 5.6 1.0
표 6. 머스크 해상네트워크 연결성의 대륙별 특성 단위 ( : Degree)
국가
수 평균 평균대비
배
( ) 합계 비중
(%)
전 체 102 15.27 1.0 1,558 100.0
아시아 25 21.48 1.4 537 34.5
유럽 20 15.85 1.0 317 20.3
오세아니아 5 16.80 1.1 84 5.4
북미 14 17.71 1.2 248 15.9
남미 8 20.25 1.3 162 10.4
아프리카 30 7.00 0.5 210 13.5
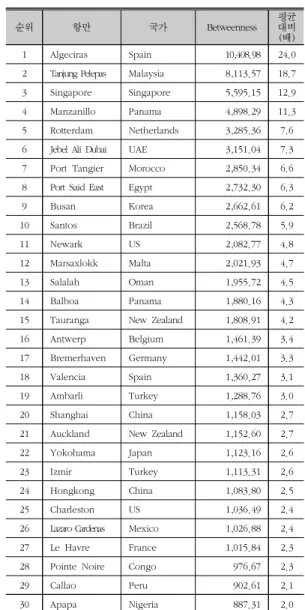
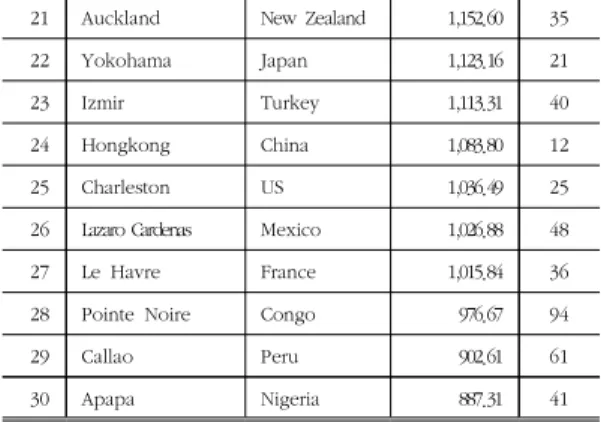
표 7. 머스크 해상네트워크 매개성 상위 30위 항만
순위 항만 국가 Betweenness 평균
대비( )배
1 Algeciras Spain 10,408.98 24.0
2 Tanjung Pelepas Malaysia 8,113.57 18.7
3 Singapore Singapore 5,595.15 12.9
4 Manzanillo Panama 4,898.29 11.3
5 Rotterdam Netherlands 3,285.36 7.6
6 Jebel Ali Dubai UAE 3,151.04 7.3
7 Port Tangier Morocco 2,850.34 6.6
8 Port Said East Egypt 2,732.30 6.3
9 Busan Korea 2,662.61 6.2
10 Santos Brazil 2,568.78 5.9
11 Newark US 2,082.77 4.8
12 Marsaxlokk Malta 2,021.93 4.7
13 Salalah Oman 1,955.72 4.5
14 Balboa Panama 1,880.16 4.3
15 Tauranga New Zealand 1,808.91 4.2
16 Antwerp Belgium 1,461.39 3.4
17 Bremerhaven Germany 1,442.01 3.3
18 Valencia Spain 1,360.27 3.1
19 Ambarli Turkey 1,288.76 3.0
20 Shanghai China 1,158.03 2.7
21 Auckland New Zealand 1,152.60 2.7
22 Yokohama Japan 1,123.16 2.6
23 Izmir Turkey 1,113.31 2.6
24 Hongkong China 1,083.80 2.5
25 Charleston US 1,036.49 2.4
26 Lazaro Cardenas Mexico 1,026.88 2.4
27 Le Havre France 1,015.84 2.3
28 Pointe Noire Congo 976.67 2.3
29 Callao Peru 902.61 2.1
30 Apapa Nigeria 887.31 2.0
표 8. 머스크 해상네트워크 매개중심성 상위 30위 항만의 연결성 비교
순위 항만 국가 Betweenne
ss
연결 중심성 순위
1 Algeciras Spain 10,408.98 1
2 Tanjung Pelepas Malaysia 8,113.57 2
3 Singapore Singapore 5,595.15 3
4 Manzanillo Panama 4,898.29 5
5 Rotterdam Netherlands 3,285.36 9
6 Jebel Ali Dubai UAE 3,151.04 10
7 Port Tangier Morocco 2,850.34 11
8 Port Said East Egypt 2,732.30 13
9 Busan Korea 2,662.61 4
10 Santos Brazil 2,568.78 6
11 Newark US 2,082.77 18
12 Marsaxlokk Malta 2,021.93 22
13 Salalah Oman 1,955.72 7
14 Balboa Panama 1,880.16 24
15 Tauranga New Zealand 1,808.91 20
16 Antwerp Belgium 1,461.39 14
17 Bremerhaven Germany 1,442.01 15
18 Valencia Spain 1,360.27 17
19 Ambarli Turkey 1,288.76 32
20 Shanghai China 1,158.03 8
21 Auckland New Zealand 1,152.60 35
22 Yokohama Japan 1,123.16 21
23 Izmir Turkey 1,113.31 40
24 Hongkong China 1,083.80 12
25 Charleston US 1,036.49 25
26 Lazaro Cardenas Mexico 1,026.88 48
27 Le Havre France 1,015.84 36
28 Pointe Noire Congo 976.67 94
29 Callao Peru 902.61 61
30 Apapa Nigeria 887.31 41
표 9. 머스크 해상네트워크 매개중심성 총합기준 상위 30위 국가
순위 국가 매개중심성
합계
( )
전체대비 비중(%) 해상총합 ( 104,509.71)
평균대비배( ) 국가평균값 ( 1,077.42 )
1 Spain 11,932.09 11.4 11.8
2 Malaysia 9,119.34 8.7 9.1
3 Panama 6,778.45 6.5 6.7
4 Singapore 5,595.15 5.4 5.6
5 China 5,106.70 4.9 5.1
6 US 4,923.74 4.7 4.9
7 Turkey 3,653.19 3.5 3.6
8 Egypt 3,506.99 3.4 3.5
9 New Zealand 3,414.84 3.3 3.4
10 UAE 3,290.04 3.1 3.3
11 Brazil 3,287.37 3.1 3.3
12 Netherlands 3,285.36 3.1 3.3
13 Morocco 3,098.37 3.0 3.1
14 Korea 2,664.99 2.5 2.6
15 Malta 2,021.93 1.9 2.0
16 Germany 2,014.45 1.9 2.0
17 Oman 1,955.72 1.9 1.9
18 Nigeria 1,918.90 1.8 1.9
19 France 1,908.52 1.8 1.9
20 Belgium 1,813.02 1.7 1.8
21 Colombia 1,259.92 1.2 1.3
22 Italy 1,245.69 1.2 1.2
23 Japan 1,223.02 1.2 1.2
23 Australia 1,069.86 1.0 1.1
25 Mexico 1,053.92 1.0 1.0
26 South Africa 1,042.09 1.0 1.0
27 Congo 976.67 0.9 1.0
28 Peru 902.61 0.9 0.9
29 UK 860.25 0.8 0.9
30 Saudi Arabia 855.03 0.8 0.8
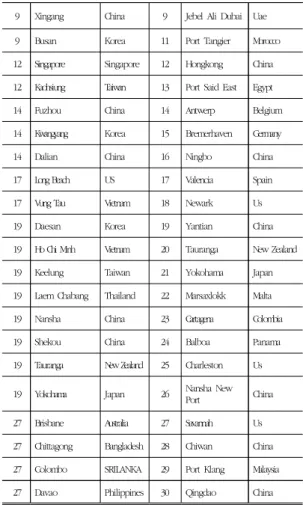
표 11. 중국의 개별 해상네트워크 연결중심성 기준 상위 30위 항만
중국 개별 해상네트워크 전체 해상네트워크
순위 항만 국가 순위 항만 국가
1 Shanghai China 1 Algeciras Spain
2 Hongkong China 2 Tanjung
Pelepas Malaysia
3 Ningbo China 3 Singapore Singapore
4 Yantian China 4 Busan Korea
5 Nansha China 5 Manzanillo Panama
6 Chiwan China 5 Santos Brazil
7 Qingdao China 5 Salalah Oman
8 Xiamen China 8 Shanghai China
9 Tanjung Pelepas Malaysia 9 Rotterdam Netherlands 표 10. 머스크 해상네트워크 매개성의 대륙별 특성
단위
( : Betweenness)
국가
수 평균
평균 대비 배 ( )
합계 비중
(%)
전 체 97 1,077.42 1.0 104,509.71 100
아시아 24 1,508.30 1.4 36,199.25 34.6
유럽 19 1,420.52 1.3 26,989.97 25.8
오세아니아 5 956.92 0.9 4,784.59 4.6
북미 14 1,014.05 0.9 14,196.71 13.6
남미 7 891.71 0.8 6,241.98 6.0
아프리카 28 574.90 0.5 16,097.21 15.4
9 Xingang China 9 Jebel Ali Dubai Uae 9 Busan Korea 11 Port Tangier Morocco 12 Singapore Singapore 12 Hongkong China 12 Kaohsiung Taiwan 13 Port Said East Egypt
14 Fuzhou China 14 Antwerp Belgium
14 Kwangyang Korea 15 Bremerhaven Germany
14 Dalian China 16 Ningbo China
17 Long Beach US 17 Valencia Spain
17 Vung Tau Vietnam 18 Newark Us
19 Daesan Korea 19 Yantian China
19 Ho Chi Minh Vietnam 20 Tauranga New Zealand
19 Keelung Taiwan 21 Yokohama Japan
19 Laem Chabang Thailand 22 Marsaxlokk Malta 19 Nansha China 23 Cartagena Colombia
19 Shekou China 24 Balboa Panama
19 Tauranga New Zealand 25 Charleston Us
19 Yokohama Japan 26 Nansha New
Port China
27 Brisbane Australia 27 Savannah Us 27 Chittagong Bangladesh 28 Chiwan China 27 Colombo SRILANKA 29 Port Klang Malaysia 27 Davao Philippines 30 Qingdao China
표 12. 중국의 개별 해상네트워크 매개중심성 기준 상위 15위 항만
중국 개별 해상네트워크 전체 해상네트워크
순위 항만 국가 순위 항만 국가
1 Hongkong China 1 Algeciras Spain
2 Shanghai China 2 Tanjung
Pelepas Malaysia
3 Ningbo China 3 Singapore Singap
ore
4 Yantian China 4 Manzanillo Panama
5 Nansha
New Port China 5 Rotterdam Nether lands
6 Qingdao China 6 Jebel Ali
Dubai Uae
7 Xiamen China 7 Tangier Morocco
8 Chiwan China 8 Port Said
East Egypt
9 Tanjung Pelepas
Malay
sia 9 Busan Korea
10 Xingang China 10 Santos Brazil
11 Busan Korea 11 Newark Us
12 Singapore Singa
pore 12 Marsaxlok
k Malta
13 Fuzhou China 13 Salalah Oman
14 Kwangyang Korea 14 Balboa Panama
15 Kaohsiung Taiwan 15 Tauranga New Zealand
그림 4. 중국 주요 항만의 개별 해상네트워크
그림 5. 미국 주요 항만의 개별 해상네트워크
그림 6. 한국 주요 항만의 개별 해상네트워크
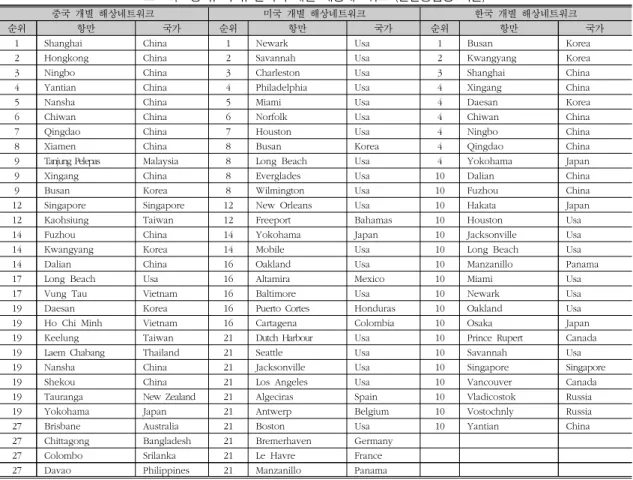
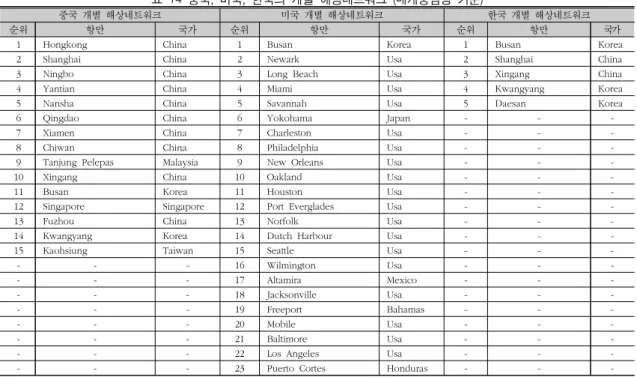
표 13. 중국 미국 한국의 개별 해상네트워크 연결중심성 기준, , ( )
중국 개별 해상네트워크 미국 개별 해상네트워크 한국 개별 해상네트워크
순위 항만 국가 순위 항만 국가 순위 항만 국가
1 Shanghai China 1 Newark Usa 1 Busan Korea
2 Hongkong China 2 Savannah Usa 2 Kwangyang Korea
3 Ningbo China 3 Charleston Usa 3 Shanghai China
4 Yantian China 4 Philadelphia Usa 4 Xingang China
5 Nansha China 5 Miami Usa 4 Daesan Korea
6 Chiwan China 6 Norfolk Usa 4 Chiwan China
7 Qingdao China 7 Houston Usa 4 Ningbo China
8 Xiamen China 8 Busan Korea 4 Qingdao China
9 Tanjung Pelepas Malaysia 8 Long Beach Usa 4 Yokohama Japan
9 Xingang China 8 Everglades Usa 10 Dalian China
9 Busan Korea 8 Wilmington Usa 10 Fuzhou China
12 Singapore Singapore 12 New Orleans Usa 10 Hakata Japan
12 Kaohsiung Taiwan 12 Freeport Bahamas 10 Houston Usa
14 Fuzhou China 14 Yokohama Japan 10 Jacksonville Usa
14 Kwangyang Korea 14 Mobile Usa 10 Long Beach Usa
14 Dalian China 16 Oakland Usa 10 Manzanillo Panama
17 Long Beach Usa 16 Altamira Mexico 10 Miami Usa
17 Vung Tau Vietnam 16 Baltimore Usa 10 Newark Usa
19 Daesan Korea 16 Puerto Cortes Honduras 10 Oakland Usa
19 Ho Chi Minh Vietnam 16 Cartagena Colombia 10 Osaka Japan
19 Keelung Taiwan 21 Dutch Harbour Usa 10 Prince Rupert Canada
19 Laem Chabang Thailand 21 Seattle Usa 10 Savannah Usa
19 Nansha China 21 Jacksonville Usa 10 Singapore Singapore
19 Shekou China 21 Los Angeles Usa 10 Vancouver Canada
19 Tauranga New Zealand 21 Algeciras Spain 10 Vladicostok Russia
19 Yokohama Japan 21 Antwerp Belgium 10 Vostochnly Russia
27 Brisbane Australia 21 Boston Usa 10 Yantian China
27 Chittagong Bangladesh 21 Bremerhaven Germany
27 Colombo Srilanka 21 Le Havre France
27 Davao Philippines 21 Manzanillo Panama
표 14 중국 미국 한국의 개별 해상네트워크 매개중심성 기준, , ( )
중국 개별 해상네트워크 미국 개별 해상네트워크 한국 개별 해상네트워크
순위 항만 국가 순위 항만 국가 순위 항만 국가
1 Hongkong China 1 Busan Korea 1 Busan Korea
2 Shanghai China 2 Newark Usa 2 Shanghai China
3 Ningbo China 3 Long Beach Usa 3 Xingang China
4 Yantian China 4 Miami Usa 4 Kwangyang Korea
5 Nansha China 5 Savannah Usa 5 Daesan Korea
6 Qingdao China 6 Yokohama Japan - - -
7 Xiamen China 7 Charleston Usa - - -
8 Chiwan China 8 Philadelphia Usa - - -
9 Tanjung Pelepas Malaysia 9 New Orleans Usa - - -
10 Xingang China 10 Oakland Usa - - -
11 Busan Korea 11 Houston Usa - - -
12 Singapore Singapore 12 Port Everglades Usa - - -
13 Fuzhou China 13 Norfolk Usa - - -
14 Kwangyang Korea 14 Dutch Harbour Usa - - -
15 Kaohsiung Taiwan 15 Seattle Usa - - -
- - - 16 Wilmington Usa - - -
- - - 17 Altamira Mexico - - -
- - - 18 Jacksonville Usa - - -
- - - 19 Freeport Bahamas - - -
- - - 20 Mobile Usa - - -
- - - 21 Baltimore Usa - - -
- - - 22 Los Angeles Usa - - -
- - - 23 Puerto Cortes Honduras - - -
강동준(2015), “세계 주요지역 항만의 네트워크 특성이 성과에 미치는 영향에 관한 연구”, 『한국항만경제학회지』, 제 집 제 호31 4 , 189-207
김성국(2013), “SNA를 이용한 우리나라 연안여객항로의 네트워크 분석에 관한 연구”, 『해양비즈니스』, 24 , 1-24.제 호 김재경(2009), “사회 네트워크 분석을 이용한 충성고객과 이탈
고객의 구매 특성 비교 연구”, 『경영과학』, 26 , 제 권 제 호1 , 183-196.
까오티에린 고현정・ (2015), “21세기 해상 실크로드 중국 취안 저우 항만 활성화에 관한 연구”, 『로지스틱스연구』, 제 권 제 호23 4 , 89-100.
박용안(2012), “광양항 해운과 내륙 네트워크 발달에 대한 고찰”, 한국항만경제학회지 , 28 , 3 , 215-234.제 집 제 호
『 』
박지문 김성국 김한호․ ․ (2015), “사회연결망을 이용한 굴 무역 네트워크에 관한 연구”, 『무역학회지』, 제 권 제40 2 호, 51-70.
변장섭(2016), “산업연관표를 이용한 해운물류업의 산업간 연계 구조”, 『해운물류연구』, 91 , 435-455.제 권
심용주 조진희 권정주 황희연․ ․ ․ (2012), “사회 네트워크 분석기 법에 의한 연담화 지역 공간범위 분석 - 전라북도를 중심으로”, 『국토지리학회지』, 46 , 2 , 95-105.제 권 제 호 임병학(2011), “컨테이너항만 네트워크가 항만 생산성에 미치는
영향에 대한 연구 사회 네트워크 분석을 중심으로: ”, 로지스틱스연구 , 19 , 5 , 19-35.제 권 제 호
『 』
임병학 전희주・ (2011), “항만의 사회 네트워크가 물동량에 미치 는 영향에 대한 연구 항만간 협력지수를 중심으로: ”,
경영경제연구 제 권 제 호
POSRI , 11 , 3 , 289-307.
『 』
장준청 이자연 우수한・ ・ (2015), “중국 컨테이너 항만의 집중화 와 대응에 관한 연구”, 『한국항만경제학회지』, 31제 집 제 호, 4 , 169-187.
최성구 김주혜 권오경․ ․ (2014), “세계 주요 공항의 효율성과 영 향력 측정에 관한 연구: DEA와 사회 네트워크 분석을 이용하여“, 『한국로지스틱스학회』, 22 , 1 , 29-42.제 권 제 호 한철환(2002), “동북아 항만들의 경쟁전략에 관한 연구”, 『해
운연구 이론과 실천: 』, 34-67.
허명회(2012), 『사회네트워크분석 입문』, 자유아카데미 현기순 이준엽․ (2014), “중국의 성( )省간 경제교류에 대한 연구:
사회 네트워크 분석 기법을 이용하여”, 『국제지역학 회』, 18 , 4 , 189-214.제 권 제 호
홍진영 이준엽․ (2012), “글로벌 생산 네트워크에서의 중국의 위 상에 관한 연구 휴대폰 및 자동차산업을 중심으로: ”,
현대중국학회 , 14제 권 제 호1 , 193-230.
『 』
Acosta, M., Coronado, D. and Cerban, M., D.(2011),
“Bunkering competition and competitiveness at the ports of the Gibraltar Strait,”
Journal of Transport Geography
, Vol. 19, No. 4, 911-916.Brass, D. J.(1984), “Being in the right place: A structural analysis of individual influence in an organization,”
Administrative Science Quarterly
, Vol. 29, 519-539.Cabral, A., M., R. and Ramos, F., S.(2014), Cluster analysis
of the competitiveness of container ports in Brazil,
Transportation Research Part A: Policy and Practice
, Vol. 69, 423-431.Ducruet, C. and Notteboom, T. E.(2012), “The Worldwide maritime network of container shipping: Spatial structure and regional dynamics,”
Global networks
, Vol. 12, No. 3, 395-423.Fremont, A., “Global maritime networks: The case of Maersk,”
Journal of Transport Geography
, Vol.15, No.6, 2007, 431 442.–Leung, Xi Yu, Wang Fang, Wu Bihu, Bai Billy, Stahura Kurt A, Xie Zhihua(2012), “A Social network analysis of overseas tourist movement patterns in Beijing: the impact of the Olympic games,”
International Journal of Tourism Research
, Vol. 14, pp. 469-484.Ma, X., Y.(2010), “Nanjing Port Container Transport Competitive Power Analysis Based on AHP,”
Containerization
,Vol. 21, No. 3, 7-9.Marsden, P., V. and Friedkin, N., E. (1993), “Network Studies of Social Influence,”
Sociological Methods &
Research
, Vol. 22, 127 151.–Tongzon, J., “Efficiency measurement of selected Australian and other international ports using data envelopment analysis”,
Transportation Research Part A
, Vol. 35, 107-122.Tovar, B., Hern ndez, R. and H ctor, R., D.(2015), á é
“Container port competitiveness and connectivity:
The Canary Islands main ports case,”
Transport Policy
, Vol. 38, 40-51.Valentine, V. C. and Gray, R.(2002), “Competition of Hub Ports: A Comparison between Europe and the Far East,”
Korean Association of Shipping Studies
, Vol. 35, 197-213.Wang, T. F., Cullinane, K. and Song, D. W.(2003),
“Container port production efficiency: A Comparative Study of DEA and FDH approaches”,
Journal of the Eastern Asia Society for Transportation Studies
, Vol. 5, 698-713.Wu, Y., C., J. and Goh, M.(2010), “Container port efficiency in emerging and more advanced markets”,
Transportation Research Part E
, Vol. 46, 1030-1042.Yuen, C., A., Zhang, A., M. and Cheung, W., M.(2012),
“Port competitiveness from the users' perspective:
An analysis of major container ports in China and its neighboring countries,”
Research in Transportation Economics
, Vol. 35, No. 1, 34-40.Zhang, P.(2014), “Research on the evaluation of competitive- ness of Tianjin Port Container Terminal,” Dalian Maritime University.
국제 해상운송 네트워크 분석에 대한 연구
선사의 운송네트워크를 중심으로
송민근 차영두 여기태 , ,
국문요약
본 연구는 세계 최대 선사인 머스크의 글로벌 해상운송에 대하여 전 세계 102개 국가에 위치한 개
281 항만을 통해 총 6,318개 경로에 대한 네트워크를 구성하고, 사회네트워크분석을 이용해 항만 및 국가별 특성을 분석했다. 중국 정부는 적극적인 항만 개발과 동시에 세계 거점항만과의 협력 확대를 추진하고 있으며, 일대일로 사업을 통해 해상운송에서 중국이 차지하는 비중과 영 향력을 확대하고 있다. 중국의 항만 개발은 수출입 및 원자재 수급에 대한 안정적이고 독립적 물류 네트워크 구축의 의미를 포함하고 있으며, 해상 경로개발은 개별항만의 경쟁력 뿐 아니라 세계 해운시장에서 가장 큰 비중 및 영향력을 갖고 있는 미국 등 강대국과 이를 둘러싸고 있는 주요 국가의 관계구조와도 매우 밀접한 연관성을 갖고 있다. 이러한 관점에서 해상운송에 관한 연구는 개별항만과 함께 국가별 특성에 대한 분석이 병행되어야할 필요가 있다. 본 연구는 항만들 간의 관 계적 측면에서 특징을 파악했고, 이를 국가 단위로 적용했으며, 중국과 미국, 한국의 개별 네트 워크를 비교하여 중국 해상경로의 특징과 연구에 대한 시사점을 모색했다. 분석의 주요 결과로 머스크 해상네트워크에서 중국, 미국과 파나마, 말레이시아, 스페인 등의 비중이 높았으나, 중국 개별 네트워크에서는 중국, 한국과 대만, 베트남 등의 비중이 높게 나타났다. 또한, 부산항과 광 양항 등 한국항만이 중국 네트워크에서 큰 경쟁력을 확보하고 있는 것을 확인할 수 있었다.