Environmental Science
Vol. 31, No. 3, pp. 202-206, August, 2015 http://dx.doi.org/10.7747/JFES.2015.31.3.202
Estimation of Site Index for Larix kaempferi and Pinus koraiensis in Gangwon and North
Gyeongsang Provinces
Daesung Lee1, Yeongwan Seo2, Gildong Park1 and Jungkee Choi1,*
1Department of Forest Management, College of Forest and Environmental Sciences, Kangwon National University, Chuncheon 24341, Republic of Korea
2Institute of Forest Science, Kangwon National University, Chuncheon 24341, Republic of Korea
Abstract
Site index curves were developed for Larix kaempferi and Pinus koraiensis in Gangwon and North Gyeongsang provinces in Korea. For the development of site index, Schumacher and Chapman-Richards model were applied using the data collected from 2012 to 2014. Base age was set to 40 years for Larix kaempferi and Pinus koraiensis in site index of this study. Coefficient of determination and root mean square error of site index models were provided by species, and the models were compared with the previous studies to check the suitability. Overall, site index models developed in this study fitted in the current data well. Thus, the site indexes are considered to be properly used in Gangwon and North Gyeongsang provinces.
Key Words: Schumacher model, Chapman-Richards model, Base age, Dominant tree height
Received: August 6, 2015. Revised: August 13, 2015. Accepted: August 13, 2015.
Corresponding author: Jungkee Choi
Department of Forest Management, College of Forest and Environmental Sciences, Kangwon National University, Chuncheon 24341, Republic of Korea
Introduction
Larix kaempferi and Pinus koraiensis have been widely planted in Korea. In 2013, L. kaempferi was planted in 521 ha and P. koraiensis in 1,254 ha (Korea Forest Service 2014).
At present L. kaempferi, and P. koraiensis are the main com- mercial tree species for wood production in South Korea.
To identify the productive potential of forest for wood production, site quality should be assessed (Burkhart and Tome 2012). Site quality represents the potential pro- ductivity of a forest, and it is influenced by various factors such as climate and soil. To present an index in general, dominant tree height is expressed with fixed age, and it is termed site index. Site index is used as an information of growth and yield prediction.
Site index curves have been developed over the world, and the best fit site index has been utilized in many devel- oped countries (Palahi et al. 2004; Dieguez-Aranda et al.
2005; Nord-Larsen 2006; Weiskittel et al. 2009). In Korea, site index curve has also been studied for the major species (Chung 1993; Seo et al. 2001; Lee 2003; Son and Lee 2003;
Jeon et al. 2007; Pyo et al. 2009).
Various models were tried to explain the site index clearly.
Especially, Schumacher model and Chapman-Richards model have been widely used as the best model in Korea (Chung 1993; Seo et al. 2001; Lee 2003; Son and Lee 2003;
Jeon et al. 2007). At present, site index table and graph for main species are provided by Korea Forest Research Institute (KFRI) using Schumacher model and Chapman- Richards model (KFRI 2012).
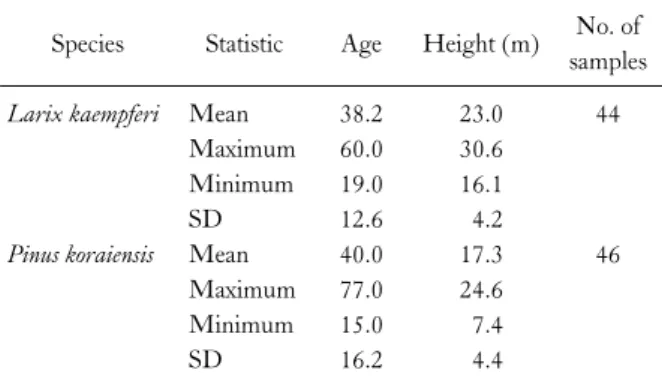
Table 1. Summary statistics of sample trees for developing site index Species Statistic Age Height (m) No. of
samples Larix kaempferi
Pinus koraiensis Mean Maximum Minimum SD Mean Maximum Minimum SD
38.2 60.0 19.0 12.6 40.0 77.0 15.0 16.2
23.0 30.6 16.1 4.2 17.3 24.6 7.4 4.4
44
46 In the previous studies, however, base age is 20 or 30 for main species (Chung 1993; Son and Lee 2003; KFRI 2012). Site index made by base age 20 or 30 can be unstable because the height growth of most species is vigorous at age 20 or 30 (Son and Lee 2003). Also, site index table of KFRI (2012) was also developed with base age 30.
Moreover, site index was calculated using a single site index table by species without regional classification.
Therefore, the objectives of this study are to develop site index of L. kaempferi and P. koraiensis in Gangwon and North Gyeongsang provinces and to compare site index of this study with those of previous studies.
Materials and Methods
Data collection
For this study, L. kaempferi and P. koraiensis stands were chosen in Gangwon and North Gyeongsang provinces.
Total number of sites is 90 sites: 44 sites for L. kaempferi and 46 sites for P. koraiensis. In order to develop site index model, sample trees were collected in each site from 2012 to 2014. One dominant tree, neither suppressed nor diseased, was selected and cut down as a sample tree in each site.
The statistics of age, height, and number of trees for each species were shown in Table 1. The age of trees ranged 19 to 60 for L. kaempferi and 15 to 77 for P. koraiensis. Tree height ranged 16.1 to 30.6 m for L. kaempferi and 7.4 to 24.6 m for P. koraiensis.
Model development
Height equations used for predicting site index in this study were Schumacher and Chapman-Richards model.
First of all, Schumacher model has been widely used as log- arithm form as follows:
ln(H)=a+bA-1··· (1)
Where H=dominant tree height (m), A=tree age (year), and a, b=parameter.
Calculated parameter b above equation is used as a co- efficient of guide curve for site index model. Dominant height equals to site index if A=A0, and then Equation (1) can be transformed as follows:
ln(S)=a+bA0-1··· (2)
Where A0=base age (year), S=site index.
After rearrangement of equation (1) and (2), site index model of Schumacher is derived as follows:
ln(H)=ln(S)+b(A-1-A0-1) ··· (3)
Final site index equation of Schumacher can be ex- pressed by exponential form as follows:
H=exp[ln(S)+b(A-1-A0-1)] ··· (4)
The other height equation used for predicting site index is Chapman-Richards model, and basic equation is as fol- lows:
H=a(1-e-bA)c··· (5)
Where H=dominant tree height (m), A=tree age (year), a, b, c=parameter, e=base of natural logarithm.
Calculated parameter b and c above equation is used as coefficients of guide curve for site index model. Dominant height equals to site index if A=A0, and then Equation (5) can be transformed as follows:
S=a(1-e-bA0)c··· (6)
Table 3. Site index models for Larix kaempferi and Pinus koraiensis
Species Model type Equations
Larix kaempferi Pinus koraiensis Larix kaempferi
Pinus koraiensis
Schumacher
Chapman-Richards
H=exp[ln(S)-14.3876(A-1-40-1)]
H=exp[ln(S)-21.5031(A-1-40-1)]
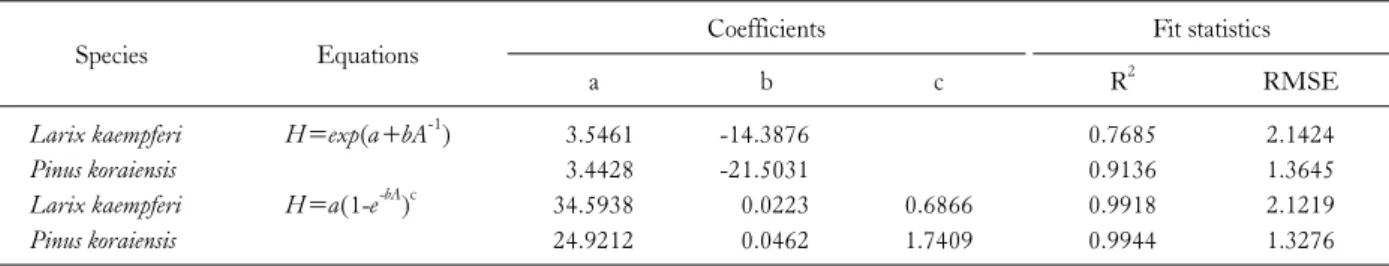
Table 2. Coefficients and fit statistics of Schumacher and Chapman-Richards height equation for site index model of Larix kaempferi and Pinus koraiensis
Species Equations Coefficients Fit statistics
a b c R2 RMSE
Larix kaempferi Pinus koraiensis Larix kaempferi Pinus koraiensis
H=exp(a+bA-1) H=a(1-e-bA)c
3.5461 3.4428 34.5938 24.9212
-14.3876 -21.5031 0.0223 0.0462
0.6866 1.7409
0.7685 0.9136 0.9918 0.9944
2.1424 1.3645 2.1219 1.3276 Note: H is dominant tree height (m); A is tree age (year); a, b, c is parameter; e is base of natural logarithm; R2 is coefficient of determination;
RMSE is root mean square error.
Where A0=base age (year), S=site index.
From the equation (5) and (6), site index model of Chapman-Richards is derived as follows:
··· (7)
Finally, site index model of Chapman-Richards can be rearranged from equation (7) as follows:
··· (8) For predicting the parameters of each model, the PROC REG for Schumacher model and the PROC NLIN for Chapman-Richards model were used in SAS 9.4 software (SAS Institute Inc. 2013).Results and Discussion
Model development
Site index models of Schumacher and Chapman-Richards
were developed using the tree information of age and height, and the number of data used for model was 44 trees for L.
kaempferi and 46 trees for P. koraiensis. Coefficients of Schumacher and Chapman-Richards model were derived from Equation 1 and 5, respectively.
As a result of using PROC REG procedure for Schumacher and PROC NLIN procedure for Chapman-Richards in SAS 9.4 software, coefficients for each species were shown in Table 2. Coefficient of determination (R2) and root mean square error (RMSE) were also provided for the fit statistics.
Estimated parameter b of Equation 1 was used for site index curve of Schumacher model in Equation 4. Also, pa- rameter b and c of Equation 5 were used for site index curve of Chapman-Richards model in Equation 8. Finally, Site index models by species were provided in Table 3.
Dominant tree height was calculated by site index and age. In both Schumacher and Chapman-Richards model of this study, base age was 40 years for L. kaempferi and P. kor- aiensis in this study, considering average age of each species.
Fig. 1. Site index models using Schumacher and Chapman-Richards equations for Larix kaempferi and Pinus koraiensis.
Model validation
When fit statistics were compared between species, site index models of P. koraiensis were highest in R2 (0.91-0.99) and lowest in RMSE (1.33-1.36). To compare the site in- dex models by species, site index curves were displayed by models and species (Fig. 1). In the graphs of site index curves, the site index pattern of a species was similar be- tween models. Also, the difference of RMSE between models in a species was small: 0.0205 for L. kaempferi and 0.0369 for P. koraiensis. Therefore, considering RMSE and site index curves, both models are expected to be used for calculating site index.
Model comparison
Site index curves of the previous studies developed by ei- ther Schumacher or Chapman-Richards model were com- pared by species. First of all, site index of L. kaempferi was compared with the previous studies. The tree data of this study were fitted well in site index curves of the previous studies (Son and Lee 2003; KFRI 2012).
In addition, site index of P. koraiensis was compared with the previous studies. When the tree data of this study were plotted on the site index curve of the previous studies, some data were not included within the site index curve and it was difficult to evaluate the site index of the some data (Chung 1993; KFRI 2012). Thus, developing new site index mod- els is needed for P. koraiensis.
Conclusion
This study was performed to develop the site index in Gangwon and North Gyeongsang provinces. Schumacher and Chapman-Richards model were used for the develop- ing site index. Base age was 40 years for L. kaempferi and P.
koraiensis in site index of this study.
In the fit statistics of both site index models, RMSE of P.
koraiensis was lowest. Considering RMSE and site index curves, both Schumacher and Chapman-Richards model are expected to be used for calculating site index. When compared with previous studies, the site index of this study was considered to be suitable and practicable.
Overall, site index models of this study are highly ex- pected to be used for L. kaempferi and P. koraiensis in Gangwon and North Gyeongsang provinces.
Acknowledgement
This study was carried out with the support of
‘Long-term Monitoring Research for Major Species on Climate Change’ funded by Northern, Eastern, and Southern Regional Office of Korea Forest Service in 2012, 2013, and 2014.
References
Burkhart HE, Tomé M. 2012. Modeling Forest Trees and Stands.
Springer, New York, NY, pp 457.
Chung YG. 1993. Studies on estimation of site index for Korean white pine (Pinus koraiensis S. et Z.) plantations in central region of Korea. PhD thesis. Konkuk University, Seoul, Korea. (in Korean)
Diéguez-Aranda U, Burkhart HE, Rodríguez-Soalleiroc R. 2005.
Modeling dominant height growth of radiate pine (Pinus radiata D. Don) plantation in north-western Spain. For Ecol Manage 215: 271-284.
Jeon BH, Lee SH, Lee YJ, Kim H, Kang HM. 2007. Estimation of site index and stem volume equations for Larix leptolepis stand in Jinan, Chonbuk. J Korean For Soc 96: 40-47. (in Korean with
English abstract)
Korea Forest Service. 2014. Statistical Yearbook of Forestry. pp 496. (in Korean)
Korea Forest Research Institute. 2012. Stem Volume, Biomass, Yield Table. pp 261. (in Korean)
Lee SH. 2003. Development of site index equation and curves for Cryptomeria japonica. J Korean For Soc 92: 152-159. (in Korean with English abstract)
Nord-Larsen T. 2006. Developing dynamic site index curves for European beech (Fagus sylvatica L.) in Denmark. Forest Sci 52:
173-181.
Pyo JK. 2009. Estimation of site index and compatible taper equa- tions for Pinus densiflora Grown Mt. Osu region, Chungnam.
M.S. thesis at Graduate School of Kongju University. pp 72. (in Korean with English abstract)
Palahi M, Tome M, Pukkala T, Trasobares A, Montero G. 2004.
Site index model for Pinus sylvestris in north-east Spain. For Ecol Manage 187: 35-47.
Seo JH, Lee WK, Son YW, Ham BY. 2001. Dynamic growth model for Pinus densiflora stands in Anmyun-Island. J Korean For Soc 90: 725-733. (in Korean with English abstract) Son YM, Lee KH. 2003. Site index equations using Schumacher
model and Chapman Richards model for Pinus densiflora and Larix kaempferi stands. Kor J For Meas 6: 1-7. (in Korean with English abstract)
SAS Institute Inc. 2013. SAS/STAT 9.4 User’s Guide. SAS Institute Inc., Cary, NC, USA.
Weiskittel AR, Hann DW, Hibbs DE, Lam TY, Bluhm AA. 2009.
Modeling top height of red alder plantations. For Ecol Manage 258: 323-331.