The Risk of Abdominal Obesity according to the Degree of Non- Alcoholic Fatty Liver Disease in Korean Men
Although non-alcoholic fatty liver disease has been reported as a cardiometabolic risk factor, the effect of non-alcoholic fatty liver is yet to be clarified on abdominal obesity.
Therefore, this study was conducted to investigate the longitudinal relationship of non- alcoholic fatty liver on the development of abdominal obesity. The study participants were composed of 11,212 Korean men without abdominal obesity. They were followed up from 2005 to 2010 to be monitored for the development of abdominal obesity according to their degree of non-alcoholic fatty liver disease (normal, mild, and moderate to severe).
Cox-proportional hazard model was used to calculate the hazard ratios for abdominal obesity according to the degree of non-alcoholic fatty liver disease. While the average incidence was 15.5%, the incidence of abdominal obesity increased according to the degree of non-alcoholic fatty liver (normal: 11.6%, mild: 25.2%, moderate to severe:
41.0%, P < 0.001). Multivariable-adjusted hazard ratios for abdominal obesity independently increased proportionally to the degree of NAFLD (mild [1.07; 0.94-1.23], moderate to severe [1.58; 1.11-2.26], P for trend < 0.001). The risk of abdominal obesity increased proportionally to the degree of non-alcoholic fatty liver disease. This finding guarantees further studies to reveal the incidental relationship of abdominal obesity with non-alcoholic fatty liver disease.
Keywords: Non-Alcoholic Fatty Liver Disease; Obesity, Abdominal; Waist Circumference Sung Keun Park,1,2 Jae-Hong Ryoo,2
Joong-Myung Choi,2 Min Woo Seo,2 and Chung Min Park2
1Total Healthcare Center, Kangbuk Samsung Hospital, Sungkyunkwan University, School of Medicine, Seoul, Korea; 2Departments of Preventive Medicine, School of Medicine, Kyung Hee University, Seoul, Korea
Received: 10 June 2015 Accepted: 13 November 2015 Address for Correspondence:
Joong-Myung Choi, MD
Department of Preventive Medicine, Kyung Hee University School of Medicine, 26 Kyungheedae-ro, Dongdaemun-gu, Seoul 02447, Korea
E-mail: [email protected]
http://dx.doi.org/10.3346/jkms.2016.31.3.410 • J Korean Med Sci 2016; 31: 410-416
INTRODUCTION
Obesity is a significant medical issue threatening public health not only in Western countries but also in Asian countries. As of 2008, more than 10% of the world population, about 500 mil- lion adults, was obese (1), which was expected to explosively increase in the future (2). Especially, abdominal obesity has more serious clinical implication. It has been reported that ab- dominal obesity was more significant risk factors for various diseases such as diabetes, cardiovascular disease and metabol- ic syndrome than general obesity (3-5). In addition, medical problems related to abdominal obesity are rapidly raising med- ical cost, which is burdening social financial stability (6). Ac- cordingly, these situations are increasing the necessity for aca- demic activity or business to prevent abdominal obesity.
Non-alcoholic fatty liver disease (NAFLD) is the most preva- lent chronic liver disease characterized as the fatty liver infiltra- tion and damaged hepatocyte (7,8). Since a lot of researches have been actually performed to investigate the association be- tween NAFLD and abdominal obesity, deep clinical and me- chanical relationships were revealed between 2 factors. How- ever, most of studies have mainly focused on the effect of abdo- minal obesity for NAFLD, and studies for the reverse relation- ship were very rare. Nonetheless, considering the significant
function of liver in processing biochemical reaction of major metabolic factors such as fat, glucose, and insulin, it is worthy to research into the effect of NAFLD on the development of ab- dominal obesity. Thus, we conducted this study to investigate the risk of abdominal obesity according to the degree of NAFLD.
MATERIALS AND METHODS Study design
A prospective cohort study was conducted in order to investi- gate the association between NAFLD and the development of abdominal obesity. Study population consisted of Korean men undergoing a medical health check-up program annually or bi- ennially at Total Healthcare Center of Kangbuk Samsung Hos- pital, Sungkyunkwan University, Seoul, Korea. The background and the purpose of medical health check up program was de- scribed in our previous journal in detail (9).
Study population
The study participants were the total of 28,425 men who had examined the waist circumference (WC) for medical check-up in 2005 participated in this study. Among the 28,425 participants, 12,498 were excluded for various reasons: 1,340 had a positive serologic marker for hepatitis B surface antigen (HBsAg); 53 had
a positive serologic marker for hepatitis C virus antibody (HCV- Ab); 308 had abnormal ultrasonographical findings of chronic liver disease, liver cirrhosis, and/or current or past history of clonorchiasis; 149 had a past history of a malignancy; 226 had a past history of cardiovascular disease; 2,107 were receiving med- ication for lipid-lowering agents; 4,479 had an alcohol intake of
≥ 20 g/day; 2,002 had elevated γ-glutamyltransferase (GGT) levels (> 100 U/L); 375 had elevated alanine aminotransferase (ALT) levels (> 100 U/L) and 6,245 were diagnosed as baseline abdominal obesity (WC > 90 cm) at initial examinations. The total number of eligible participants was 15,927. We further ex- cluded 4,715 participants who did not attend any follow-up visit between 2006 and 2010. Without the follow-up visit, we could not identify the development of abdominal obesity and also cal- culate the individual person year. Eventually, 11,212 participants were enrolled in the final analysis and observed for the develop- ment of obesity (Fig. 1). The total follow-up period was 39,399.1 person year and average follow-up period was 3.51 (standard deviation [SD], 1.53) person year.
Clinical and laboratory measurements
Study data included a medical history, a physical examination, information provided by a questionnaire, anthropometric mea- surements and laboratory measurements. The medical and drug prescription history were assessed by the examining physicians.
All the participants were asked to respond to a health-related behavior questionnaire, which included the topics of alcohol consumption, smoking and exercise. The questions about alco- hol intake included the frequency of alcohol consumption on a weekly basis and the typical amount that was consumed on a
daily basis (≥ 20 g/day). In addition, the participants were asked about their weekly frequency, amount and duration of exercise to evaluate status of their physical activity. Participants taking exercise such as jogging, bicycling, and swimming that lasted long enough to produce perspiration (≥ 1 time/week) were re- garded as people with regular exercise.
Anthropometric measurements and procedures for blood tests including biochemical analysis, lipid profiles, and immu- noradiometric assay were described in detail elsewhere (9).
The diagnosis of chronic liver disease, fatty liver and its de- gree were based on the results of abdominal US with a 3.5-MHz transducer (Logic Q700 MR, GE, Milwaukee, USA). Abdominal US were carried out by eleven experienced radiologists who were unaware of the aims of the study and blind to the laboratory values.
The criteria of chronic liver disease are as follows (10,11):
Findings meet one of following criteria.
1) Coarse or highly non-homogenous liver parenchymal echo- texture
2) Irregular or nodular liver surface (inferior margin of right lobe)
3) Blunted or rounded liver edge
4) Enlarged liver size (> 15 cm in mid-clavicular line) or Shrin- ken liver size (< 10 cm in mid-clavicular line)
5) Enlarged spleen size (> 13 cm)
The degree of hepatic fatty infiltration was evaluated by quan- titative grading system conventionally used in radiologic field (12-14) as follows:
Normal (grade 0): Hepatic parenchymal echogenicity is usu- ally equal to that of the renal cortex.
Mild fatty liver (grade 1): diffuse slight increase in fine echoes in the hepatic parenchyma with normal visualization of the dia- phragm and intrahepatic vessel borders.
Moderate fatty liver (grade 2): moderate diffuse increase in fine echoes with slightly impaired visualization of the intrahe- patic vessels and diaphragm.
Severe fatty liver (grade 3): marked increase in fine echoes with poor or no visualization of the intrahepatic vessel borders, diaphragm and posterior portion of the right lobe of the liver.
The WC was measured in the standing position, at the level of umbilicus by a single examiner, and WC > 90 cm was defined as abdominal obesity according to the recommendation sug- gested by joint interim statement of the International Diabetes Federation Task Force on Epidemiology and Prevention (15).
Statistical analyses
Data were expressed as means ± (standard deviation) or medi- ans (interquartile range) for continuous variables and percent- ages of the number for categorical variables.
The one-way ANOVA and χ2-test were used to analyze the sta- tistical differences among the characteristics of the study par- Fig. 1. Flow chart of enrolled study participants.
Initial participants screened in 2005 (n = 28,425)
Initial cohort in 2005 (n = 15,927)
Final sample size (n = 11,212)
Follow-up loss between 2006 and 2010 (n = 4,715) Exclusion Criteria in 2005 (n = 12,498) Baseline abdominal obesity (n = 6,245) Medication for lipid lowering agent (n = 2,107) Past history of malignancy (n = 149) Alcohol intake ≥ 20 g/week (n = 4,479) γ-glutamyltransferase > 100 (n = 2,022) Alanine aminotransferase > 100 (n = 375) HBV + HCVserologic marker positive (n = 1,393)
Chronic liver disease (n = 308)
Past history of cardiovascular disease (n = 226) Ischemic heart disease (n = 112) Cerebrovascular disease (n = 58) Valvular heart disease (n = 41) Peripheral vascular disease (n = 15)
ticipants at the time of enrollment in relation to the NAFLD cat- egories. Categories of the NAFLD comprised the following: nor- mal, mild, moderate and severe. Moderate (N = 133, 1.19%) and severe NAFLD (N = 1, 0.01%) was combined into moderate to severe NAFLD category for analyses, owing to the small num- ber of severe NAFLD. The distributions of continuous variables were evaluated, and log transformations were used in the anal- ysis as required.
For incident abdominal obesity cases, the time of abdominal obesity occurrence was assumed to be the midpoint between the visit at which abdominal obesity was first diagnosed and the baseline visit (2005). The person years were calculated as the sum of follow-up times from the baseline until an assumed time of abdominal obesity development or until the final ex- amination of each individual. We used Cox proportional haz- ards models to estimate adjusted hazard ratios (HRs) and 95%
confidence intervals (CI) for incident abdominal obesity com- paring the mild and moderate to severe NAFLD categories vs.
the normal group. The data were adjusted, first for age alone, then for the multiple covariates. In the multivariate models, we included variables that might confound the relationship between the NAFLD and abdominal obesity, which include: age, base- line WC, total cholesterol, log(hsCRP), HOMA-IR, eGFR, cur-
rent smoking status, regular exercise, hypertension and diabe- tes mellitus. The change level of WC was calculated by follow- ing formula: WC on censoring time – baseline WC. The average change of WC was compared among 3 groups (normal, mild and moderate to severe NAFLD groups) by one-way ANOVA and χ2-test. P values < 0.05 were considered to be statistically significant. Statistical analyses were performed PASW Statistics 18 (SPSS Inc., Chicago, IL, USA).
Ethics statement
Ethics approvals for the study protocol and analysis of the data were obtained from the institutional review board of Kangbuk Samsung Hospital (KBC12060). The informed consent require- ment was exempted from the institutional review board because the researchers only retrospectively accessed a de-identified da- tabase for analytical purposes.
RESULTS
During 39,399.1 person-years of follow-up, 1,740 (15.5%) inci- dent cases of abdominal obesity developed between 2006 and 2010. While 11,212 enrolled study participants were comprised of 8,160 normal group (72.7%), 2,918 mild fatty liver group (26.0%) Table 1. Baseline characteristics of participants according to the categories of non-alcoholic fatty liver disease (n = 11,212)
Characteristics
NAFLD
Overall Normal
(n = 8,160) Mild
(n = 2,918) Moderate to severe
(n = 134) P for trend
Person-yr (total) 39,399.1 29,347.4 9,641.1 410.6
Person-yr (average) 3.51 ± (1.53) 3.60 ± (1.49) 3.30 ± (1.62) 3.06 ± (1.65) < 0.001
Age, yr 44.3 ± (7.7) 44.3 ± (7.8) 44.4 ± (7.4) 43.3 ± (6.8) 0.119
BMI, kg/m2 23.5 ± (2.2) 23.0 ± (2.1) 24.8 ± (1.8) 25.8 ± (2.0) < 0.001
WC, cm 81.1 ± (5.7) 79.9 ± (5.8) 84.2 ± (4.1) 86.3 ± (3.4) < 0.001
Systolic BP, mmHg 112.3 ± (13.9) 111.2 ± (13.6) 115.1 ± (14.2) 115.4 ± (13.5) < 0.001
Diastolic BP, mmHg 77.3 ± (9.4) 76.6 ± (9.2) 79.6 ± (9.3) 80.0 ± (9.6) < 0.001
Total cholesterol, mg/dL 192.1 ± (30.7) 188.7 ± (30.0) 201.1 ± (30.7) 204.6 ± (29.9) < 0.001
Triglyceride, mg/dL 115 (84-160) 104 (78-142) 150 (111-204) 172 (137-246) < 0.001
HDL-cholesterol, mg/dL 50.3 ± (10.8) 52.2 ± (10.6) 47.2 ± (8.3) 45.2 ± (7.3) < 0.001
LDL-cholesterol, mg/dL 113.0 ± (26.1) 110.2 ± (25.5) 120.2 ± (26.2) 122.2 ± (27.6) < 0.001
Fasting serum glucose, mg/dL 96.9 ± (14.8) 95.7 ± (13.3) 100.3 ± (17.8) 101.4 ± (17.0) < 0.001
HOMA-IR 1.84 (1.44-2.38) 1.69 (1.36-2.14) 2.27 (1.80-2.87) 2.78 (2.21-3.52) < 0.001
Insulin, uU/dL 8.3 ± (3.0) 7.7 ± (2.7) 9.8 ± (3.2) 11.8 ± (3.8) < 0.001
SCr, mg/dL 1.13 ± (0.16) 1.13 ± (0.18) 1.14 ± (0.10) 1.16 ± (0.14) 0.019
eGFR, mL/min per 1.73 m2 79.4 ± (9.9) 79.7 ± (9.9) 78.4 ± (9.8) 77.6 ± (9.5) 0.016
hsCRP, mg/L 0.05 (0.03-0.10) 0.04 (0.02-0.08) 0.07 (0.04-0.13) 0.11 (0.05-0.20) 0.013
AST, U/L 23 (19-26) 22 (19-25) 24 (21-29) 30 (25-37) < 0.001
ALT, U/L 23 (18-30) 21 (16-26) 30 (23-39) 46 (35-64) < 0.001
GGT, U/L 25 (18-38) 23 (16-34) 34 (24-47) 46 (30-62) < 0.001
Current smoker, % 35.9 35.2 37.7 36.6 0.024
Regular exercise, % 19.6 20.8 16.5 13.7 < 0.001
Diabetes mellitus, % 3.3 2.1 6.3 8.2 < 0.001
Hypertension, % 16.0 14.0 21.3 20.2 < 0.001
Development of obesity, % 15.5 11.6 25.2 41.0 < 0.001
Data are means (standard deviation), medians (interquartile range), or percentages. BMI, body mass index; WC, waist circumference; BP, blood pressure; HDL, high-density li- poprotein; LDL, low-density lipoprotein; HOMA-IR, homeostasis model assessment of insulin resistance; SCr, serum creatinine; eGFR, estimated glomerular filtration rate; hsCRP, high-sensitivity C-reactive protein; AST, aspartate aminotransferase; ALT, alanine aminotransferase; GGT, γ-glutamyltransferase.
Table 2. Comparison of baseline characteristics between participants with and with- out incident abdominal obesity
Characteristics Without incident abdominal obesity
(n = 9,472)
With incident abdominal obesity
(n = 1,740)
P value*
Age, yr 44.1 ± (7.6) 45.3 ± (7.8) < 0.001
BMI, kg/m2 23.1 ± (2.1) 25.8 ± (1.6) < 0.001
WC, cm 80.2 ± (5.6) 86.1 ± (3.2) < 0.001
Systolic BP, mmHg 111.6 ± (13.9) 116.0 ± (13.2) < 0.001 Diastolic BP, mmHg 76.9 ± (9.3) 80.2 ± (8.9) < 0.001 Total cholesterol, mg/dL 191.2 ± (30.6) 196.6 ± (30.5) < 0.001 Triglyceride, mg/dL 128.4 ± (69.5) 153.0 ± (79.3) < 0.001 HDL-cholesterol, mg/dL 51.3 ± (10.4) 48.1 ± (9.3) < 0.001 LDL-cholesterol, mg/dL 112.2 ± (25.9) 117.0 ± (26.2) < 0.001 Fasting serum glucose, mg/dL 96.6 ± (14.4) 98.8 ± (16.8) < 0.001
HOMA-IR 1.94 ± (0.79) 2.31 ± (0.91) < 0.001
Insulin, uU/dL 8.1 ± (2.9) 9.5 ± (2.3) < 0.001
SCr, mg/dL 1.13 ± (0.17) 1.14 ± (0.11) < 0.001
eGFR, mL/min per 1.73 m2 79.9 ± (9.9) 77.7 ± (9.6) < 0.001
hsCRP, mg/L 0.12 ± (0.33) 0.14 ± (0.38) 0.105
AST, U/L 23.4 ± (6.8) 24.2 ± (7.7) < 0.001
ALT, U/L 25.0 ± (12.0) 29.3 ± (14.6) < 0.001
GGT, U/L 29.5 ± (17.5) 35.9 ± (18.9) < 0.001
Current smoker, % 35.4 38.5 0.013
Proper exercise, % 18.8 23.9 < 0.001
Diabetes mellitus, % 3.2 3.7 0.220
Hypertension, % 14.7 23.1 < 0.001
Data are expressed as means (standard deviation) or percentages. *P value by t-test for continuous variables and χ2 test for categorical variables. BMI, body mass index;
WC, waist circumference; BP, blood pressure; HDL, high-density lipoprotein; LDL, low-density lipoprotein; HOMA-IR, homeostasis model assessment of insulin resis- tance; SCr, serum creatinine; eGFR, estimated glomerular filtration rate; hsCRP, high- sensitivity C-reactive protein; AST, aspartate aminotransferase; ALT, alanine amino- transferase; GGT, γ-glutamyltransferase.
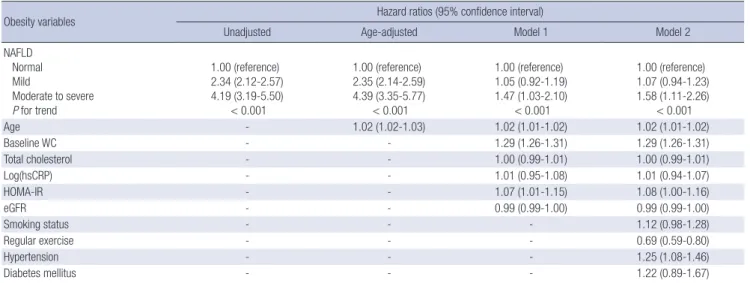
Table 3. Hazard ratios and 95% confidence intervals for the incidence of abdominal obesity according to categories of non-alcoholic fatty liver diseases
Obesity variables Hazard ratios (95% confidence interval)
Unadjusted Age-adjusted Model 1 Model 2
NAFLD Normal Mild
Moderate to severe P for trend
1.00 (reference) 2.34 (2.12-2.57) 4.19 (3.19-5.50)
< 0.001
1.00 (reference) 2.35 (2.14-2.59) 4.39 (3.35-5.77)
< 0.001
1.00 (reference) 1.05 (0.92-1.19) 1.47 (1.03-2.10)
< 0.001
1.00 (reference) 1.07 (0.94-1.23) 1.58 (1.11-2.26)
< 0.001
Age - 1.02 (1.02-1.03) 1.02 (1.01-1.02) 1.02 (1.01-1.02)
Baseline WC - - 1.29 (1.26-1.31) 1.29 (1.26-1.31)
Total cholesterol - - 1.00 (0.99-1.01) 1.00 (0.99-1.01)
Log(hsCRP) - - 1.01 (0.95-1.08) 1.01 (0.94-1.07)
HOMA-IR - - 1.07 (1.01-1.15) 1.08 (1.00-1.16)
eGFR - - 0.99 (0.99-1.00) 0.99 (0.99-1.00)
Smoking status - - - 1.12 (0.98-1.28)
Regular exercise - - - 0.69 (0.59-0.80)
Hypertension - - - 1.25 (1.08-1.46)
Diabetes mellitus - - - 1.22 (0.89-1.67)
Model 1 was adjusted for age, baseline WC, total cholesterol, log(hsCRP), HOMA-IR and eGFR. Model 2 was adjusted for model 1 plus recent smoking status, regular exercise, hypertension and diabetes mellitus. NAFLD, non- alcoholic fatty liver disease; WC, waist circumference; hsCRP, high-sensitivity C-reactive protein; HOMA-IR, homeostasis mod- el assessment of insulin resistance; eGFR, estimated glomerular filtration rate.
and 134 moderate to severe fatty liver group (1.1%), 4,715 exclud- ed people for follow-up loss were comprised of 3,473 normal group (73.7%), 1,194 mild fatty liver group (25.3%) and 48 mod-
erate to severe group (1.01%).
The baseline characteristics of the study participants in rela- tion to the NAFLD categories are presented in Table 1. At base- line, the mean (SD) age and WC of study participants were 44.3 (7.7) years and 81.1 (5.7) cm, respectively. There were clear dose response relationships between all of the listed variables and NAFLD categories except for age.
In contrast to participants without incident abdominal obe- sity, those with incident abdominal obesity were slightly older (45.3 vs. 44.1) and generally had less favorable metabolic pro- files at baseline (Table 2).
Table 3 shows the hazard ratios and 95% confidence interval for incident abdominal obesity according to the NAFLD catego- ries. In the unadjusted model, the hazard ratios and 95% confi- dence interval for incident abdominal obesity comparing mild to moderate and severe NAFLD to normal NAFLD were 2.34 (2.12-2.57) and 4.19 (3.19-5.50), respectively (P for trend < 0.001).
After adjustments for covariates in model 1 and 2, this associa- tion was attenuated in mild NAFLD group, but still maintained statistically significant (P for trend < 0.001). In Cox proportion- al hazards models adjusting for age, baseline WC, total choles- terol, log(hsCRP), HOMA-IR, eGFR, current smoking status, reg- ular exercise, hypertension and diabetes mellitus (model 2), the adjusted hazard ratios and 95% confidence interval for incident obesity were 1.07 (0.94-1.23) and 1.58 (1.11-2.26), respectively (P for trend < 0.001). Subgroup analysis by age (< 45 and ≥ 45 years) also showed the similar trend of association between the degree of NAFLD and the incidence of obesity (Supplementary Tables 1 and 2). The average and overall change level of WC dur- ing follow-up was evaluated for all study participants and peo- ple with incident obesity (Table 4). The average change level of WC increased in proportion to the degree of NAFLD in all study
participants and people with incident obesity.
DISCUSSION
Up to the present, there have been a lot of studies regarding caus- ative factors for NAFLD. Out of them, abdominal obesity was known to be one of the most significant factors. Nonetheless, there was scarce information about the effect of NAFLD on the development of abdominal obesity. In this study, incidence and risk of abdominal obesity increased proportionally to the degree of NAFLD, even after adjusting for multiple covariates. There- fore, these findings could be the significant clinical background for the previous studies demonstrating the higher prevalence of adult disease under NAFLD. In short, as NAFLD patients are vulnerable to abdominal obesity, risk for diseases related to ab- dominal obesity may also increase in NAFLD patients.
Comparing our study findings with those of previous studies, we could see an interesting fact. Mean baseline WC of every group, even if less than 90 cm, cut-off value of central obesity, was in proportion to the degree of NAFLD. Baseline mean value of HOMA-IR, indicator of insulin resistance, also increased with the same tendency of WC. These findings agree well with the previous reports showing metabolic factors associated with the development and progression of NAFLD (16-18). In addition, mean baseline metabolic factors associated with NAFLD were more unfavorable in more progressed NAFLD group. Therefore, it was undoubted that various deleterious metabolic conditions interactively contributed to the development of NAFLD. None- theless, to the best of our knowledge, there was no study show- ing that NAFLD induced by these factors increased the risk for abdominal obesity in proportion to the degree of NAFLD. Ac- cordingly, our study findings imply that NAFLD developed by some deleterious conditions can induce abdominal obesity thr- ough its independent action.
The mechanism of our study finding is not necessarily matched
up with that of previous studies, because there is no report cor- responding to ours. However, several theories could be suggest- ed. One of the most probable theories is elevated insulin level associated with insulin resistance. As well known, insulin resis- tance plays a core role in the development and progression of NAFLD, and hyperinsulinemia is a definite clinical manifesta- tion of insulin resistance. Previous studies showed that elevated insulin level could cause obesity. Johnson et al reported that hyperinsulinemia drove a diet-induced obesity independently of brain insulin production (19), and clinical studies showed that long term insulin therapy could induce weight gain (20,21).
Our study also showed that baseline insulin levels were elevat- ed in proportion to the severity of NAFLD. Accordingly, hyper- insulinemia associated with insulin resistance might play a sig- nificant role in the development of obesity.
When interpreting our results, some limitations should be considered. First, bias from follow-up loss may have affected our results. Participants not included in analysis (n = 4,715) were older and had less favorable metabolic profiles at baseline than those in analytic cohort. Thus, this follow-up loss of high-risk people would probably lead to a conservative bias and subse- quent underestimation of risk.
Second is the methodological limitation for the diagnosing NAFLD. In this study, the presence of NAFLD was assessed by US instead of pathologic method. Although US is regarded rea- sonable and accurate in detecting NAFLD, it cannot identify fat- ty infiltration of the liver below the threshold of 30% (22). There- fore, there might have been possibility of discrepancy between ultrasonographic finding and real NAFLD. Nonetheless, it was inappropriate to perform invasive test in a population based epidemiological study (23). Additionally, US is a widely used and acceptable modality for diagnosis of NAFLD with high sen- sitivity (82%-94%) and specificity (66%-95%) (24-26). Particu- larly, all examinations were carried out by experienced radiolo- gists using widely established methods and criteria. Thus, de- Table 4-1. Average change level of waist circumference (WC) in all study participants and people with incident obesity
Characteristic (all study participants)
NAFLD (11,212 all study participants) Overall
(n = 11,212) Normal
(n = 8,160) Mild
(n = 2,918) Moderate to severe
(N = 134) P for trend
Average change of WC, cm 3.08 ( ± 2.13) 3.04 ( ± 1.97) 3.18 ( ± 2.07) 3.46 ( ± 2.16) < 0.001
Range of WC change, cm -8.6 - +11.4 -8.6 - +9.6 -6.9 - +9.3 -7.4 - +11.4
WC (waist circumference) change was calculated by as follows: WC on censoring time – baseline WC. NAFLD, non-alcoholic fatty liver disease.
Table 4-2. Average change level of waist circumference (WC) in people with incident obesity
Characteristic (people with incident obesity)
NAFLD (1,740 people with incident obesity) Overall
(N = 1,740) Normal
(N = 947) Mild
(N = 737) Moderate to severe
(N = 56) P for trend
Average change of WC, cm 6.13 ( ± 3.04) 6.03 ( ± 2.99) 6.22 ( ± 3.15) 6.71 ( ± 3.11) < 0.001
Range of WC change, cm +3.8 - + 12.8 +4.2 - + 11.5 +4.1 - + 12.8 +3.8 - + 12.3
WC (waist circumference) change was calculated by as follows: WC on censoring time – baseline WC. NAFLD, non-alcoholic fatty liver disease.
spite this limitation, US might be clinically reasonable and prop- er modality to diagnose NAFLD in this study.
In conclusion, our study indicated that the risk of abdominal obesity independently increased according to the degree of NA- FLD. These findings suggest the clinical significance of NAFLD as an early predictor for abdominal obesity. Therefore, further studies should be conducted to clarify the more correct relation- ship between NAFLD and abdominal obesity.
DISCLOSURE
The authors have no potential conflicts of interest to disclose.
AUTHOR CONTRIBUTION
Conception and coordination of the study: Choi JM. Design of ethical issues: Choi JM. Acquisition of data: Park SK. Data re- view: Park SK, Choi JM. Statistical analysis: Park SK, Ryoo JH.
Manuscript preparation: Park SK, Choi JM, Seo MW, Park CM.
Manuscript approval: all authors.
ORCID
Sung Keun Park http://orcid.org/0000-0003-4703-9917 Jae-Hong Ryoo http://orcid.org/0000-0002-5232-1426 Joong-Myung Choi http://orcid.org/0000-0002-3610-6662 Min Woo Seo http://orcid.org/0000-0002-6574-8453 Chung Min Park http://orcid.org/0000-0003-0604-4672 REFERENCES
1. World Health Organization. Obesity and overweight. Available at http://
www.who.int/mediacentre/factsheets/fs311/en/index.html [accessed on 1 June 2014].
2. Kelly T, Yang W, Chen CS, Reynolds K, He J. Global burden of obesity in 2005 and projections to 2030. Int J Obes 2008; 32: 1431-7.
3. Coutinho T, Goel K, Corrêa de Sá D, Kragelund C, Kanaya AM, Zeller M, Park JS, Kober L, Torp-Pedersen C, Cottin Y, et al. Central obesity and sur- vival in subjects with coronary artery disease: a systematic review of the literature and collaborative analysis with individual subject data. J Am Coll Cardiol 2011; 57: 1877-86.
4. Anjana M, Sandeep S, Deepa R, Vimaleswaran KS, Farooq S, Mohan V.
Visceral and central abdominal fat and anthropometry in relation to dia- betes in Asian Indians. Diabetes Care 2004; 27: 2948-53.
5. Després JP, Lemieux I. Abdominal obesity and metabolic syndrome. Na- ture 2006; 444: 881-7.
6. Højgaard B, Olsen KR, Søgaard J, Sørensen TI, Gyrd-Hansen D. Economic costs of abdominal obesity. Obes Facts 2008; 1: 146-54.
7. Angulo P. Nonalcoholic fatty liver disease. N Engl J Med 2002; 346:1221- 31.
8. Neuschwander-Tetri BA, Caldwell SH. Nonalcoholic steatohepatitis: sum- mary of an AASLD Single Topic Conference. Hepatology 2003; 37: 1202-
19.
9. Ryoo JH, Choi JM, Moon SY, Suh YJ, Shin JY, Shin HC, Park SK. The clini- cal availability of non alcoholic fatty liver disease as an early predictor of the metabolic syndrome in Korean men: 5-year’s prospective cohort study.
Atherosclerosis 2013; 227: 398-403.
10. Nishiura T, Watanabe H, Ito M, Matsuoka Y, Yano K, Daikoku M, Yatsu- hashi H, Dohmen K, Ishibashi H. Ultrasound evaluation of the fibrosis stage in chronic liver disease by the simultaneous use of low and high frequency probes. Br J Radiol 2005; 78: 189-97.
11. Hung CH, Lu SN, Wang JH, Lee CM, Chen TM, Tung HD, Chen CH, Huang WS, Changchien CS. Correlation between ultrasonographic and patho- logic diagnoses of hepatitis B and C virus-related cirrhosis. J Gastroenter- ol 2003; 38: 153-7.
12. Saadeh S, Younossi ZM, Remer EM, Gramlich T, Ong JP, Hurley M, Mul- len KD, Cooper JN, Sheridan MJ. The utility of radiological imaging in non- alcoholic fatty liver disease. Gastroenterology 2002; 123: 745-50.
13. Hernaez R, Lazo M, Bonekamp S, Kamel I, Brancati FL, Guallar E, Clark JM, Cooper JN, Sheridan MJ. Diagnostic accuracy and reliability of ultra- sonography for the detection of fatty liver: a meta-analysis. Hepatology 2011; 54: 1082-90.
14. Mottin CC, Moretto M, Padoin AV, Swarowsky AM, Toneto MG, Glock L, Repetto G. The role of ultrasound in the diagnosis of hepatic steatosis in morbidly obese patients. Obes Surg 2004; 14: 635-7.
15. Alberti KG, Eckel RH, Grundy SM, Zimmet PZ, Cleeman JI, Donato KA, Fruchart JC, James WP, Loria CM, Smith SC Jr, et al. Harmonizing the met- abolic syndrome: a joint interim statement of the International Diabetes Federation Task Force on Epidemiology and Prevention; National Heart, Lung, and Blood Institute; American Heart Association; World Heart Fed- eration; International Atherosclerosis Society; and International Associa- tion for the Study of Obesity. Circulation 2009; 120: 1640-5.
16. Ruhl CE, Everhart JE. Determinants of the association of overweight with elevated serum alanine aminotransferase activity in the United States.
Gastroenterology 2003; 124: 71-9.
17. Pagano G, Pacini G, Musso G, Gambino R, Mecca F, Depetris N, Cassader M, David E, Cavallo-Perin P, Rizzetto M. Nonalcoholic steatohepatitis, in- sulin resistance, and metabolic syndrome: further evidence for an etio- logic association. Hepatology 2002; 35: 367-72.
18. Sanyal AJ, Campbell-Sargent C, Mirshahi F, Rizzo WB, Contos MJ, Sterling RK, Luketic VA, Shiffman ML, Clore JN. Nonalcoholic steatohepatitis: as- sociation of insulin resistance and mitochondrial abnormalities. Gastro- enterology 2001; 120: 1183-92.
19. Mehran AE, Templeman NM, Brigidi GS, Lim GE, Chu KY, Hu X, Botezelli JD, Asadi A, Hoffman BG, Kieffer TJ, et al. Hyperinsulinemia drives diet- induced obesity independently of brain insulin production. Cell Metab 2012; 16: 723-37.
20. McNay EC, Teske JA, Kotz CM, Dunn-Meynell A, Levin BE, McCrimmon RJ, Sherwin RS. Long-term, intermittent, insulin-induced hypoglycemia produces marked obesity without hyperphagia or insulin resistance: a model for weight gain with intensive insulin therapy. Am J Physiol Endo- crinol Metab 2013; 304: E131-8.
21. Russell-Jones D, Khan R. Insulin-associated weight gain in diabetes--causes, effects and coping strategies. Diabetes Obes Metab 2007; 9: 799-812.
22. Bedogni G, Miglioli L, Masutti F, Tiribelli C, Marchesini G, Bellentani S.
Prevalence of and risk factors for nonalcoholic fatty liver disease: the Dio- nysos nutrition and liver study. Hepatology 2005; 42: 44-52.
23. Joy D, Thava VR, Scott BB. Diagnosis of fatty liver disease: is biopsy neces- sary? Eur J Gastroenterol Hepatol 2003; 15: 539-43.
24. Mathiesen UL, Franzén LE, Aselius H, Resjö M, Jacobsson L, Foberg U, Frydén A, Bodemar G. Increased liver echogenicity at ultrasound exami- nation reflects degree of steatosis but not of fibrosis in asymptomatic pa- tients with mild/moderate abnormalities of liver transaminases. Dig Liv- er Dis 2002; 34: 516-22.
25. Scatarige JC, Scott WW, Donovan PJ, Siegelman SS, Sanders RC. Fatty in- filtration of the liver: ultrasonographic and computed tomographic cor- relation. J Ultrasound Med 1984; 3: 9-14.
26. Graif M, Yanuka M, Baraz M, Blank A, Moshkovitz M, Kessler A, Gilat T, Weiss J, Walach E, Amazeen P, et al. Quantitative estimation of attenua- tion in ultrasound video images: correlation with histology in diffuse liver disease. Invest Radiol 2000; 35: 319-24.
Supplementary Table 1. Hazard ratios and 95% confidence intervals for the incidence of abdominal obesity according to categories of non-alcoholic fatty liver diseases in people with age < 45 yr (n = 6,158)
Hazard ratios (95% confidence interval)
Unadjusted Age-adjusted Model 1 Model 2
NAFLD Normal Mild
Moderate to severe P for trend
1.00 (reference) 2.23 (1.94-2.56) 3.63 (2.46-5.35)
< 0.001
1.00 (reference) 2.22 (1.94-2.55) 3.63 (2.46-5.35)
< 0.001
1.00 (reference) 0.99 (0.82-1.19) 1.16 (0.70-1.91)
0.087
1.00 (reference) 1.05 (0.86-1.27) 1.28 (0.77-2.11)
0.035
Age - 1.01 (0.99-1.03) 0.98 (0.96-1.01) 0.98 (0.96-1.01)
Baseline WC - - 1.30 (1.27-1.34) 1.31 (1.27-1.34)
Total cholesterol - - 1.00 (1.00-1.01) 1.00 (1.00-1.01)
Log(hsCRP) - - 1.04 (0.95-1.13) 1.03 (0.94-1.12)
HOMA-IR - - 1.02 (0.93-1.13) 1.05 (0.94-1.16)
eGFR - - 0.99 (0.98-1.00) 0.99 (0.98-1.00)
Smoking status - - - 1.05 (0.88-1.26)
Regular exercise - - - 0.57 (0.45-0.72)
Hypertension - - - 1.09 (0.85-1.40)
Diabetes mellitus - - - 1.83 (0.88-3.78)
Model 1 was adjusted for age, baseline WC, total cholesterol, log(hsCRP), HOMA-IR and eGFR. Model 2 was adjusted for model 1 plus recent smoking status, regular exercise, hypertension and diabetes mellitus. NAFLD, non alcoholic fatty liver disease; WC, waist circumference; hsCRP, high-sensitivity C-reactive protein; HOMA-IR, homeostasis model assessment of insulin resistance; eGFR, estimated glomerular filtration rate.
Supplementary Table 2. Hazard ratios and 95% confidence intervals for the incidence of abdominal obesity according to categories of non-alcoholic fatty liver diseases in people with age ≥ 45 yr (n = 5,054)
Hazard ratios (95% confidence interval)
Unadjusted Age-adjusted Model 1 Model 2
NAFLD Normal Mild
Moderate to severe P for trend
1.00 (reference) 2.44 (2.13-2.79) 5.14 (3.51-7.53)
< 0.001
1.00 (reference) 2.46 (2.15-2.81) 5.32 (3.63-7.79)
< 0.001
1.00 (reference) 1.08 (0.89-1.31) 1.80 (1.08-3.00)
< 0.001
1.00 (reference) 1.09 (0.90-1.33) 1.95 (1.16-3.26)
< 0.001
Age - 1.02 (1.01-1.03) 1.01 (1.00-1.03) 1.01 (1.00-1.02)
Baseline WC - - 1.27 (1.24-1.31) 1.27 (1.23-1.30)
Total cholesterol - - 1.00 (0.99-1.00) 1.00 (0.99-1.00)
Log(hsCRP) - - 1.00 (0.91-1.09) 0.98 (0.89-1.08)
HOMA-IR - - 1.13 (1.02-1.25) 1.12 (1.01-1.25)
eGFR - - 1.00 (0.98-1.01) 1.00 (0.99-1.01)
Smoking status - - - 1.22 (1.00-1.47)
Regular exercise - - - 0.78 (0.63-0.95)
Hypertension - - - 1.36 (1.12-1.66)
Diabetes mellitus - - - 1.11 (0.78-1.59)
Model 1 was adjusted for age, baseline WC, total cholesterol, log(hsCRP), HOMA-IR and eGFR. Model 2 was adjusted for model 1 plus recent smoking status, regular exercise, hypertension and diabetes mellitus. NAFLD, non alcoholic fatty liver disease; WC, waist circumference; hsCRP, high-sensitivity C-reactive protein; HOMA-IR, homeostasis model assessment of insulin resistance; eGFR, estimated glomerular filtration rate.