Copyright © 2016 Korean Association of External Quality Assessment Service 68
Annual Report on the External Quality Assessment Scheme for Biochemical Genetics in Korea (2015)
Soo-Youn Lee
1, Ok Ja Ji
1, Gye Cheol Kwon
2, Jong- Won Kim
1, Hyung-Doo Park
1, Junghan Song
3, Sang- Guk Lee
4, Yong-Wha Lee
5, Eun Hee Lee
6, Sail Chun
7, and Tae Youn Choi
8, as the Biochemical Genetics Subcommittee, Korean Association of External Quality Assessment Service
1
Department of Laboratory Medicine and Genetics, Samsung Medical Center, Sungkyunkwan University School of Medicine, Seoul;
2
Department of Laboratory Medicine, Chungnam National University Hospital, Daejeon;
3Department of Laboratory Medicine, Seoul Natinal University Bundang Hospital, Seongnam;
4
Department of Laboratory Medicine, Severance Hospital, Yonsei University College of Medicine, Seoul;
5Department of Laboratory Medicine and Genetics, Soonchunhyang University Bucheon Hospital, Soonchunhyang University College of Medicine, Bucheon;
6
Green Cross Laboratories, Yongin;
7Department of Laboratory Medicine, Asan Medical Center, University of Ulsan College of Medicine;
8
Department of Laboratory Medicine, Soonchunhyang University Seoul Hospital, Soonchunhyang University College of Medicine, Seoul, Korea
Two external quality assessment (EQA) trials of conventional newborn screening tests for phenylketonuria, galactosemia, congenital adrenal hyperplasia, maple syrup urine disease, homocystinuria, and congenital hypothyroidism, as well as newborn screening tests using tandem mass spectrometry, were performed in 2015. A total of 44 specimens in the form of dried blood spots were distributed to 16 laboratories and the response rate of these laboratories was 100%. The mean, standard deviation, coefficient of variation, median, and cut-offs were evaluated for each analyte in the newborn screening tests. Two EQA trials for the analyses of methylmalonic acid, vanillylmandelic acid, catecholamines, metanephrines, organic acids, and amino acids were also performed. A well-designed EQA program and continuous education would improve the performance of biochemical genetics tests.
(J Lab Med Qual Assur 2016;38:68-76)
Key Words: External quality assessment, Newborn screening, Tandem mass spectrometry, Biochemical genetics
Corresponding author:
Soo-Youn Lee
Department of Laboratory Medicine and Genetics, Samsung Medical Center, Sungkyunkwan University School of Medicine, 81 Irwon-ro, Gangnam-gu, Seoul 06351, Korea
Tel: +82-2-3410-1834 Fax: +82-2-3410-2719 E-mail: [email protected]
ANNUAL REPORT
pISSN: 2384-2458 eISSN: 2288-7261
http://dx.doi.org/10.15263/jlmqa.2016.38.2.68
69 J Lab Med Qual Assur 2016;38:68-76
www.jlmqa.org
Soo-Youn Lee et al • Quality Assessment of Biochemical Genetics
서론
대한임상검사정도관리협회 생화학유전학분과에서는 1997 년도부터 선천성대사질환 선별검사에 대한 신빙도조사사업 을 시작하여 매년 2회의 신빙도조사를 시행해오고 있다. 탠덤 질량분석기(tandem mass spectrometry, MS/MS)를 이용한 광범위 선별검사에 대한 신빙도조사사업은 2004년도에 예비 신빙도조사를 실시한 이래 2007년도부터 정규항목으로 포함 하여 시행 중이다[1]. 2011년도부터는 예비 신빙도조사를 거 쳐 소변 메틸말론산(methylmalonic acid, MMA)와 바닐만델 산(vanillylmandelic acid, VMA), 소변 유기산 분석을 추가하 였고, 2012년도부터는 혈장 아미노산 및 유기산 종목을 추가 하였으며, 2014년도에는 요중 카테콜라민(catecholamines), 메타네프린(metanephrines) 종목을 추가하는 등 점차 사업대 상종목을 확대해오고 있다[2-5]. 저자들은 2015년 실시된 생 화학유전학분과 신빙도조사결과를 분석하여 보고하고자 한 다.
재료 및 방법
1. 대상 및 검체
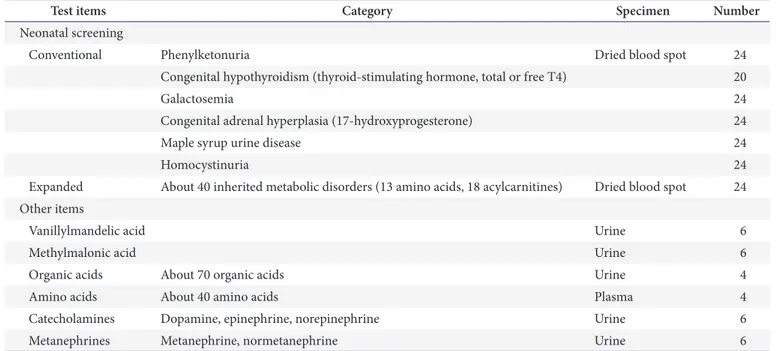
2015년도 2회의 생화학유전학분과 선천성대사이상 검사 신 빙도조사대상항목 및 정도관리 검체 현황은 Table 1에 정리하 였다. 정도관리 검체는 상품화된 정도관리물질과 자가제조 검
체를 혼용하였고, 항목별 정상과 비정상 수치가 모두 포함되도 록 하였으며, 일부 검체에 대해서는 특정 대사질환에 특이적인 성분 다수를 동시에 포함시켰다.
기본 선별검사의 대상질환으로는 페닐케톤뇨증(phenylk- etonuria, PKU), 갈락토오스혈증(galactosemia), 선천성 부신과형성증(congenital adrenal hyperplasia), 단풍당 뇨증(maple syrup urine disease, MSUD), 호모시스틴 뇨증(homocystinuria, HCY), 선천성갑상선기능저하증 (congenital hypothyroidism) 등 6가지가 포함되었으며, 총 16기관을 대상으로 총 44개(NST15-1-01-12, T4/thyroid- stimulating hormone [TSH]15-1-01-10, NST15-2-01-12, T4/TSH15-2-01-10)의 건조혈액여과지(dried blood spot, DBS) 검체를 발송하였다. MS/MS를 이용한 광범위 선별검 사항목으로 아실카르니틴(acylcarnitine, AC)은 1차와 2차에 각각 14종목이 포함되었고, 아미노산은 14종목이 포함되었다.
DBS 정도관리 검체는 대부분 자가제조하여 준비하였고, 질환 양성 검체를 구하기 어려운 경우 상품화된 정도관리물질(Bio- Rad Laboratories, Hercules, CA, USA)을 일부 사용하였다.
DBS 자가제조를 위해 HIV 항체와 B형간염 항원이 음성인 혼 합혈청에 식염수로 세척한 O형 적혈구 적당량을 첨가하여 헤 마토크릿을 약 55%가 되도록 맞춘 전혈을 준비한 후 측정대 상 성분을 첨가하였다. 이를 여과지에 75 μL씩 분주하여 DBS 를 만든 다음 실온의 암실에서 충분히 말린 후 보관하였다.
아미노산, 유기산 검사를 위한 정도관리 검체는 혼합 혈
Table 1. Test items and specimens included in the proficiency tests in 2015
Test items Category Specimen Number
Neonatal screening
Conventional Phenylketonuria Dried blood spot 24
Congenital hypothyroidism (thyroid-stimulating hormone, total or free T4) 20
Galactosemia 24
Congenital adrenal hyperplasia (17-hydroxyprogesterone) 24
Maple syrup urine disease 24
Homocystinuria 24
Expanded About 40 inherited metabolic disorders (13 amino acids, 18 acylcarnitines) Dried blood spot 24 Other items
Vanillylmandelic acid Urine 6
Methylmalonic acid Urine 6
Organic acids About 70 organic acids Urine 4
Amino acids About 40 amino acids Plasma 4
Catecholamines Dopamine, epinephrine, norepinephrine Urine 6
Metanephrines Metanephrine, normetanephrine Urine 6
70 J Lab Med Qual Assur 2016;38:68-76 www.jlmqa.org Soo-Youn Lee et al • Quality Assessment of Biochemical Genetics
청(pooled serum) 또는 혼합 소변(pooled urine)에 상품화 된 표준물질(Sigma-Aldrich, St. Louis, MO, USA)을 첨 가하여 제조하였다. MMA 검사를 위해서는 정상 성인의 혼 합 소변에 MMA 표준물질을 첨가하여 MMA 고농도인 검체 (MMA15-1-01-03, MMA15-2-01-03)를 제조하였다. VMA 정도관리 검체(VMA15-1-01-03, VMA15-2-01-03)는 요중 VMA 수치가 높은 환자들의 혼합 소변을 이용하여 준비하 였다. 유기산 검사를 위한 소변 검체(organic acid 15-1-01- 02, organic acid 15-2-01-02)도 정상 성인의 혼합 소변에 각 표준물질(Sigma-Aldrich)을 첨가하여 제조하였다. 1차에 3-hydroxy propionic acid, MMA 표준물질을 첨가하였고, 2 차에 2-hydroxyisovaleric acid, 2-keto-3-methylvaleric acid, 2-keto-isocaproic acid 표준물질을 첨가하였다. 혈장 아미노 산 분석을 위해서는(amino acid 15-1-01-02, amino acid 15- 2-01-02) 정상 성인의 혼합 혈장(pooled plasma)에 표준물질 (Sigma-Aldrich)을 첨가한 혈장 검체를 제조하여 발송하였 다. 1차에 arginine 표준물질을 첨가하였고, 2차에 tyrosine, alanine 표준물질을 첨가하였다.
2014년도부터 새로이 시작된 카테콜라민과 메타네프린 종 목을 위한 검체(CAT15-1-01-03, MET15-1-01-03, CAT15- 2-01-03, MET15-2-01-03)들은 환자들의 혼합 소변을 이용하 여 제조하였다.
2. 결과 판정 및 분석
기본 선별검사의 경우에는 각 검사기관이 수행하고 있는 종 목에 대해 검사를 실시하여 결과 수치와 함께 정상 및 비정상, 재검 여부 등을 판정하여 회신하도록 하였다. 결과분석 시 같 은 검사방법을 이용한 응답기관이 3개 이상일 경우에 평균, 표 준편차, 변이계수를 구하였다. 또한 검사결과로부터 각 검사 기관에서 판독하는 정상 및 비정상, 재검 여부의 판정결과에
대해 분석하였다. MS/MS를 이용한 광범위 선별검사의 경우 AC 및 아미노산 결과 수치와 함께 정상 및 비정상 판정, 기준 치(cut-off) 등을 회신하도록 하였다. 결과분석은 응답기관에 대해 판정결과 및 판정 일치율과 각 기관에서 사용하고 있는 기준치에 대한 평균, 중앙값, 최저값, 최고값에 대해 분석하였 고, 각 기관의 검사성적에 대한 비교 평가 그래프를 제공하였 다.
MMA 및 VMA 검사의 경우는 참여기관 수가 많지 않아 보 고된 수치들의 범위를 제공하는 것으로 결과 판정을 대신하였 으며, 측정값의 평균, 중앙값, 최저값, 최고값에 대해 분석한 표를 제공하였다. 유기산 및 아미노산 검사 역시 소수의 기관 만 검사를 수행하므로 측정값을 비교할 수 있도록 각 기관이 보고한 항목과 측정값을 제공하는 것으로 결과 판정을 대신하 였다. 수탁기관에 대한 정도관리인증 기준은 참가기관 수 5개 이상이면서, 결과판정 일치율이 70% 이상인 기본 선별검사종 목을 대상으로, 종목별 보고결과의 정답 일치율 80% 이상, 참 가한 종목 전체 보고결과의 정답 일치율 90% 이상인 경우로 하였다.
결과
1. 참여기관 및 회신율
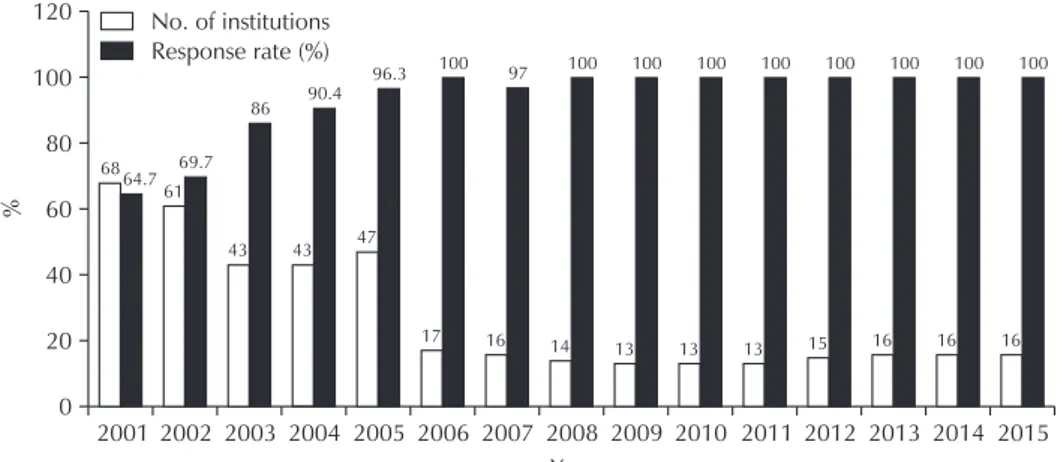
2001년부터 2015년도까지의 연도별 참여기관 및 회신율은 Fig. 1과 같았다. 2015년도 1차와 2차 신빙도조사에서의 전체 16기관의 회신율은 100%로 각 기관에서 실제로 시행하고 있 는 검사들에 대해 모두 신빙도조사에 참가 및 회신하였다. 기 본 선별검사 6항목은 총 16기관, 일부 항목에 대해서는 15기 관 또는 14기관이, MS/MS를 이용한 광범위 선별검사항목에 대해서는 해당 검사 시행 중인 총 15기관, 일부 항목에 대해서 는 14기관이 해당하였다. MMA 검사 4기관, VMA 검사 7기
No. of institutions Response rate (%)
2001 2002 2003 2004 2005 2006
%
2007 2008 2009 120
100 80 60 40 20
0
2010 2011 2012 Year
2013 2014 2015 6864.7
61 69.7
43 86
43 90.4
47 96.3
17 100
16 97
14
100 100 100 100 100 100 100 100
16 16 16
13 13 13 15
Fig. 1. The number of institutions
that participated in the program
conducted by the Korean Associ ation
of Quality Assurance for new born
screening tests and their corres-
ponding response rates (2001–2015).
71 J Lab Med Qual Assur 2016;38:68-76
www.jlmqa.org
Soo-Youn Lee et al • Quality Assessment of Biochemical Genetics
관, 아미노산 검사는 1차에 6기관, 2차에 5기관, 유기산 검사 는 1차에 4기관, 2차에 3기관이 각각 참여하였다. 카테콜라민 과 메타네프린 종목에 대해서는 총 6개의 소변 검체를 발송하 였는데, 각각 7개의 기관이 참여하였다.
2. 검사법 및 장비현황
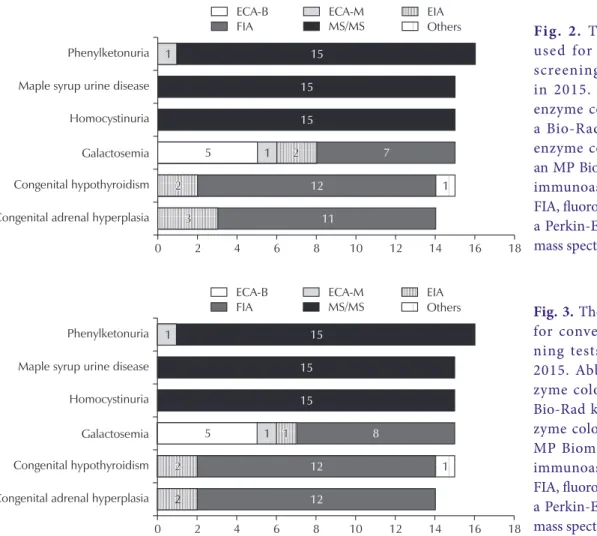
6개 질환에 대한 기본 신생아 선별검사에 이용되는 검사방 법은 Fig. 2 및 Fig. 3과 같았다. 기본 선별검사에는 효소비색 법, 효소면역측정법, 방사선면역측정법과 MS/MS법 등이 이
Table 2. Results of the proficiency testing of conventional neonatal screening tests
Variable 1st trial 2nd trial
No. of
institutions Proportion of
correct answers (%) No. of
institutions Proportion of correct answers (%)
Phenylketonuria 16 191/192 (99) 16 192/192 (100)
Galactosemia 15 178/180 (99) 15 165/165 (100)
Congenital adrenal hyperplasia 14 168/168 (100) 14 168/168 (100)
Maple syrup urine disease 15 179/180 (99) 15 180/180 (100)
Homocystinuria 15 180/180 (100) 15 180/180 (100)
Congenital hypothyroidism
Thyroid-stimulating hormone 15 150/150 (100) 15 150/150 (100)
T4, total 8 80/80 (100) 9 81/81 (100)
T4, free 6 42/42 (100) 5 42/45 (93)
18
0 2
Phenylketonuria Maple syrup urine disease Homocystinuria Galactosemia Congenital hypothyroidism Congenital adrenal hyperplasia
4 6 8 10 12 14 16
ECA-M
ECA-B EIA
FIA MS/MS Others
1 15
15
5 1 111 8
2 2
2 12 111
15
12 2
Fig. 3. The analytical methods used for conventional neonatal scree- ning tests of the second trial in 2015. Abbreviations: ECA-B, en- zyme colourimetric assay using a Bio-Rad kit or others; ECA-M, en- zyme colourimetric assay using an MP Biomedicals kit; EIA, enzyme immunoassay using a Bio-Rad kit;
FIA, fluorometric immunoassay using a Perkin-Elmer kit; MS/MS, tandem mass spectrometry.
18
0 2
Phenylketonuria Maple syrup urine disease Homocystinuria
Galactosemia Congenital hypothyroidism Congenital adrenal hyperplasia
4 6 8 10 12 14 16
ECA-M
ECA-B EIA
FIA MS/MS Others
1 15
15
5 1 222 7
2 2
2 12 111
3 3
3 11
15
Fig. 2. The analytical methods used for conventional neonatal screening tests of the first trial in 2015. Abbreviations: ECA-B, enzyme colourimetric assay using a Bio-Rad kit or others; ECA-M, enzyme colourimetric assay using an MP Biomedicals kit; EIA, enzyme immunoassay using a Bio-Rad kit;
FIA, fluorometric immunoassay using
a Perkin-Elmer kit; MS/MS, tandem
mass spectrometry.
72 J Lab Med Qual Assur 2016;38:68-76 www.jlmqa.org Soo-Youn Lee et al • Quality Assessment of Biochemical Genetics
용되어 왔는데, MSUD, PKU, HCY 선별검사의 경우 면역 분석법 대신 MS/MS법을 사용하는 기관 수가 해마다 증가하 여 2015년 신빙도조사에서는 총 16기관 중 15기관에서 MS/
MS법을 사용하여 결과를 보고하였다. VMA, MMA, 유기산 검사에는 액체크로마토그래피(liquid chromatography) 또는 액체크로마토그래피-탠덤질량분석(liquid chromatography
tandem mass spectrometry)법, 가스크로마토그래피-질량분 석(gas chromatography-mass spectrometry)법이 주로 이용 되었으며, 아미노산 분석에는 액체크로마토그래피-탠덤질량 분석법 또는 아미노산분석기(amino acid analyzer)가 이용되 었다. 카테콜라민과 메타네프린 검사에는 액체크로마토그래 피 또는 액체크로마토그래피-탠덤질량분석법이 이용되었다.
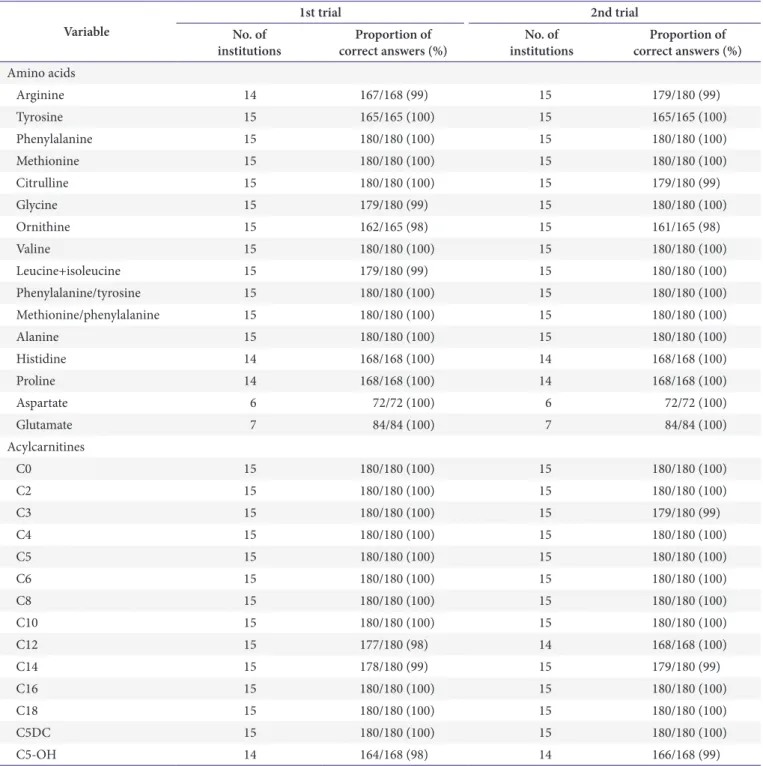
Table 3. Results of the proficiency testing of expanded neonatal screening tests using tandem mass spectrometry
Variable 1st trial 2nd trial
No. of
institutions Proportion of
correct answers (%) No. of
institutions Proportion of correct answers (%) Amino acids
Arginine 14 167/168 (99) 15 179/180 (99)
Tyrosine 15 165/165 (100) 15 165/165 (100)
Phenylalanine 15 180/180 (100) 15 180/180 (100)
Methionine 15 180/180 (100) 15 180/180 (100)
Citrulline 15 180/180 (100) 15 179/180 (99)
Glycine 15 179/180 (99) 15 180/180 (100)
Ornithine 15 162/165 (98) 15 161/165 (98)
Valine 15 180/180 (100) 15 180/180 (100)
Leucine+isoleucine 15 179/180 (99) 15 180/180 (100)
Phenylalanine/tyrosine 15 180/180 (100) 15 180/180 (100)
Methionine/phenylalanine 15 180/180 (100) 15 180/180 (100)
Alanine 15 180/180 (100) 15 180/180 (100)
Histidine 14 168/168 (100) 14 168/168 (100)
Proline 14 168/168 (100) 14 168/168 (100)
Aspartate 6 72/72 (100) 6 72/72 (100)
Glutamate 7 84/84 (100) 7 84/84 (100)
Acylcarnitines
C0 15 180/180 (100) 15 180/180 (100)
C2 15 180/180 (100) 15 180/180 (100)
C3 15 180/180 (100) 15 179/180 (99)
C4 15 180/180 (100) 15 180/180 (100)
C5 15 180/180 (100) 15 180/180 (100)
C6 15 180/180 (100) 15 180/180 (100)
C8 15 180/180 (100) 15 180/180 (100)
C10 15 180/180 (100) 15 180/180 (100)
C12 15 177/180 (98) 14 168/168 (100)
C14 15 178/180 (99) 15 179/180 (99)
C16 15 180/180 (100) 15 180/180 (100)
C18 15 180/180 (100) 15 180/180 (100)
C5DC 15 180/180 (100) 15 180/180 (100)
C5-OH 14 164/168 (98) 14 166/168 (99)
73 J Lab Med Qual Assur 2016;38:68-76
www.jlmqa.org
Soo-Youn Lee et al • Quality Assessment of Biochemical Genetics
Table 4. Cut-offs used in expanded neonatal screening tests using tandem mass spectrometry
Variable Mean Median Minimum Maximum
Amino acids (μmol/L)
Arginine 58.28 59.50 39.43 79.16
Tyrosine 298.23 298.70 246.87 402.00
Phenylalanine 119.97 118.25 100.30 144.34
Methionine 60.19 60.00 46.00 81.20
Citrulline 51.27 46.88 40.00 67.90
Glycine 977.39 1,000.00 420.00 1,546.00
Ornithine 311.93 300.00 180.00 488.00
Valine 266.34 267.28 210.59 312.50
Leucine+isoleucine 293.35 300.00 222.00 351.40
Phenylalanine/tyrosine 2.48 2.27 1.24 4.80
Methionine/phenylalanine 1.07 1.00 0.47 2.00
Alanine 657.12 680.00 340.97 996.00
Histidine 202.99 143.52 1.46 925.00
Proline 455.75 400.05 5.52 1,523.00
Aspartate 168.21 160.32 124.34 239.30
Glutamate 735.35 784.87 466.24 1,000.00
Acylcarnitines (μmol/L)
C0 66.06 64.35 40.00 95.66
C2 53.07 50.00 39.07 78.40
C3 5.40 5.40 3.80 6.90
C4 0.85 0.80 0.46 1.40
C5 0.73 0.71 0.40 1.00
C6 0.28 0.23 0.10 0.52
C8 0.40 0.43 0.15 0.61
C10 0.37 0.40 0.21 0.56
C12 0.47 0.43 0.25 0.90
C14 0.66 0.74 0.38 0.90
C16 6.78 6.69 5.08 9.69
C18 2.13 2.00 1.06 4.46
C5DC 0.25 0.26 0.14 0.39
C5-OH 0.60 0.60 0.50 0.81
C3/C2 0.26 0.30 0.10 0.38
C5/C0 0.30 0.03 0.01 1.52
C5/C2 0.12 0.05 0.01 0.40
C5/C3 1.11 0.54 0.20 2.82
C8/C2 0.04 0.03 0.01 0.11
C8/C10 4.01 3.55 2.00 8.57
74 J Lab Med Qual Assur 2016;38:68-76 www.jlmqa.org Soo-Youn Lee et al • Quality Assessment of Biochemical Genetics
3. 신빙도조사결과
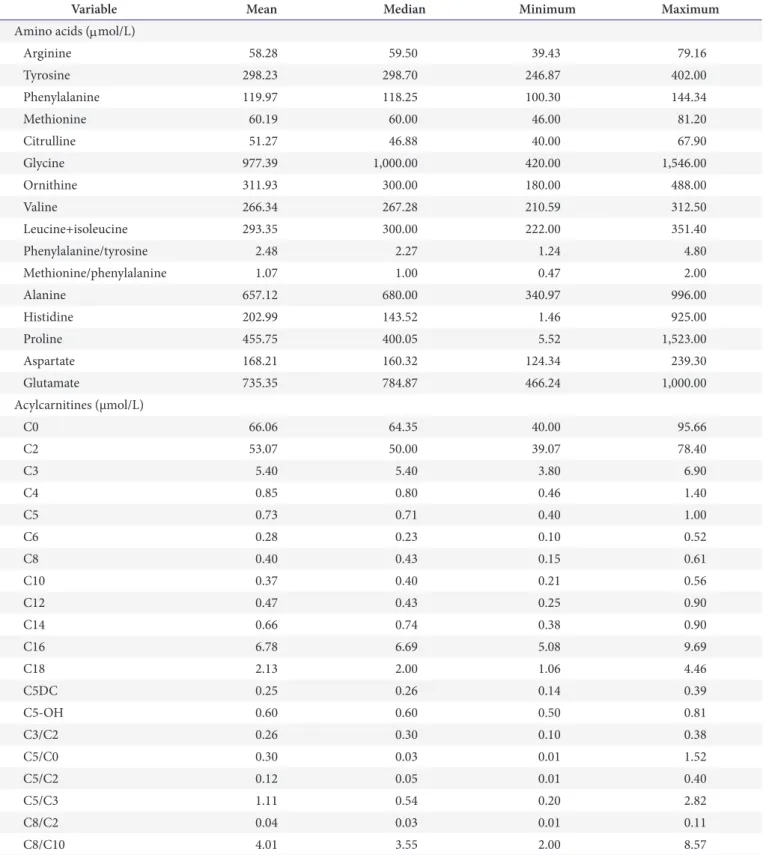
6종 기본 선별검사와 MS/MS를 이용한 광범위 신생아 선 별검사 및 각 항목별 정답률 현황은 Tables 2, 3에 정리하였 다. MS/MS 검사상 포함된 각 항목에 대한 기준치의 분포는 Table 4와 같았다.
신생아 선별검사에 대한 상세 자료는 Supplemental Tables 1-16에 정리된 내용을 참조하기 바란다. MMA 및 VMA 에 대한 결과는 Supplemental Tables 17, 18, 유기산 분석 결과는 Supplemental Tables 19, 20, 아미노산 분석결과는 Supplemental Tables 21, 22, 카테콜라민과 메타네프린 분석 결과는 Supplemental Tables 23, 24에 제시하였다.
고찰
생화학유전학분과 신빙도조사사업은 1997년에 처음 시행 되었으며 1998년에 1회, 1999년 2회, 2000년에 2회, 2001년 1회 시행하였고 2002년도부터는 매년 2회씩 시행하고 있다.
MS/MS를 이용한 광범위 선별검사에 대한 신빙도조사사업은 2007년도부터 시작하였고, 2011년도부터는 아미노산, 유기산, MMA, VMA 등을 포함하여 종목 확대를 위해 노력하고 있다.
정도관리 검체는 상품화된 정도관리 검체와 자가제조 검체를 혼용하여 사용하였으며 정상과 비정상 수치가 모두 포함되도 록 하고 있다.
2014년부터는 항목별 검체의 수를 더욱 증가시키고 cut-off 보다 약간 높은 수치를 보이는 검체를 포함시켜 신빙도조사를 통한 각 기관의 검사수행능을 보다 정확히 파악하는 데 도움을 주고자 하였다. 그 결과 판정의 불일치를 보인 항목들이 일부 항목들에서 또는 일부 기관에서 발견되었다. MSUD와 갈락토 오스혈증의 경우 판정 불일치를 보인 기관들은 cut-off보다 약 간 높은 수치를 보이는 검체에서 cut-off는 타 기관과 별로 차 이가 없었으나 검사결과 수치가 타 기관에 비해 낮은 것으로 나타났다. T4나 TSH 항목의 경우에는 다양한 종류의 정도관 리물질 확보가 힘들며 기관별 검사방법이 달라 항상 어려움을 겪는데, 특히 기준치에 인접한 측정값을 나타내는 항목들은 결 과판정 일치율이 70% 미만으로 낮아 판정 보류를 한 항목들 이 있었다. 이러한 검체들에 대한 분석결과들에 대해서는 기관 별 측정값, 측정방법, 기준치의 차이와 그에 따른 판정결과의 차이, 재검율에 대해 각 기관 자체적으로 면밀한 고찰이 필요 하겠다. PKU의 경우 특정 기관에서만 타 기관과 다른 검사방 법을 이용하고 있었고, 양성 검체에서 타 기관에 비해 결과값 이 낮게 분포되어 있는 것으로 나타나 검사방법의 재검토를 권 유하였다.
MS/MS를 이용한 광범위 선별검사에서도 일부 종목에서 판정 불일치가 관찰되었으며, 이들 기관에서는 기관 내 cut- off 및 검사방법에 대한 검토가 필요할 것으로 판단되었다.
C12, C14, C5-OH, ornithine, glycine 등의 종목에 대해서 판정 불일치를 보인 기관들이 관찰되었으며, 일부 기관에서 는 cut-off가 타 기관에 비해 유의하게 다른 것으로 나타났다.
Aspartate, histidine, proline 등의 종목에 대해서는 일부 기 관에서 타 기관과 유의하게 다른 cut-off와 검사결과 수치를 보 고하여 기관별 cut-off와 결과 수치 자료 비교 시 유의가 필요 할 것으로 판단되었다. 또한 MS/MS 검사에서 일부 항목들에 대하여 보고하지 않는 기관의 경우 자체적인 검토를 통하여 보 고 항목으로 추가를 검토할 것이 권장된다.
유기산 검사는 1차와 2차에서 각 2검체를 발송하였으며, 모 든 기관이 질환명과 cut-off 이상의 증가를 보이는 유기산들을 보고하였으나, 그 상승 정도는 기관별로 큰 차이를 보였고 증 가한 것으로 보고한 성분이 다소 차이를 보이는 경우도 있었 다. 해당 대사이상질환에 대한 전형적인 양상을 보이는 검체에 대해서는 각 기관에서 보고한 진단명이 일치하였으나 일부 기 관에서 중요한 성분이 검출되지 않은 경우도 있었다.
아미노산 검사는 1차 및 2차 각각 2검체를 발송하였으며, 각 기관이 제출한 측정값을 제시하는 것으로 평가를 대신하였다.
1차의 경우 arginine이 증가한 혈장 검체와 정상 혈장 검체가 출제되었고, 2차의 경우 정상 혈장 검체, tyrosine과 alanine 이 증가한 혈장 검체가 출제되었다. 특정 아미노산이 증가한 혈장 검체에 대해서는 모든 기관이 유의한 증가를 보이는 아미 노산들과 합당한 질환명을 보고하였으나, 그 상승 정도는 기관 별로 차이를 보였으며, 정상 혈장 검체의 경우 검체 전달과정 에서 실온에 방치되면서 일부 아미노산의 경도 증감으로 인하 여 다양한 질환명으로 보고하여 검체 전달과정에서의 주의가 필요할 것으로 생각되었다.
MMA, VMA 항목의 경우 예년과 마찬가지로 참여한 모든 기관에서 유사한 측정결과값을 보고하였다. 2014년부터 시행 한 카테콜라민과 메타네프린 항목에 대해 2015년도에는 총 7 개 기관에서 신빙도조사에 참여하였으며, 응답한 모든 기관에 서 유사한 측정결과값을 보고하였다.
선천성대사질환에 대한 신생아 선별검사는 검사 수치뿐 아
니라 결과에 대한 정상 및 비정상에 대한 적절한 판독이 매우
중요하다. 그러나 각 기관에서 검사에 사용하는 시약과 검사
방법이 다양하고 정상 및 비정상을 평가할 기준치가 서로 다
른 경우가 많았다. 또한 생화학유전학분과 신빙도조사에서 겪
는 애로사항으로 동일검사법 이용기관의 수가 적은 경우 비교
불가한 점, 다양한 질환 양성 검체를 대량 확보하기 어려운 점,
75 J Lab Med Qual Assur 2016;38:68-76
www.jlmqa.org
Soo-Youn Lee et al • Quality Assessment of Biochemical Genetics
단일 성분만이 아닌 다수의 증감 양상이 조합된 검체를 준비해 야 하는 점 등이 있었다. 각 기관에서는 신빙도조사결과를 자 체적으로도 면밀히 검토 분석하여 분석법의 신뢰성을 확인하 고 내부정도관리를 강화함과 동시에 주기적으로 기준치를 검 증하고 결과보고종목 및 결과해석의 차이도 점검해보는 것이 매우 중요할 것으로 생각된다. 앞으로도 종목 확대, 적절한 정 도관리물질의 확보, 워크숍 개최를 통한 관련 인력교육을 포함 하여 지속적으로 신빙도조사 프로그램을 개선 발전시킬 수 있 는 방향을 모색한다면 생화학유전 검사의 질 향상에 기여할 수 있을 것으로 전망한다.
감사의 글
정도관리물질 제조관리와 결과자료분석 등 본 신빙도조사를 위해 수고해주신 삼성서울병원 진단검사의학과 특수화학검사 실 직원 여러분들과 임상강사 선생님께 감사드린다.
생화학유전분과위원회 위원(2015)
이수연(위원장, 성균관대학교 의과대학), 지옥자(간사, 삼성 서울병원), 권계철(충남대학교 의과대학), 김종원(성균관대학 교 의과대학), 박형두(성균관대학교 의과대학), 송정한(서울 대학교 의과대학), 이상국(연세대학교 의과대학), 이용화(순 천향대학교 의과대학), 이은희(녹십자의료재단), 전사일(울산 대학교 의과대학), 최태윤(순천향대학교 의과대학)
SUPPLEMENTARY MATERIALS
Supplementary materials can be found via http://
dx.doi.org/10.15263/jlmqa.2016.38.2.68.
REFERENCES
1. Song J, Kwon KC, Kim JH, Kim JW, Min WK, Lee SY, et al. Annual report on external quality assessment in metabolic disorders in Korea (2007). J Lab Med Qual Assur 2008;30:151-66.
2. Lee SY, Kwon KC, Kim JH, Kim JW, Park BT, Park HD, et al. Annual report on external quality assessment in biochemical genetics in Korea (2011). J Lab Med Qual Assur 2012;34:S25-49.
3. Lee SY, Kwon KC, Kim JH, Kim JW, Park BT, Park HD, et al. Annual report on external quality assessment in biochemical genetics in Korea (2012). J Lab Med Qual Assur 2013;35:S29-63.
4. Lee SY; Biochemical Genetics Subcommittee, The Korean Association of Quality Assurance for Clinical Laboratory. Annual report on external quality assessment of biochemical genetics in Korea (2013). J Lab Med Qual Assur 2014;36:64-70.
5. Lee SY. Annual report on external quality assessment in
biochemical genetics in Korea (2014). J Lab Med Qual
Assur 2015;37:56-63.
76 J Lab Med Qual Assur 2016;38:68-76 www.jlmqa.org Soo-Youn Lee et al • Quality Assessment of Biochemical Genetics
생화학유전분과 신빙도조사 결과보고(2015)
이수연1 • 지옥자1 • 권계철2 • 김종원1 • 박형두1 • 송정한3 • 이상국4 • 이용화5 이은희6 • 전사일7 • 최태윤8 • 대한임상검사정도관리협회 생화학유전분과위원회
1
성균관대학교 의과대학 삼성서울병원 진단검사의학과,
2충남대학교병원 진단검사의학과,
3분당서울대학
교병원 진단검사의학과,
4연세대학교 의과대학 세브란스병원 진단검사의학과,
5순천향대학교 의과대학 순
천향대학교 부천병원 진단검사의학과,
6녹십자의료재단,
7울산대학교 의과대학 서울아산병원 진단검사의
학과,
8순천향대학교 의과대학 순천향대학교 서울병원 진단검사의학과
2015년도 생화학유전학분과 신빙도조사사업은 총 2회 시행되었다. 페닐케톤뇨증, 갈락토오스혈증, 선천성 부신형성과다증, 단풍당뇨증, 호모시스틴뇨증, 선천성 갑상선기능저하증을 포함하는 선천성 대사질환 기본 선별검사와 탠덤질량분석기를 이용한 광범위 선별검사를 위한 총 44개의 건조혈액여 과지 검체를 16기관에 발송하였다. 회신율은 100%로, 타 기관으로 위탁을 보내는 검사항목은 제외 하고 각 기관에서 실제로 시행하고 있는 검사들은 모두 참가하였다. 특히 기준치에 인접한 값을 보이 는 검체들이 포함되어 결과판정 일치율이 70% 미만으로 낮아 판정 보류를 한 항목들이 관찰되었다.
타 기관과 차이 나는 측정값 또는 판정을 보이는 경우에는 기관별 측정값, 측정방법, 기준치의 차이와 그에 따른 판정결과의 차이나 결과해석방법 등에 대해 각 기관별로 면밀한 자체 검토가 필요할 것으 로 판단되었다. 이외 메틸말론산과 바닐만델산, 유기산, 아미노산, 카테콜라민 및 메타네프린 항목에 대한 신빙도조사도 시행되었으며 대부분 만족스러운 결과를 보였다. 외부정도관리 프로그램과 지속 적인 교육을 통하여 생화학유전 검사의 질을 향상시킬 수 있을 것으로 기대된다.
(J Lab Med Qual Assur 2016;38:68-76)
교신저자: 이수연
우)06351 서울시 강남구 일원로 81, 성균관대학교 의과대학 삼성서울병원 진단검사의학과 Tel: 02)3410-1834, Fax: 02)3410-2719, E-mail: [email protected]
Soo-Youn Lee1, Ok Ja Ji1, Gye Cheol Kwon2, Jong-Won Kim1, Hyung-Doo Park1, Junghan Song3, Sang-Guk Lee4, Yong-Wha Lee5, Eun Hee Lee6, Sail Chun7, and Tae Youn Choi8, as the Biochemical Genetics Subcommittee, Korean Association of External Quality Assessment Service
1
Department of Laboratory Medicine and Genetics, Samsung Medical Center, Sungkyunkwan University School of Medicine, Seoul;
2Department of Laboratory Medicine, Chungnam National University Hospital, Daejeon;
3Department of Laboratory Medicine, Seoul Natinal University Bundang Hospital, Seongnam;
4Department of Laboratory Medicine, Severance Hospital, Yonsei University College of Medicine, Seoul;
5Department of Laboratory Medicine and Genetics, Soonchunhyang University Bucheon Hospital, Soonchunhyang University College of Medicine, Bucheon;
6Green Cross Laboratories, Yongin;
7Department of Laboratory Medicine, Asan Medical Center, University of Ulsan College of Medicine;
8Department of Laboratory Medicine, Soonchunhyang University Seoul Hospital, Soonchunhyang University College of Medicine, Seoul, Korea
SUPPLEMENTARY INFORMATION
http://dx.doi.org/10.15263/jlmqa.2016.38.2.68
Annual Report on the External Quality Assessment
Scheme for Biochemical Genetics in Korea (2015)
Supplemental Table 1. Summary of the first trial of the 2015 external quality assessment for phenylketonuria screening by detection of phenylalanine (µ mol/L)
Variable Specimen NST15- 1-01
NST15- 1-02
NST15- 1-03
NST15- 1-04
NST15- 1-05
NST15- 1-06
NST15- 1-07
NST15- 1-08
NST15- 1-09
NST15- 1-10
NST15- 1-11
NST15- 1-12
MS/MS* Mean 243.39 57.09 53.76 310.62 63.63 51.55 374.56 59.49 61.50 58.48 55.14 52.05
SD 26.21 9.45 9.47 37.58 11.62 9.98 41.86 12.92 11.60 10.45 7.55 7.92
CV (%) 10.8 16.6 17.6 12.1 18.3 19.4 11.2 21.7 18.9 17.9 13.7 15.2
Median 241.04 54.54 50.48 308.69 60.72 48.85 358.79 54.83 58.78 57.04 52.95 51.68
Min 202.00 46.90 43.52 243.00 47.37 42.30 313.74 43.61 47.74 48.91 45.46 42.51
Max 282.80 78.82 77.21 378.68 90.85 80.03 450.80 91.02 92.09 90.14 69.19 72.77
No. 15 15 15 15 15 15 15 15 15 15 15 15
Normal 0 15 15 0 15 15 0 15 15 15 15 15
Abnormal 15 0 0 15 0 0 15 0 0 0 0 0
ECA† Mean 84.7 30.2 24.2 211.7 30.2 18.1 242 24.2 24.2 18.1 18.1 18.1
SD CV (%) Median Min Max
No. 1 1 1 1 1 1 1 1 1 1 1 1
Normal 1 1 1 0 1 1 0 1 1 1 1 1
Abnormal 0 0 0 1 0 0 1 0 0 0 0 0
*
Tandem mass spectrometry.
†Enzyme colourimetric assay using Bayer or MP Biomedicals reagents.
Supplemental Table 2. Summary of the second trial of the 2015 external quality assessment for phenylketonuria screening by detection of phenylalanine (µ mol/L)
Variable Specimen NST15- 2-01
NST15- 2-02
NST15- 2-03
NST15- 2-04
NST15- 2-05
NST15- 2-06
NST15- 2-07
NST15- 2-08
NST15- 2-09
NST15- 2-10
NST15- 2-11
NST15- 2-12
MS/MS* Mean 49.16 50.00 314.33 59.54 48.05 385.26 55.51 59.22 53.50 55.26 51.39 239.71
SD 6.76 6.27 46.67 5.65 5.12 46.33 13.10 6.53 5.68 7.44 5.97 36.87
CV (%) 13.7 12.5 14.8 9.5 10.6 12.0 23.6 11.0 10.6 13.5 11.6 15.4
Median 50.70 50.58 309.08 59.41 48.79 388.49 53.87 60.48 54.66 52.68 53.03 234.96
Min 34.46 40.56 248.25 48.58 39.65 303.33 38.01 43.62 44.22 41.55 43.65 183.60
Max 57.02 62.41 418.11 67.46 56.28 466.46 94.09 68.68 64.21 69.47 60.56 299.21
No. 15 15 15 15 15 15 15 15 15 15 15 15
Normal 15 15 0 15 15 0 15 15 15 15 15 0
Abnormal 0 0 15 0 0 15 0 0 0 0 0 15
ECA† Mean 46 59.9 171.8 58.1 56.9 263.2 42.9 44.8 41.1 47.8 58.1 125.8
SD CV (%) Median Min Max
No. 1 1 1 1 1 1 1 1 1 1 1 1
Normal 1 1 0 1 1 0 1 1 1 1 1 0
Abnormal 0 0 1 0 0 1 0 0 0 0 0 1
*
Tandem mass spectrometry.
†Enzyme colourimetric assay using MP Biomedicals reagents.
Supplemental Table 3. Summary of the first trial of the 2015 external quality assessment for galactosemia screening by detection of total galactose (mg/dL)
Variable Specimen NST15- 1-01
NST15- 1-02
NST15-1- 03
NST15- 1-04
NST15- 1-05
NST15- 1-06
NST15- 1-07
NST15- 1-08
NST15- 1-09
NST15- 1-10
NST15- 1-11
NST15- 1-12
ECA* Mean 3.67 0.89 0.97 0.92 0.95 37.54 31.78 1.13 0.89 0.85 0.87 17.37
SD 0.50 0.61 0.53 0.49 0.50 5.41 5.12 0.60 0.39 0.52 0.49 3.64
CV (%) 13.6 69.0 54.8 52.9 52.3 14.4 16.1 52.7 44.1 60.6 56.1 21.0
Median 3.85 0.75 1.15 0.86 1.00 37.57 31.09 1.20 0.80 0.80 0.95 17.91
Min 2.80 0.10 0.10 0.40 0.18 31.90 25.40 0.18 0.50 0.10 0.10 12.00
Max 4.10 1.90 1.60 1.60 1.60 46.50 39.40 1.80 1.60 1.60 1.40 21.30
No. 6 6 6 6 6 6 6 6 6 6 6 6
Normal 6 6 6 6 6 0 0 6 6 6 6 0
Abnormal 0 0 0 0 0 6 6 0 0 0 0 6
EIA† Mean 3.20 1.50 0.65 0.80 0.80 38.40 28.85 0.80 1.55 0.85 0.75 17.80
SD 0.00 1.27 0.07 0.28 0.28 5.94 7.85 0.28 0.92 0.21 0.21 3.54
CV (%) 0.00 84.9 10.9 35.4 35.4 15.5 27.2 35.4 59.3 25.0 28.3 19.9
Median 3.20 1.50 0.65 0.80 0.80 38.40 28.85 0.80 1.55 0.85 0.75 17.80
Min 3.20 0.60 0.60 0.60 0.60 34.20 23.30 0.60 0.90 0.70 0.60 15.30
Max 3.20 2.40 0.70 1.00 1.00 42.60 34.40 1.00 2.20 1.00 0.90 20.30
No. 2 2 2 2 2 2 2 2 2 2 2 2
Normal 2 2 2 2 2 0 0 2 2 2 2 0
Abnormal 0 0 0 0 0 2 2 0 0 0 0 2
FIA‡ Mean 3.25 1.78 1.87 1.85 1.88 23.68 18.83 1.88 1.92 2.08 1.92 11.95
SD 1.61 1.80 1.78 1.72 1.78 7.04 4.23 1.85 2.21 2.29 1.86 4.40
CV (%) 49.7 101.2 95.2 93.2 94.6 29.7 22.4 98.2 115.4 109.7 97.2 36.9
Median 2.70 1.20 1.25 1.10 1.15 22.25 17.15 1.15 1.00 1.15 1.15 10.80
Min 2.30 0.50 0.60 0.80 1.00 17.30 15.70 0.70 0.70 0.90 0.90 8.90
Max 6.50 5.40 5.40 5.30 5.50 37.30 26.70 5.60 6.40 6.70 5.70 20.70
No. 7 7 7 7 7 7 7 7 7 7 7 7
Normal 7 7 7 7 7 0 0 7 7 7 7 2
Abnormal 0 0 0 0 0 7 7 0 0 0 0 5
*
Enzyme colourimetric assay using Bio-Rad reagents.
†Enzyme immunoassay using Bio-Rad reagents or others.
‡Fluorometric
immunoassay using Perkin-Elmer reagents.
Supplemental Table 4. Summary of the second trial of the 2015 external quality assessment for galactosemia screening by detection of total galactose (mg/dL)
Variable Specimen NST15- 2-01
NST15- 2-02
NST15- 2-03
NST15- 2-04
NST15- 2-05
NST15- 2-06
NST15- 2-07
NST15- 2-08
NST15- 2-09
NST15- 2-10
NST15- 2-11
NST15- 2-12
ECA* Mean 1.13 0.95 1.20 1.08 28.47 23.42 0.89 0.92 0.77 0.78 14.46 3.01
SD 0.25 0.22 0.40 0.46 6.93 7.43 0.33 0.49 0.28 0.25 3.91 0.78
CV (%) 22.1 23.5 33.5 42.3 24.3 31.7 36.9 53.3 36.7 32.1 27.1 26.0
Median 1.10 0.90 1.10 0.95 29.05 22.60 1.00 0.85 0.85 0.80 13.58 3.15
Min 0.80 0.70 0.70 0.49 16.71 13.38 0.25 0.34 0.25 0.34 8.72 1.81
Max 1.50 1.23 1.80 1.80 38.30 34.00 1.20 1.50 1.00 1.10 19.40 3.90
No. 6 6 6 6 6 6 6 6 6 6 6 6
Normal 6 6 6 6 0 0 6 6 6 6 1 6
Abnormal 0 0 0 0 6 6 0 0 0 0 5 0
FIA† Mean 0.91 0.76 0.80 0.90 19.40 15.26 1.95 0.89 1.16 0.89 8.91 2.19
SD 1.03 0.73 0.80 0.84 2.31 1.84 3.16 0.91 1.28 1.04 2.03 1.26
CV (%) 112.9 96.4 99.8 93.0 11.9 12.0 161.8 102.6 109.8 117.5 22.8 57.5
Median 0.55 0.55 0.60 0.65 18.55 14.60 0.60 0.55 0.75 0.50 9.20 1.95
Min 0.10 0.10 0.10 0.10 17.10 13.30 0.20 0.10 0.10 0.10 5.40 0.40
Max 3.10 2.40 2.50 2.70 23.40 18.30 9.40 2.90 4.20 3.30 12.30 4.50
No. 8 8 8 8 8 8 8 8 8 8 8 8
Normal 8 8 8 8 0 0 8 8 8 8 6 8
Abnormal 0 0 0 0 8 8 0 0 0 0 2 0
EIA‡ Mean 0.13 0.1 0.19 0.04 25.82 19.3 0.07 0.53 0.36 0.02 11.4 1.69
SD CV (%) Median Min Max
No. 1 1 1 1 1 1 1 1 1 1 1 1
Normal 1 1 1 1 0 0 1 1 1 1 0 1
Abnormal 0 0 0 0 1 1 0 0 0 0 1 0
*
Enzyme colourimetric assay using Bio-Rad reagents or others.
†Fluorometric immunoassay using Perkin-Elmer reagents.
‡Enzyme
immunoassay using Bio-Rad reagents or others.
Supplemental Table 5. Summary of the first trial of the 2015 external quality assessment for congenital adrenal hyperplasia screening by detection of 17-hydroxyprogesterone (ng/mL)
Variable Specimen NST15- 1-01
NST15- 1-02
NST15- 1-03
NST15- 1-04
NST15- 1-05
NST15- 1-06
NST15- 1-07
NST15- 1-08
NST15- 1-09
NST15- 1-10
NST15- 1-11
NST15- 1-12
EIA* Mean 1.32 1.47 15.51 19.26 1.81 3.15 1.32 22.83 1.29 1.25 1.16 3.18
SD 0.24 0.28 2.88 4.06 0.21 0.24 0.08 1.65 0.34 0.13 0.35 0.58
CV (%) 18.1 18.8 18.6 21.1 11.8 7.7 5.7 7.2 26.7 10.6 30.0 18.2
Median 1.42 1.60 15.20 18.90 1.85 3.28 1.32 23.30 1.34 1.22 1.10 3.10
Min 1.05 1.15 12.80 15.40 1.58 2.87 1.25 21.00 0.92 1.14 0.85 2.65
Max 1.50 1.65 18.54 23.49 2.00 3.30 1.40 24.19 1.60 1.40 1.54 3.80
No. 3 3 3 3 3 3 3 3 3 3 3 3
Normal 3 3 0 0 3 3 3 0 3 3 3 3
Abnormal 0 0 3 3 0 0 0 3 0 0 0 0
FIA† Mean 0.63 0.85 17.11 23.39 0.90 1.91 0.58 27.26 0.66 0.71 0.66 1.97
SD 0.37 0.51 8.02 9.94 0.41 0.81 0.45 12.48 0.33 0.37 0.61 1.11
CV (%) 59.1 60.0 46.9 42.5 45.5 42.2 77.4 45.8 50.5 52.3 92.5 56.4
Median 0.60 0.60 14.06 20.60 0.70 1.45 0.40 23.10 0.59 0.60 0.47 1.70
Min 0.19 0.40 11.70 16.20 0.56 1.20 0.06 16.90 0.30 0.31 0.09 1.15
Max 1.40 2.10 35.30 46.10 1.70 3.30 1.40 57.20 1.40 1.40 2.30 5.00
No. 11 11 11 11 11 11 11 11 11 11 11 11
Normal 11 11 0 0 11 11 11 0 11 11 11 11
Abnormal 0 0 11 11 0 0 0 11 0 0 0 0
*
Enzyme immunoassay using Bio-Rad reagents.
†Fluorometric immunoassay using Perkin-Elmer reagents.
Supplemental Table 6. Summary of the second trial of the 2015 external quality assessment for congenital adrenal hyperplasia screening by detection of 17-hydroxyprogesterone (ng/mL)
Variable Specimen NST15- 2-01
NST15- 2-02
NST15- 2-03
NST15- 2-04
NST15- 2-05
NST15- 2-06
NST15- 2-07
NST15- 2-08
NST15- 2-09
NST15- 2-10
NST15- 2-11
NST15- 2-12
EIA* Mean 0.99 15.23 16.79 1.11 2.62 0.74 29.76 1.75 0.35 1.41 2.33 0.65
SD 0.55 1.80 1.72 0.57 0.88 0.62 6.30 1.90 0.08 0.55 0.18 0.50
CV (%) 55.7 11.8 10.2 51.8 33.5 84.1 21.2 109.0 22.5 39.1 7.6 77.8
Median 0.99 15.23 16.79 1.11 2.62 0.74 29.76 1.75 0.35 1.41 2.33 0.65
Min 0.60 13.95 15.57 0.70 2.00 0.30 25.30 0.40 0.29 1.02 2.20 0.29
Max 1.38 16.50 18.00 1.51 3.24 1.18 34.21 3.09 0.40 1.80 2.45 1.00
No. 2 2 2 2 2 2 2 2 2 2 2 2
Normal 2 0 0 2 2 2 0 2 2 2 2 2
Abnormal 0 2 2 0 0 0 2 0 0 0 0 0
FIA† Mean 0.89 17.27 21.92 0.91 1.81 0.57 26.74 0.63 0.63 0.59 2.05 0.68
SD 0.45 6.66 7.08 0.51 0.77 0.40 10.49 0.42 0.33 0.40 0.72 0.43
CV (%) 50.3 38.5 32.3 56.3 42.7 69.5 39.2 67.1 52.4 67.0 35.3 63.8
Median 0.71 15.00 19.52 0.69 1.48 0.40 23.15 0.44 0.50 0.42 1.90 0.46
Min 0.44 12.30 16.20 0.49 1.12 0.19 18.70 0.30 0.30 0.28 1.21 0.36
Max 1.80 35.60 42.00 1.91 3.20 1.30 57.00 1.40 1.30 1.40 3.50 1.54
No. 12 12 12 12 12 12 12 12 12 12 12 12
Normal 12 0 0 12 12 12 0 12 12 12 12 12
Abnormal 0 12 12 0 0 0 12 0 0 0 0 0
*
Enzyme immunoassay using Bio-Rad reagents.
†Fluorometric immunoassay using Perkin-Elmer reagents.
Supplemental Table7. Summary of the first trial of the 2015 external quality assessment for homocystinuria screening by detection of methionine (µ mol/L)
Variable Specimen NST15- 1-01
NST15- 1-02
NST15- 1-03
NST15- 1-04
NST15- 1-05
NST15- 1-06
NST15- 1-07
NST15- 1-08
NST15- 1-09
NST15- 1-10
NST15- 1-11
NST15- 1-12
MS/MS* Mean 15.21 14.59 134.49 17.48 15.44 184.00 15.96 15.12 16.52 14.81 13.80 264.55
SD 2.97 3.23 14.64 4.02 3.24 26.00 4.92 4.86 2.99 3.21 3.27 34.73
CV (%) 19.5 22.1 10.9 23.0 21.0 14.1 30.8 32.1 18.1 21.7 23.7 13.1
Median 14.62 13.63 134.00 16.10 15.03 179.30 14.06 12.90 16.08 14.20 12.54 261.28
Min 11.26 9.30 102.78 13.05 9.44 144.23 10.81 10.67 12.41 11.86 10.93 192.96
Max 22.34 22.67 156.30 25.39 22.56 235.02 28.31 28.38 25.04 25.22 23.83 329.59
No. 15 15 15 15 15 15 15 15 15 15 15 15
Normal 15 15 0 15 15 0 15 15 15 15 15 0
Abnormal 0 0 15 0 0 15 0 0 0 0 0 15
*
Tandem mass spectrometry.
Supplemental Table 8. Summary of the second trial of the 2015 external quality assessment for homocystinuria screening by detection of methionine (µ mol/L)
Variable Specimen NST15- 2-01
NST15- 2-02
NST15- 2-03
NST15- 2-04
NST15- 2-05
NST15- 2-06
NST15- 2-07
NST15- 2-08
NST15- 2-09
NST15- 2-10
NST15- 2-11
NST15- 2-12
MS/MS* Mean 13.34 165.65 15.35 14.86 184.55 14.83 13.35 16.86 12.83 12.80 257.86 16.39
SD 3.59 103.16 4.53 2.55 31.56 4.01 2.18 5.25 3.50 2.09 43.80 5.05
CV (%) 26.9 62.3 29.5 17.2 17.1 27.0 16.3 31.1 27.3 16.3 17.0 30.8
Median 12.04 130.29 16.20 14.14 173.69 12.98 13.30 15.78 12.83 13.42 255.51 15.50
Min 8.35 102.33 6.25 8.74 132.82 9.18 9.07 9.92 6.67 8.75 183.80 9.95
Max 21.66 519.20 23.54 20.11 242.31 22.58 17.75 28.21 18.93 15.69 333.65 28.55
No. 15 15 15 15 15 15 15 15 15 15 15 15
Normal 15 0 15 15 0 15 15 15 15 15 0 15
Abnormal 0 15 0 0 15 0 0 0 0 0 15 0
*
Tandem mass spectrometry.
Supplemental Table 9. Summary of the first trial of the 2015 external quality assessment for maple syrup urine disease screening by detection of leucine+isoleucine (µ mol/L)
Variable Specimen NST15- 1-01
NST15- 1-02
NST15- 1-03
NST15- 1-04
NST15- 1-05
NST15- 1-06
NST15- 1-07
NST15- 1-08
NST15- 1-09
NST15- 1-10
NST15- 1-11
NST15- 1-12 MS/MS* Mean 120.41 654.77 99.98 115.55 624.98 107.65 106.08 480.35 128.06 118.21 104.87 106.88
SD 10.05 91.29 16.84 16.74 94.65 20.23 16.92 75.26 19.08 20.21 18.27 14.86
CV (%) 8.3 13.9 16.8 14.5 15.1 18.8 15.9 15.7 14.9 17.1 17.4 13.9
Median 117.73 673.60 100.76 110.60 640.51 109.40 103.03 471.48 125.66 112.80 101.90 108.36
Min 102.34 513.69 70.69 93.64 471.82 67.74 76.25 372.57 97.55 86.40 76.83 78.52
Max 144.90 806.22 139.30 146.65 756.00 152.19 133.16 630.51 161.94 168.19 148.45 131.74
No. 15 15 15 15 15 15 15 15 15 15 15 15
Normal 15 0 15 15 0 15 15 1 15 15 15 15
Abnormal 0 15 0 0 15 0 0 14 0 0 0 0
*
Tandem mass spectrometry.
Supplemental Table 10. Summary of the second trial of the 2015 external quality assessment for maple syrup urine disease screening by detection of leucine+isoleucine (µ mol/L)
Variable Specimen NST15- 2-01
NST15- 2-02
NST15- 2-03
NST15- 2-04
NST15- 2-05
NST15- 2-06
NST15- 2-07
NST15- 2-08
NST15- 2-09
NST15- 2-10
NST15- 2-11
NST15- 2-12 MS/MS* Mean 594.86 100.32 111.74 579.91 100.61 106.51 486.01 122.31 109.79 107.56 103.91 111.89
SD 108.38 15.16 15.28 78.89 13.37 14.40 69.51 12.42 13.26 12.55 15.57 19.56
CV (%) 18.2 15.1 13.7 13.6 13.3 13.5 14.3 10.2 12.1 11.7 15.0 17.5
Median 613.60 96.65 109.59 570.59 101.23 105.88 497.26 124.00 111.48 107.28 110.80 112.93
Min 341.86 79.07 88.28 447.41 78.92 83.00 340.29 98.70 85.66 88.67 70.89 81.19
Max 744.26 127.08 143.51 719.00 126.15 132.00 609.00 137.58 128.00 132.54 120.00 143.80
No. 15 15 15 15 15 15 15 15 15 15 15 15
Normal 0 15 15 0 15 15 0 15 15 15 15 15
Abnormal 15 0 0 15 0 0 15 0 0 0 0 0
*
Tandem mass spectrometry.
Supplemental Table 11. Summary of the first trial of the 2015 external quality assessment for congenital hypothyroidism screening by detection of TSH (mIU/L)
Variable Specimen T4/TSH15 -1-01
T4/TSH15 -1-02
T4/TSH15 -1-03
T4/TSH15 -1-04
T4/TSH15 -1-05
T4/TSH15 -1-06
T4/TSH15 -1-07
T4/TSH15 -1-08
T4/TSH15 -1-09
T4/TSH15 -1-10
EIA* Mean 39.05 66.95 2.38 74.78 3.57 5.55 60.14 4.98 34.24 2.63
SD 15.92 22.13 2.16 24.29 0.19 4.03 7.55 1.95 4.33 0.81
CV (%) 40.8 33.1 90.8 32.5 5.4 72.6 12.6 39.2 12.6 30.7
Median 39.05 66.95 2.38 74.78 3.57 5.55 60.14 4.98 34.24 2.63
Min 27.79 51.30 0.85 57.60 3.43 2.70 54.80 3.60 31.18 2.06
Max 50.30 82.60 3.90 91.95 3.70 8.40 65.48 6.36 37.30 3.20
No. 2 2 2 2 2 2 2 2 2 2
Normal 0 0 2 0 2 2 0 2 0 2
Abnormal 2 2 0 2 0 0 2 0 2 0
FIA† Mean 32.41 42.73 0.85 45.02 1.00 0.77 44.97 0.71 34.50 1.03
SD 13.04 16.87 0.53 17.18 0.52 0.75 16.25 0.33 12.93 0.69
CV (%) 40.2 39.5 61.8 38.2 52.0 98.3 36.1 46.0 37.5 66.8
Median 26.75 35.15 0.65 37.15 0.83 0.55 36.70 0.60 29.00 0.80
Min 22.00 29.40 0.30 32.10 0.50 0.25 30.60 0.40 21.80 0.35
Max 56.00 77.30 2.10 75.40 2.20 2.90 75.90 1.50 60.10 2.90
No. 12 12 12 12 12 12 12 12 12 12
Normal 0 0 12 0 12 12 0 12 0 12
Abnormal 12 12 0 12 0 0 12 0 12 0
Others‡ Mean 35.8 47.9 1.6 43.7 2 2.2 41.6 1.4 32.2 2
SD CV (%) Median Min Max
No. 1 1 1 1 1 1 1 1 1 1
Normal 0 0 1 0 1 1 0 1 0 1
Abnormal 1 1 0 1 0 0 1 0 1 0
Abbreviation: TSH, thyroid-stimulating hormone.
*
Enzyme immunoassay using Bio-Rad reagents.
†Fluorometric immunoassay using Perkin-Elmer reagents.
‡
Electrochemiluminescent immunoassay using Roche reagents.
Supplemental Table 12. Summary of the second trial of the 2015 external quality assessment for congenital hypothyroidism screening by detection of TSH (mIU/L)
Variable Specimen T4/TSH15 -2-01
T4/TSH15 -2-02
T4/TSH15 -2-03
T4/TSH15 -2-04
T4/TSH15 -2-05
T4/TSH15 -2-06
T4/TSH15 -2-07
T4/TSH15 -2-08
T4/TSH15 -2-09
T4/TSH15 -2-10
EIA* Mean 44.59 49.95 3.60 2.81 33.20 3.70 6.25 31.18 4.72 16.38
SD 13.31 26.10 0.56 1.42 13.30 1.70 2.33 6.53 1.58 5.83
CV (%) 29.8 52.3 15.5 50.7 40.1 46.1 37.3 21.0 33.6 35.6
Median 44.59 49.95 3.60 2.81 33.20 3.70 6.25 31.18 4.72 16.38
Min 35.18 31.49 3.20 1.80 23.79 2.49 4.60 26.56 3.60 12.25
Max 54.00 68.40 3.99 3.81 42.60 4.90 7.89 35.80 5.84 20.50
No. 2 2 2 2 2 2 2 2 2 2
Normal 0 0 2 2 0 2 2 0 2 0
Abnormal 2 2 0 0 2 0 0 2 0 2
FIA† Mean 44.94 59.41 0.92 0.63 34.99 1.08 0.74 31.88 1.21 18.55
SD 17.20 24.95 0.41 0.41 13.90 0.66 0.37 13.66 0.58 9.58
CV (%) 38.3 42.0 44.2 64.5 39.7 61.5 50.8 42.8 47.6 51.7
Median 37.96 47.95 0.80 0.52 28.20 0.83 0.69 26.16 0.97 14.00
Min 28.30 35.30 0.56 0.20 24.10 0.47 0.30 21.40 0.65 12.00
Max 81.30 116.00 2.00 1.70 63.50 2.60 1.60 62.90 2.50 41.60
No. 12 12 12 12 12 12 12 12 12 12
Normal 0 0 12 12 0 12 12 0 12 0
Abnormal 12 12 0 0 12 0 0 12 0 12
Others‡ Mean 44.2 52.6 1.9 1.4 29.6 1.7 1.5 30.9 2 16.2
SD CV (%) Median Min Max
No. 1 1 1 1 1 1 1 1 1 1
Normal 0 0 1 1 0 1 1 0 1 0
Abnormal 1 1 0 0 1 0 0 1 0 1
Abbreviation: TSH, thyroid-stimulating hormone.
*
Enzyme immunoassay using Bio-Rad reagents.
†Fluorometric immunoassay using Perkin-Elmer reagents.
‡
Electrochemiluminescent immunoassay using Roche reagents.
Supplemental Table 13. Summary of the first trial of the 2015 external quality assessment for congenital hypothyroidism screening by detection of total T4 (μg/dL)
Variable Specimen T4/TSH15 -1-01
T4/TSH15 -1-02
T4/TSH15 -1-03
T4/TSH15 -1-04
T4/TSH15 -1-05
T4/TSH15 -1-06
T4/TSH15 -1-07
T4/TSH15 -1-08
T4/TSH15 -1-09
T4/TSH15 -1-10
FIA* Mean 6.16 0.83 10.85 0.79 15.78 1.36 0.81 7.82 0.72 15.41
SD 2.23 0.50 3.90 0.26 5.47 0.55 0.47 2.53 0.32 5.55
CV (%) 36.1 60.3 36.0 33.4 34.7 40.2 58.7 32.3 43.8 36.0
Median 6.70 0.69 12.30 0.75 18.55 1.23 0.55 8.46 0.67 18.50
Min 3.30 0.37 5.70 0.50 8.30 0.80 0.43 4.70 0.30 7.60
Max 8.50 1.80 15.60 1.20 20.90 2.30 1.70 10.60 1.30 20.50
No. 8 8 8 8 8 8 8 8 8 8
Normal 8 0 8 0 8 0 0 8 0 8
Abnormal 0 8 0 8 0 8 8 0 8 0
*
Fluorometric immunoassay using Perkin-Elmer reagents.
Supplemental Table 14. Summary of the second trial of the 2015 external quality assessment for congenital hypothyroidism screening by detection of total T4 (μg/dL)
Variable Specimen T4/TSH15 -2-01
T4/TSH15 -2-02
T4/TSH15 -2-03
T4/TSH15 -2-04
T4/TSH15 -2-05
T4/TSH15 -2-06
T4/TSH15 -2-07
T4/TSH15 -2-08
T4/TSH15 -2-09
T4/TSH15 -2-10
FIA* Mean 0.91 1.14 14.58 7.45 0.84 6.03 9.80 6.62 16.68 0.45
SD 0.37 0.47 5.49 2.52 0.37 2.25 3.62 11.14 6.19 0.27
CV (%) 40.9 40.8 37.7 33.8 43.7 37.3 37.0 168.2 37.1 59.3
Median 0.70 1.00 13.70 8.10 0.80 6.90 10.90 3.40 16.40 0.30
Min 0.53 0.69 7.98 4.42 0.38 3.14 5.66 1.60 9.87 0.22
Max 1.50 2.10 22.80 10.70 1.30 8.70 16.10 36.20 27.60 1.00
No. 9 9 9 9 9 9 9 9 9 9
Normal 0 0 9 9 0 9 9 3 9 0
Abnormal 9 9 0 0 9 0 0 6 0 9
*
Fluorometric immunoassay using Perkin-Elmer reagents.
Supplemental Table 15. Summary of the first trial of the 2015 external quality assessment for congenital hypothyroidism screening by detection of free T4 (ng/dL)
Variable Specimen T4/TSH15 -1-01
T4/TSH15 -1-02
T4/TSH15 -1-03
T4/TSH15 -1-04
T4/TSH15 -1-05
T4/TSH15 -1-06
T4/TSH15 -1-07
T4/TSH15 -1-08
T4/TSH15 -1-09
T4/TSH15 -1-10
EIA* Mean 1.12 0.80 3.98 0.80 5.69 0.32 0.84 3.55 0.65 5.76
SD 0.07 0.09 0.39 0.09 0.88 0.08 0.13 1.32 0.09 0.96
CV (%) 5.9 10.8 9.9 11.7 15.4 26.5 15.9 37.2 13.4 16.7
Median 1.11 0.81 4.15 0.80 5.72 0.33 0.82 4.11 0.69 6.01
Min 1.04 0.70 3.40 0.70 4.60 0.20 0.70 1.58 0.52 4.40
Max 1.20 0.90 4.23 0.90 6.73 0.40 1.00 4.40 0.70 6.61
No. 4 4 4 4 4 4 4 4 4 4
Normal 4 2 4 2 4 0 2 4 0 0
Abnormal 0 2 0 2 0 4 2 0 4 0
ECA† Mean 1.10 0.95 3.65 0.70 4.80 0.35 1.00 3.10 0.70 5.00
SD 0.14 0.21 1.20 0.00 1.13 0.21 0.00 0.14 0.00 1.98
CV (%) 12.9 22.3 32.9 0.0 23.6 60.6 0.0 4.6 0.0 39.6
Median 1.10 0.95 3.65 0.70 4.80 0.35 1.00 3.10 0.70 5.00
Min 1.00 0.80 2.80 0.70 4.00 0.20 1.00 3.00 0.70 3.60
Max 1.20 1.10 4.50 0.70 5.60 0.50 1.00 3.20 0.70 6.40
No. 2 2 2 2 2 2 2 2 2 2
Normal 2 2 2 0 2 0 2 2 0 2
Abnormal 0 0 0 2 0 2 0 0 2 0
*
Enzyme immunoassay using Bio-Rad reagents.
†Enzyme colourimetric assay using Bio-Rad reagents.
Supplemental Table 16. Summary of the second trial of 2015 external quality assessment for congenital hypothyroidism screening by detection of free T4 (ng/dL)
Variable Specimen T4/TSH15 -2-01
T4/TSH15 -2-02
T4/TSH15 -2-03
T4/TSH15 -2-04
T4/TSH15 -2-05
T4/TSH15 -2-06
T4/TSH15 -2-07
T4/TSH15 -2-08
T4/TSH15 -2-09
T4/TSH15 -2-10
EIA* Mean 0.83 0.88 5.58 3.07 0.75 1.59 3.80 1.14 8.71 0.14
SD 0.12 0.20 0.51 0.14 0.05 0.20 0.35 0.12 2.04 0.05
CV (%) 14.2 23.3 9.1 4.6 6.7 12.7 9.1 10.1 23.4 38.5
Median 0.85 0.80 5.70 3.08 0.75 1.55 3.85 1.16 9.01 0.12
Min 0.67 0.73 4.90 2.90 0.70 1.40 3.40 1.00 6.30 0.10
Max 0.93 1.18 6.03 3.20 0.80 1.87 4.10 1.25 10.50 0.21
No. 4 4 4 4 4 4 4 4 4 4
Normal 3 3 4 4 1 4 4 4 3 0
Abnormal 1 1 0 0 3 0 0 0 1 4
ECA† Mean 0.9 0.9 5.2 3.2 0.9 1.7 4.1 1.3 7.7 0.3
SD CV (%) Median Min Max
No. 1 1 1 1 1 1 1 1 1 1
Normal 1 1 1 1 1 1 1 1 1 0
Abnormal 0 0 0 0 0 0 0 0 0 1
*
Enzyme immunoassay using Bio-Rad reagents.
†Enzyme colourimetric assay using Bio-Rad reagents.
Supplemental Table 17. Summary of the two 2015 external quality assessment trials for analysis of urinary methylmalonic acid (mg/L)
Variable Specimen MMA15-1-01 MMA15-1-02 MMA15-1-03 MMA15-2-01 MMA15-2-02 MMA15-2-03
Methylmalonic acid Mean 1.05 4.29 1.05 3.12 5.82 10.86
SD 0.04 0.61 0.04 0.17 0.55 0.63
CV (%) 4.2 14.3 3.6 5.6 9.4 5.8
Median 1.05 3.97 1.06 3.11 5.65 10.79
Min 1.00 3.80 1.00 2.95 5.40 10.30
Max 1.11 5.30 1.10 3.32 6.59 11.56
No. 4 4 4 4 4 4
Supplemental Table 18. Summary of the two 2015 external quality assessment trials for analysis of urinary vanillylmandelic acid (mg/L)
Variable Specimen VMA15-1-01 VMA15-1-02 VMA15-1-03 VMA15-2-01 VMA15-2-02 VMA15-2-03
Vanillylmandelic acid Mean 4.84 36.55 13.56 4.97 12.13 39.35
SD 0.29 1.86 1.40 0.37 0.63 2.32
CV (%) 6.0 5.1 10.4 7.5 5.2 5.9
Median 4.80 37.51 13.30 5.01 12.12 39.60
Min 4.45 33.30 11.90 4.17 11.40 35.25
Max 5.28 38.50 16.09 5.28 12.99 42.92
No. 7 7 7 7 7 7
Supplemental Table 19. Summary of the first trial of the 2015 external quality assessment for analysis of organic acids (mmol/molCr)
Specimen Compound Expected value Institute 1 Institute 2 Institute 3 Institute 4
Organic acids (2015-1-01)
3-Hydroxypropionic acid
112 62.6 83.8 98.6 64.6
Methylmalonic acid 150 122.2 203.9 143.6 106.7
Diagnosis Methylmalonic
aciduria
Methylmalonic aciduria
Methylmalonic aciduria
Methylmalonic aciduria
Methylmalonic aciduria
Organic acids (2015-1-02)
- - - -
Diagnosis Normal Normal Normal Normal Normal
Supplemental Table 20. Summary of the second trial of the 2015 external quality assessment for analysis of organic acids (mmol/molCr)
Specimen Compound Institute 1 Institute 2 Institute 3
Organic acids (2015-2-01) - - - -
Diagnosis Normal Normal Normal
Organic acids (2015-2-02) 2-Hydroxyisovaleric acid 70 57.5 38.1
2-Keto-3-methylvaleric acid 33
2-Ketoisocaproic acid 41
Diagnosis MSUD MSUD MSUD
MSUD, maple syrup urine disease.
Supplemental Table 21. Summary of the first trial of the 2015 external quality assessment for analysis of amino acids (μmol/L)
Variable
Amino acids 2015-1-01 Amino acids 2015-1-02
Institute 1
Institute 2
Institute 3
Institute 4
Institute 5
Institute 6
Institute 1
Institute 2
Institute 3
Institute 4
Institute 5
Institute 6
Alanine 448 429 421 357 328 426 555 427 518 414 436 504
β-Alanine 4 6 0 4 6 4 7 0 4
Anserine 0 0 0 0 0 0 0 0
α-Aminoadipic acid 0 1 0 1 2 2 0 2
α-Amino-n-butyric acid 16 17 12 16 24 18 21 15 21 49
γ-Aminobutyric acid 0 0 0 0 0 0 0 0
β-Aminoisobutyric acid 0 0 0 1 3 0 0 5
Arginine 2,471 3,041 2,665 2,494 1,347 3,026 82 83 79 63 70 97
Asparagine 36 40 32 37 34 69 64 56 62 54
Aspartic acid 14 11 16 13 19 18 9 2 8 6 9 13
Carnosine 0 0 0 0 0 0 0 0
Citrulline 23 24 24 19 24 14 67 60 61 52 80 66
Cystathionine 1 0 0 0 9 1 0 1
Cystine 1 42 2 0 0 28 46 12 9 11 14
Ethanolamine 37 8 0 2 36 7 0 3
Glutamic acid 161 156 173 192 214 191 513 69 495 482 457 547
Glutamine 293 353 297 252 300 639 85 711 95 84 49 82
Glycine 170 199 205 173 182 195 340 241 253 211 247 250
Histidine 49 77 74 67 77 78 100 89 85 79 90 91
Homocysteine 10 0 0 0 0 15 0 0 0 0
Hydroxylysine 2 0 0 0 1 0 0 0
Hydroxyproline 7 11 0 11 26 42 21 43 45
Isoleucine 59 63 66 53 62 63 97 85 94 68 90 84
Leucine 149 190 183 172 186 150 149 159 162 135 166 125
Lysine 151 156 159 130 176 170 222 225 227 183 233 244
Methionine 34 85 35 30 36 36 28 74 35 23 34 32
1-Methylhistidine 9 6 10 9 5 3 5 6
3-Methylhistidine 3 5 0 4 9 14 0 11 10
Ornithine 72 86 83 71 89 85 200 178 180 145 171 196
Phenylalanine 71 82 79 73 91 86 70 80 81 69 93 89
Phosphoethanolamine 0 0 0 0 2 7 0 0
Phosphoserine 3 2 0 0 2 2 0 0
Proline 264 213 227 204 201 233 234 220 222 184 198 214
Sarcosine 1 0 0 1 10 0 0 14
Serine 106 94 98 87 98 93 168 131 159 119 158 141
Taurine 30 37 38 32 108 28 207 75 161 144 78 111
Threonine 120 117 107 112 118 113 157 133 133 121 153 138
Tryptophan 51 44 46 46 48 60 45 49 41 63
Tyrosine 66 60 55 52 59 59 83 70 66 60 73 72
Valine 172 211 230 185 192 209 280 316 342 257 293 307
Diagnosis Hyperar
gininemi a
Hyperar gininem ia
Hyperar gininem ia
Hyperar gininem ia
Hyperar gininem ia
Hyperar gininem ia
* * * * * *
*
Not decisive.
Supplemental Table 22. Summary of the second trial of the 2015 external quality assessment for analysis of amino acids (μmol/L)
Variable
Amino acids 2015-2-01 Amino acids 2015-2-02
Institute 1 Institute 2 Institute 3 Institute 4 Institute 5 Institute 1 Institute 2 Institute 3 Institute 4 Institute 5
Alanine 452 530 464.7 381.2 475.7 1,101 1,055 1,071.0 785.0 1,027.3
β-Alanine 7 0.0 4.5 8.4 6 0.0 4.3 19.6
Anserine 0 0.0 ND 0 0.0 ND
α-Aminoadipic acid 1 0.0 0.8 6.0 1 0.0 1.0 4.8
α-Amino-n-butyric acid
24 17.8 18.4 28.0 22 20.1 18.5 20
γ-Aminobutyric acid 0 0.0 0.2 0 0.0 0.3
β-Aminoisobutyric acid
38 0.0 31.4 37.8 39 0.0 29.8 33.1
Arginine 81 79 69.9 70.4 80.8 74 75 66.4 69.3 75.3
Asparagine 67 69 88.1 62.1 61 65 76.6 58.8
Aspartic acid 7 6 7.1 6.5 11.7 6 5 8.7 6.6 12
Carnosine 0 0.0 ND 0 0.0 ND
Citrulline 66 69 69.3 51.7 60.0 57 63 63.5 54.2 62
Cystathionine 0 0.0 0.5 0 0.0 0.5
Cystine 25 13.6 14.4 14.6 45 35.4 37.9 46.7
Ethanolamine 9 0.0 2.2 9 0.0 1.5
Glutamic acid 252 123 174.9 159.0 158.7 107 66 97.1 81.4 59.1
Glutamine 583 664 527.4 473.8 370.8 729 737 606.4 557.4 458.9
Glycine 333 294 302.4 311.5 315.8 271 284 296.7 283.1 290.9
Histidine 107 101 92.3 91.7 99.6 93 88 85.1 91.3 92.3
Homocysteine 0 0.0 ND 0 0.0 ND
Hydroxylysine 0 0.0 ND 0 0.0 ND
Hydroxyproline 37 0.0 29.1 28.7 36 12.6 26.9 27.4
Isoleucine 80 77 81.3 69.3 80.6 71 77 59.7 67.4 74.2
Leucine 132 138 135.2 137.1 139.4 117 129 125.6 130.7 128.2
Lysine 223 212 198.8 198.8 120.3 150 246 186.4 208.0 110.9
Methionine 39 29 23.4 36.6 31.9 36 27 30.0 35.5 29.7
1-Methylhistidine 11 8.8 12.2 9 6.2 10.9
3-Methylhistidine 8 0.0 9.3 9.1 8 0.0 8.8 8
Ornithine 114 159 133.0 125.9 153.5 117 120 124.4 133.6 139.9
Phenylalanine 70 74 69.9 83.1 84.9 73 72 73.2 82.9 79.4
Phosphoethanolamine 4 27.0 ND 4 3.3 ND
Phosphoserine 2 0.0 ND 67.1 2 0.0 ND 70
Proline 184 202 148.9 174.1 192.0 158 200 156.3 165.9 172.2
Sarcosine 0 0.0 1.9 33.1 0 0.0 2.4 24.9
Serine 134 166 137.6 140.3 148.1 105 145 126.9 129.0 136.8
Taurine 129 97 87.4 66.6 63.3 250 93 83.7 59.1 60.5
Threonine 178 150 169.5 166.8 175.6 158 146 160.5 158.5 162.3
Tryptophan 43 41 56.6 45.8 25.0 44 40 46.2 45.4 20
Tyrosine 56 64 64.8 73.3 79.3 260 307 311.6 249.1 320.4
Valine 264 279 241.9 206.3 250.2 255 258 226.8 204.7 230.5
Diagnosis Normal* Normal Normal Normal HHH
syndrome
Liver dys- function/tyr osinemia
Tyrosinemi a
Tyrosinemi a
Tyrosinemi a
Tyrosinemi a
Abbreviations: ND, not detected; HHH syndrome, hyperornithinaemia-hyperammonaemia-homocitrullinuria syndrome.
*