ⓒ2009 The Korean Nutrition Society and the Korean Society of Community Nutrition
Cadmium increases ferroportin-1 gene expression in J774 macrophage cells via the production of reactive oxygen species*
Bo-yeon Park and Jayong Chung §
Department of Food and Nutrition and Research Institute of Science for Human Life, Kyung Hee University, 1 Hoegi-dong, Dongdaemun-gu, Seoul 130-701, Korea
Received July 16, 2009; Revised August 25, 2009; Accepted August 28, 2009
Abstract
Cadmium intoxication has been associated with the dysregulation of iron homeostasis. In the present study, we investigated the effect of cadmium on the expression of ferroportin 1 (FPN1), an important iron transporter protein that is involved in iron release from macrophages. When we incubated cadmium with J774 mouse macrophage cells, FPN1 mRNA levels were significantly increased in a dose- and time-dependent manner. Furthermore, the cadmium-induced FPN1 mRNA expression was associated with increased levels of FPN1 protein. On the other hand, cadmium-mediated FPN1 mRNA induction in J774 cells was completely blocked when cells were co-treated with a transcription inhibitor, acitomycin D. Also, cadmium directly stimulated the activity of the FPN1-promoter driven luciferase reporter, suggesting that the cadmium up-regulates FPN1 gene expression in a transcription-dependent manner. Finally, cadmium exposure to J774 macrophages increased intracellular reactive oxygen species (ROS) levels by ~ 2-fold, compared to untreated controls. When J774 cells were co-treated with antioxidant N-acetylcystein, the cadmium-induced FPN1 mRNA induction was significantly attenuated. In summary, the results of this study clearly demonstrated that cadmium increased FPN1 expression in macrophages through a mechanism that involves ROS production, and suggests another important interaction between iron and cadmium metabolism.
Key Words: Iron, cadmium, ferroportin 1, macrophages
* Supported by Korea Research Foundation Grant funded by the Korean Government (MOEHRD) (KRF-2004-204-C00091).
§
Corresponding Author: Jayong Chung, Tel. 82-2-961-0977, Fax. 82-2-968-0260, Email. [email protected]
Introduction
Cadmium is a well-known toxic metal widely distributed in the environment. Cadmium compounds are present in various products such as plastic stabilizers, color pigment, several alloys, certain batteries, and phosphate fertilizers (Järup, 2003).
Cadmium intoxication in the general population can occur through cigarette smoking, habitual intake of contaminated food or water and by inhalation of polluted air (WHO, 2000). Each cigarette contains approximately 1~2 ug of cadmium, with 40-60% of that being absorbed through the lungs directly into the systemic circulation (ATSDR, 2003). The major contaminated sources of dietary cadmium are fish, liver, grains, leafy vegetables, potatoes, and other root vegetables. Once absorbed, cadmium has a long biological half-life of 10 to 30 years and its excretion from the body is extremely low (Satarug et al., 2003). Therefore, it accumulates in various tissues such as kidneys, lung, liver, bone, testis and placenta (Djukic-Cosic et al., 2008). Studies have shown that chronic cadmium exposure even at low levels leads to a variety of illness including kidney dysfunction, osteoporosis, early onset of diabetic renal complications, hypertension, and increased cancer risk (Järup et al., 1998;
Staessen et al., 1996). The metal and its compounds are in fact
classified as group 1 carcinogens for humans (IARC, 1993).
Studies on cadmium toxicity have revealed diverse cellular targets for the deleterious action of this toxic metal. Among them, growing evidence has accumulated that cadmium perturbs the homeostasis of essential metals, especially iron. For example, the production of erythropoietin, an important regulator of iron metabolism in the body, is markedly decreased in cadmium poisoned kidneys (Horiguchi, 2007; Schafer et al., 1990).
Furthermore, other important steps of iron homeostasis, such as iron absorption from the diet, contribute to cadmium toxicity.
In the case of iron deficiency, production of divalent metal transporter 1 (DMT1), an iron importer that is located in the apical membrane of enterocytes, is significantly increased (Gunshin et al., 1997). Interestingly, the induction of DMT1 was shown to be associated with increased cadmium burden in mice fed an iron-deficient diet (Ryu et al., 2004). DMT1 can transport several other divalent metal ions in addition to iron, including cadmium (Bressler et al., 2004). Therefore, investigations on the role of cadmium in the regulation of iron transporters would be useful to better understand the interactions between iron and cadmium metabolism.
Macrophages play a key role in maintaining body iron
homeostasis. Especially, macrophages of reticuloendothelial
system, such as Kupffer cells in the liver and macrophages of spleen and bone marrow, provide most of the iron required for erythropoiesis by recycling iron from senescent erythrocytes (Weiss, 2002). Iron recycling by macrophages represents the largest pathway of intracellular iron export into the blood system (Ganz & Nemeth, 2006). Ferroportin-1 (FPN1/MTP1/SLC40A1) is a transmembrane transporter protein that plays a key role in the export of iron (Abboud & Haile, 2000; Donovan et al., 2000;
McKie et al., 2000). Several mutations in the human FPN1 gene were unequivocally associated with iron accumulation within macrophages, suggesting a critical role of FPN1 in the release of iron from macrophages. Some divalent metals, such as iron and copper, have been shown to affect the level of FPN1 gene expression in vivo and in vitro (Chung et al., 2004; Knutson et al., 2003). It has not yet been determined whether environmentally toxic metals like cadmium can influence FPN1 expression. In the present study, we examined the effects of cadmium on the regulation of FPN1 gene expression in J774 macrophage cells.
Materials and Methods
Cell cultures and treatment
J774 mouse macrophage cells were cultured in α-minimum essential medium (α-MEM) supplemented with 10% fetal bovine serum and antibiotics. Before treatments, cells were seeded in a 6-well plate and grown to 60~80% confluence. Stock solutions of CdCl
2, actinomycin D, and N-acetylcystein (NAC) were prepared in PBS (pH 7.4) and sterilized by filtration with 0.2 μ m membrane.
RT-PCR analysis
Total RNA was isolated from the treated cell with Trizol
®reagent (Invitrogen, USA). Reverse transcription was carried out with l μg RNA samples by using Reverse transcription master premix (ELPIS biotech, Korea) at 42℃ for 60 min followed by inactivation of reverse transcriptase at 94℃ for 5 min. RT-PCR was performed on MJ mini gradient thermal cycler (Bio-Rad, USA). RT-PCR conditions were 95℃ for 30s, 65℃ for 30s, 72℃
for 1 min with a final extension at 72℃ for 10 min. The primer sets were FPN1 (forward) TTGCAGGAGTCATTGCTGCTA, (reverse) TGGAGTTCTGCACACCATTGAT; β-actin (forward) CTGGCACCACACCTTCTA, (reverse) GGGCACAGTTGGGT GAC (Xenotech, Korea). PCR products were separated on a 2%
agarose gel containing ethidium bromide and bands were analyzed with Gel Doc XR system (Bio-Rad, USA) and Quantity on 1-D analysis software (Bio-Rad, USA). For each experiments, the relative abundance value obtained by densitometric analysis was normalized to the value derived from the control sequence (β-actin) in the corresponding sample.
Luciferase reporter assay
FPN1 promoter/luciferase reporter gene construct (FPN1-Luc, a gift from Dr. Haile, University of Texas at San Antonio, USA) was used for this experiment. The FPN1-Luc plasmid consists of ~2.6 kb of FPN1 5΄ promoter region, all of the 5΄-untranslated region (5΄-UTR) including IRE, and firefly luciferase coding sequence. Empty vector that contains firefly luciferase coding sequence only was used as a negative control. For transient transfection, HeLa cells were seeded at 2.7 x 10
5cells in a 6-well plate and grown to ~60% confluence. FPN1-Luc plasmid was transiently transfected into HeLa cells using PolyFect
®transfection reagent (QIAGEN, USA) according to manufacturer’s manual. At 12-h after transfection, cells were washed and divided, and then treated with various concentrations of CdCl
2for 8 h. After metal treatments, cell lysates were prepared using 1x lysis buffer. Luciferase activity was measured with a luminometer using a luciferase reporter assay system (Promega, USA).
Western blot analysis
After cadmium treatment, cells were washed three times with PBS and lysed in a lysis buffer containing 4x Tris/SDS (pH 6.8), 5% β-mercaptoethanol, and protease inhibitor cocktails. After DNA shearing, protein concentrations of lysates were determined by RC DC Protein assay (Bio-Rad, USA). Fifteen micrograms of cell lysates were separated by SDS/polyacrylamide gel electrophoresis, and transferred to PVDF membranes. The membranes were stained with Ponceau-S solution to visualize and confirm that equal amounts of protein were transferred among wells. After rinsing Ponceau-S solution, the membranes were blocked with 5% skim milk in Tris-buffered saline (TBS) containing 0.01% Tween 20 for at least 1~2 hour. Blocked membrane was incubated with affinity purified anti-FPN1 antibody (1:100) overnight at 4℃. The membrane was then washed with TBS-T for 30 min and incubated with secondary anti-rabbit IgG peroxidase-linked antibody (Amersham, USA, 1:5,000) in 2.5% skim milk/TBS-T for at least 1 hour at room temperature. Specific bands were visualized with an enhanced chemiluminescence system (ELPIS biotech, Korea). Intensities of the bands were quantified using a Gel Doc XR system (Bio-Rad, USA) equipped with Quantity one 1-D analysis software (Bio-Rad, USA).
Determination of intracellular ROS production
Intracellular ROS was detected by the oxidation-sensitive
fluorescent probe dye, 2’,7’-dichlorodihydrofluorescein diacetate
(H
2DCFDA) (Invitrogen Molecular Probes, OR, USA). This dye
is a stable nonpolar compound which diffuses readily into the
cells. Intracellular ROS in the presence of peroxidase changes
this dye to the highly fluorescent compound DCF. Thus, the
Cell viability (% of control)
CdCl2(μM)
* *
*
*
0 20 40 60 80 100 120
0 5 10 25 50 100
8hr 12hr 20hr
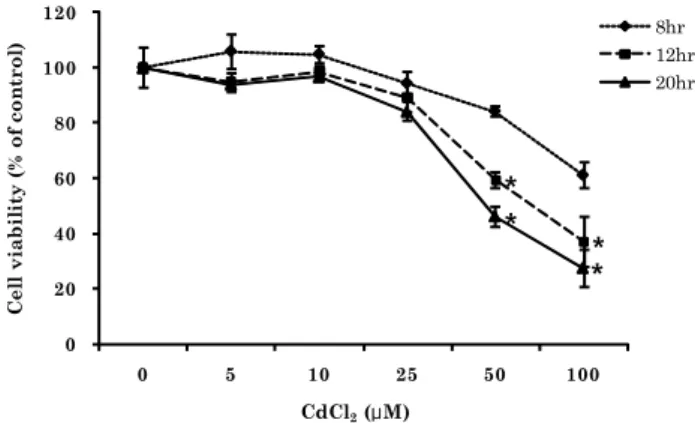
Fig. 1. Effects of cadmium treatment on the viability of J774 macrophage cells.
J774 cells were treated with CdCl
2with indicated concentrations and time. The cell viability was measured by MTT assay as described in Methods and Materials. Data shown are mean ± SD (n=6). * P < 0.05 vs. untreated controls
0.0 0.5 1.0 1.5 2.0 2.5 3.0 3.5 4.0
0 5 10 25
FPN1 / β-actinmRNA (Fold induction)
CdCl2(μM) CdCl2(µM)
FPN1 β-actin 0 5 10 25
* *
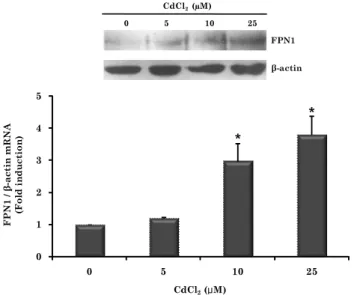
Fig. 2. Effects of cadmium treatment with various concentrations on FPN1 mRNA levels in J774 cells. J774 cells were incubated with the indicated concentrations of CdCl
2for 8 h. Total RNA were prepared and analyzed for FPN1 or β-actin mRNA by RT-PCR analyses. Data shown are representative agarose gels ( upper panel ) or means ± SD of three independent experiments ( lower panel ).
* P < 0.05 vs. untreated controls
fluorescent intensity is proportional to the amount of peroxides which are produced by the cells. Following exposure to cadmium for 2 hours, the cells were collected and washed with ice-cold PBS. We then added 1 ml of PBS containing 10 μM DCFH-DA, and incubated the cells for 30 min at 37℃. The fluorescence emission from DCF was analyzed via FACSscan flow cytometry (Becton-Dickinson, CA, USA).
Measurements of glutathione
The concentration of glutathione (GSH and GSSG) in cellular lysates was determined according to the methods of Rahman et al. (2006). Briefly, washed cells were lysed by repeatedly freezing and thawing using lysis buffer containing 0.6% (w/v) sulfosalicylic acid, 0.15 (v/v) Triton X-100, 5 mM EDTA in 0.1M potassium phosphate buffer, pH 7.5. The supernatant was collected after centrifugation and incubated with 0.2 mg/ml dithiobisnitrobenzoic acid (DTNB) and 1.67 U/ml glutathione reductase in phosphate buffer-EDTA for 30 s, then 0.2 mg/ml β -NADPH was added and the rate of DTNB reduction was spectrophotometrically measured at 405 nm. GSH content was calculated using a standard curve, and expressed as nmol/mg protein. For GSSG measurements, the cell supernatants were first mixed with 2-vinylpyridine and incubated at room temperature for 1 h. After incubation, triethanolamine was added and GSH assay were repeated.
Statistical analysis
All experiments were repeated three or four times on separate occasions. Statistical analysis was performed by using the SAS systems (ver. 9.1). Differences between groups were tested by ANOVA followed by Duncan’s multiple comparison test. All data were expressed as mean ± SD. P values less than 0.05 were considered significant.
Results
Effects of cadmium on FPN1 mRNA and protein levels in J774 macrophages
To determine cadmium treatment conditions that are non-toxic to J774 cells, we first evaluated the effects of cadmium treatment at various doses and time on the viability of macrophage cells in culture using the MTT assay. J774 macrophage cells (5×10
4/well, 96 well-plates) were treated with CdCl
2at indicated concentrations for 8, 12 or 20 hours, and incubated with MTT reagent for 4 hours. As shown in Fig. 1, there was a significant loss of viability when the concentrations of CdCl
2was equal to or higher than 50 μM, where the number of viable cells was 60% and 46% of the control after 12 and 20 hours of exposure, respectively. 100 μM CdCl
2further decreased the viable cell
numbers to 37% and 27% of the controls after 12- and 20- hour treatment, respectively. On the other hand, incubation of J774 cells with CdCl
2at concentrations of 5 to 25 μM for 8 hours had no significant effect on cell viability. Accordingly, cells were treated with CdCl
2at a concentration lower than 25 μM for shorter than 8 hours in all subsequent experiments to ensure the treatment was noncytotoxic.
To examine whether cadmium affects FPN1 mRNA levels, J774 cells were incubated with different concentrations of CdCl
2(5~25 μM) for 8 hours and total RNAs were extracted for
RT-PCR analyses. The results of this analysis showed that
cadmium induced FPN1 mRNA expression in a dose-dependent
manner. As shown in Fig. 2, the induction of FPN1 mRNA was
evident at 5 μM and increased linearly upon incubation with
0 2 4 6 8 10 12
0 1 2 3 4 5 6 7 8
FPN1 / β-actinmRNA (Fold induction)
Time (hr)
* *
CdCl2 (hour)
FPN1 β-actin
0 1 2 4 8
Fig. 3. Effects of cadmium treatment with various incubation time on FPN1 mRNA levels in J774 cells. J774 cells were incubated with 25 μM CdCl
2for the indicated time. Total RNA were prepared and analyzed for FPN1 or β-actin mRNA by RT-PCR analyses. Data shown are representative agarose gels ( upper panel ) or means ± SD of three independent experiments ( lower panel ). * P < 0.05 vs. untreated controls
CdCl2(μM) 0
1 2 3 4 5
0 5 10 25
FPN1 / β-actinmRNA (Fold induction)
*
*
CdCl2(µM) 0 5 10 25
β-actin FPN1
Fig. 4. Effects of cadmium treatment on FPN1 protein levels in J774 cells. J774 cells were incubated with 0, 5, 10, or 25 μM CdSO
4for 8 h. Whole cell lysates were prepared and analyzed for FPN1 protein by Western blot. Upper panel : representative blot, Lower panel : band density detected by chemiluminescence was quantified (QuantityOne imaging software, Bio-Rad). Values are mean ± SD of three independent experiments. * P < 0.05 vs. untreated controls
0 1 2 3 4
1 2 3 4 CdCl225 µM
▬
+
▬+
▬ ▬
+ +
Actinomycin D (0.5㎍/㎖)FPN1 / β-actinmRNA (Fold induction)
*
FPN1 β-actin
Fig. 5. Effects of cadmium and actinomycin D on FPN1 mRNA levels in J774 cells. J774 cells were treated with 25 μM CdCl
2for 4 h in the presence or absence of 0.5 μg/ml actinomycin D. Total RNAs were prepared and analyzed for FPN1 or β-actin mRNA by RT-PCR. Upper panel : representative agarose gels, Lower panel : band intensity detected by ethidium bromide-staining was quantified (QuantityOne imaging software, Bio-Rad). Values are mean ± SD of three independent experiments. * P < 0.05 vs. untreated controls
0 50 100 150 200 250 300
0 5 10 25
300
100
0 250 200 150
50 Luciferaseactivity / ㎍cell protein (% of control)
0 5 10 25
CdCl2(μM)