Hepatitis C Virus Regulates Transforming Growth Factor 1 Production Through the Generation of Reactive Oxygen Species in a Nuclear Factor
B–Dependent Manner
WENYU LIN, WEI–LUN TSAI, RUN–XUAN SHAO, GUOYANG WU, LEE F. PENG, LYDIA L. BARLOW, WOO JIN CHUNG, LEILIANG ZHANG, HONG ZHAO, JAE–YOUNG JANG, and RAYMOND T. CHUNG
Gastrointestinal Unit, Department of Medicine, Massachusetts General Hospital, Harvard Medical School, Boston, Massachusetts
BACKGROUND & AIMS: The generation of oxidative stress and transforming growth factor 1 (TGF-1) pro- duction play important roles in liver fibrogenesis. We have previously shown that hepatitis C virus (HCV) in- creases hepatocyte TGF-1 expression. However, the mechanisms by which this induction occurs have not been well studied. We explored the possibility that HCV infection regulates TGF-1 expression through the gen- eration of reactive oxygen species (ROS), which act through ⱖ1 of the p38 mitogen-activated protein kinase (MAPK), extracellular signal-regulated kinase (ERK), c- Jun N-terminal kinase (JNK), and nuclear factor B (NFB) signaling pathways to induce TGF-1 expression.
METHODS: We used small molecule inhibitors and short interfering RNAs to knock down these pathways to study the mechanism by which HCV regulates TGF-1 production in the infectious JFH1 model. RESULTS: We demonstrated that HCV induces ROS and TGF-1 ex- pression. We further found that JFH1 induces the phos- phorylation of p38MAPK, JNK, ERK, and NF B. We also found that HCV-mediated TGF-1 enhancement occurs through a ROS-induced and p38 MAPK, JNK, ERK1/2, NFB-dependent pathway. CONCLUSIONS: These findings provide further evidence to support the hy- pothesis that HCV enhances hepatic fibrosis progres- sion through the generation of ROS and induction of TGF-1. Strategies to limit the viral induction of oxidative stress appear to be warranted to inhibit fibrogenesis.
Keywords: Hepatitis C Virus; Reactive Oxygen Species;
Nuclear Factor B; Transforming Growth Factor 1.
H epatitis C virus (HCV) infects approximately 170 million people and is a leading cause of chronic liver disease worldwide.1,2It is a major cause of cirrhosis, a significant cause of hepatocellular carcinoma and is the leading reason for liver transplantation worldwide.
Transforming growth factor beta 1 (TGF-1) is a regu- latory cytokine with multifunctional effects on cell bio- logical processes, including liver fibrogenesis. TGF-1 is the most potent profibrogenic cytokine, accelerating liver fibrosis by triggering the proliferation and transforma-
tion of hepatic stellate cells (HSCs) in HCV-infected per- sons.
It has been reported that HCV infection is associated with a significant increase in TGF-1 expression in both serum and liver.
3Adenovirus-encoded HCV core and NS3-NS5 protein expression has been shown to increase the secretion of TGF- 1 production.
4HCV infection has also been shown to increase hepatocyte TGF-1 expres- sion in cell culture models, including HCV replicon cells and JFH1 cells.
5,6However, the mechanisms by which HCV increases TGF-1 expression have not been well studied. HCV core and HCV subgenomic replicons have each been shown to increase reactive oxygen species (ROS) production in HCV expression and replicon mod- els.
4,7–10ROS may in turn induce HSC proliferation and TGF-1 expression. ROS have also been shown to medi- ate TGF- 1–induced cellular responses,
11thereby likely playing an important role in the development of liver fibrosis associated with HCV infection.
12HCV core, E2, and HCV subgenomic replicons, have been shown to increase phosphorylation of p38 mitogen-activated pro- tein kinase (p38 MAPK), extracellular signal-regulated kinase (ERK), and activates nuclear factor B (NFB).
13,14However, most of this understanding was acquired with the use of the HCV replicon system or HCV protein expression model.
15It is still unclear how HCV infection effects ROS production and NFB activation in cells that produce infectious HCV particles. Moreover, the mecha- nism by which HCV infection affects ROS production and subsequently TGF-1 expression is still not charac-
Abbreviations used in this paper: AQ, 6-amino-4-(4-phenoxyphenyl-
ethylamino) quinazoline; DMSO, dimethyl sulfoxide; DPI, diphenyliodo- nium; ECL, electrochemiluminescence; ERK, extracellular signal-regu- lated kinase; FBS, fetal bovine serum; GAPDH, glyceraldehyde-3- phosphate dehydrogenase; HCV, hepatitis C virus; HSC, hepatic stellate cell; JNK, c-Jun N-terminal kinase; LY, LY 294002; Neg, nega- tive; NF B, nuclear factor B; p38 MAPK, p38 mitogen-activated protein kinase; PCR, polymerase chain reaction; PI3K, phosphoinosi- tol-3 kinase; ROS, reactive oxygen species; SB, SB 203580; siRNA, short interfering RNA; SP, SP600125; TGF- 1, transforming growth factor beta 1.
©
2010 by the AGA Institute 0016-5085/$36.00 doi:10.1053/j.gastro.2010.03.008
BASIC–LIVER, PANCREAS,AND BILIARYTRACT
terized. We hypothesized that HCV increases TGF-1 expression through induction of ROS and activation of the p38 MAPK, c-Jun N-terminal kinase (JNK), ERK, and NFB pathway. We tested this hypothesis with the use of the infectious JFH1 culture model.
16Materials and Methods Cell Cultures
Huh7.5.1 cells (human hepatocellular carcinoma)
17and HCV JFH1-infected Huh7.5.1 cells
16were grown in Dulbecco’s Modified Eagle’s Medium supplemented with 10% fetal bovine serum (FBS) medium. The JFH1-infected cells used in this study were analyzed between day 6 and 20 after infection.
ROS Measurements and Cell Viability Assay ROS levels were measured as previously described.
7,8,18Briefly, Huh7.5.1 cells or JFH1 cells were seeded in 100
L of 10% FBS Dulbecco’s Modified Eagle’s Medium in 96-well clear-bottom white assay plate (Corning Incorpo- rated, Corning, NY) (10,000 cell/well) overnight (14 hours). The cells were washed with phosphate-buffered saline (PBS) and then incubated with 10 mol/L carboxy derivative of fluorescein (Invitrogen, Carlsbad, CA) in warm PBS for 1 hour according to the manufacturer’s protocol. The treated cells were washed with PBS and then resuspended in 10% FBS. ROSs were assessed by measured fluorescence with a BioTek Synergy 2 Micro- plate Reader (Winooski, VT) at an excitation of 485 nm and an emission of 528 nm. Cell viability was monitored with the use of Cell Titer-Glo Luminescent Cell Viability Assay (Promega, Madison, WI). ROS level was normalized by cell viability to calculate the ROS/cell viability arbitrary unit. ROS green fluorescent images were visualized with the use of an Olympus fluorescent microscope (Olympus Amer- ica Inc, Center Valley, PA; excitation, 488 nm; emission, 505–530 nm), and the images were taken with Intelligent Imaging Innovation Slide Book (Intelligent Imaging Inno- vations, Inc, Philadelphia, PA) software.
Immunofluorescence Analysis
To monitor the cell infectivity in the JFH1-in- fected cell population, we performed HCV core immuno- fluorescence staining in uninfected and JFH1-infected Huh7.5.1 cells (day 6 infection). Huh7.5.1 or JFH1 cells were fixed with 4% paraformaldehyde, permeabilized with 0.5% TritonX-100, and blocked with 3% bovine serum albumin in PBS. The primary antibody was mouse anti- HCV core (ViroGen Co, Watertown, MA). The secondary antibody was goat anti–mouse Alexa Fluor 488 (Invitro- gen). TO-PRO-3 iodide (642/661) (Invitrogen) was added to the staining to monitor nuclear structure. Immuno- fluorescence was observed with the use of the Nikon Eclipse 800 microscopy with the Bio-Rad Radiance 2000 confocal fluorescence microscope system (Bio-Rad Labo- ratories, Hercules, CA).
Reagents
To explore the possible pathways of HCV replica- tion on ROS and TGF-1 up-regulation, Huh7.5.1 cells or JFH1cells were incubated with several pathway inhib- itors, including diphenyliodonium (DPI; ROS inhibitor), SB 203580 (SB; p38 MAPK inhibitor), SP600125 (SP; JNK inhibitor), U0126 (ERK1/2 inhibitor), LY 294002 (LY;
phosphoinositol-3 kinase [PI3K] inhibitor), or AQ, 6-ami- no-4-(4-phenoxyphenylethylamino) quinazoline (NFB activation inhibitor). The inhibitors were purchased from EMD Chemicals, Inc, Gibbstown, NJ. The inhibitor stock solution was dissolved in 1% dimethyl sulfoxide (DMSO).
The cells were incubated with different inhibitors at a final concentration of 20 mol/L for 14 hours; 1% DMSO was used as a negative control.
Real-Time Polymerase Chain Reaction
Total cellular RNA was harvested with the use of the QIA shredder kit and RNeasy kit (QIAGEN, Valencia, CA) according to the manufacturer’s protocol. Total cDNA was synthesized by reverse transcription with the GeneAmp RNA PCR (polymerase chain reaction) Kit (Ap- plied Biosystems, Branchburg, NJ). TGF-1 and glyceral- dehyde-3-phosphate dehydrogenase (GAPDH) mRNA levels were quantified by real-time PCR. Human TGF-1 (GeneBank no. NM_000660) was measured with the fol- lowing primers: sense primer, GGC CAG ATC CTG TCC AAG C; antisense primer, GTG GGT TTC CAC CAT TAG CAC. Human GAPDH (GeneBank no. BC026907; GAPDH sense primer, ACA GTC CAT GCC ATC ACT GCC;
GAPDH antisense primer, GCC TGC TTC ACC ACC TTC TTG) was used as a control for basal RNA levels.
TGF-1 and GAPDH levels were quantified by real-time PCR with the use of the Bio-Rad IQ5 (Bio-Rad Labora- tories) and Finnzymes SYBR green I dye (New England Biolabs, Ipswich, MA) for detection as previously de- scribed.
19TGF- 1 Enzyme-Linked Immunoabsorbent Assay
TGF- 1 cytokine levels in supernatants were mea- sured with the Quantikine Human TGF-1 enzyme- linked immunoabsorbent assay kit (R&D Systems, Min- neapolis, MN).
Protein Sample Preparation
At the time of harvest, cells were washed with PBS, and whole cell protein samples were extracted with ra- dioimmunoprecipitation assay buffer (0.5% Nonidet p-40, 10 mmol/L Tris, pH 7.4, 150 mmol/L NaCl, 1%
sodium dodecyl sulfate) with a protease inhibitor cock- tail (Sigma Life Science and Biochemicals, St Louis, MO).
Whole protein lysates were sonicated, boiled at 95°C for 5 minutes, and chilled on ice for 5 minutes before West- ern blot assay.
BASIC–LIVER,PANCREAS,ANDBILIARYTRACT
Western Blot
Western blot was performed as previously re- ported.
19,20Protein (20 g/well) was separated by so- dium dodecyl sulfate–polyacrylamide gel electrophoresis with precast NuPAGE Novex 4%–12% Bis-Tris gradient gels (Invitrogen, Carlsbad, CA) and transferred to polyvi- nylidene fluoride membranes. The primary antibodies used for the Western blots included phosphorylated and unphosphorylated p38 MAPK, JNK, ERK1/2, PI3K, and NFB (p65) (Cell Signaling Technology, Inc, Danvers, MA); mouse anti-HCV NS5A (ViroGen Co, Watertown, MA); mouse anti-HCV core (Affinity BioReagents Inc, Golden, CO), and mouse antiactin (Sigma Life Science and Biochemicals). The secondary antibodies included horseradish peroxidase– conjugated electrochemilumines- cence (ECL) donkey anti–rabbit immunoglobulin G, or horseradish peroxidase– conjugated ECL sheep anti–
mouse immunoglobulin G (Amersham Biosciences, Pis- cataway, NJ). The ECL Western Blotting Detection Kit (Amersham Biosciences) was used to detect chemilumi- nescent signals.
Luciferase Reporter Assay
To assess the effect of JFH1 HCV infection on NFB signaling, Huh7.5.1 cells or JFH1-infected Huh7.5.1 cells were cotransfected with an NFB promoter construct ex- pressing firefly (pNFB-Luc; Stratagene, La Jolla, CA) and construct pRL-TK expressing Renilla luciferase. FuGene HD Transfection Reagent (Roche Diagnostics, Indianapolis, IN)
was used for plasmid transfection. Dual-luciferase assay (Promega, Madison, WI) was assessed for luciferase activity.
Relative luciferase activity (RLA) was normalized by dividing the firefly luciferase value by the Renilla luciferase value.
Short Interfering RNA and Transfection To further determine the specific molecular path- ways of HCV replication on ROS production and TGF-1 expression, we performed RNAi to knock down several pathway genes expression. The short interfering RNAs (siRNAs) were transfected into cells with the HiPer-Fect Transfection Reagent (QIAGEN). The siRNAs used for gene knock-down were as follows: SignalSilence p38 MAPK siRNA, SignalSilence p44/42 ERK siRNA, Signal- Silence NFB p65 siRNA (Cell Signaling Technology, Inc), On-Target SMARTpool JNK1 siRNA, On-Target SMARTpool PI3K siRNA (Dharmacon, Inc, Lafayette, CO). QIAGEN AllStars Neg (negative) siRNA (QIAGEN) was used as a negative control for siRNA transfection.
The protein expression of each knockdown gene was confirmed by Western blot.
Statistics
Data analysis was carried out with the use of a 2-tailed Student’s It test with pooled variance. Data are expressed as mean ⫾ SD of at least 4 sample replicates, unless stated otherwise. In the figures, * denotes P ⬍ .05,
**P ⬍ .01, and
#P ⬍ .001.
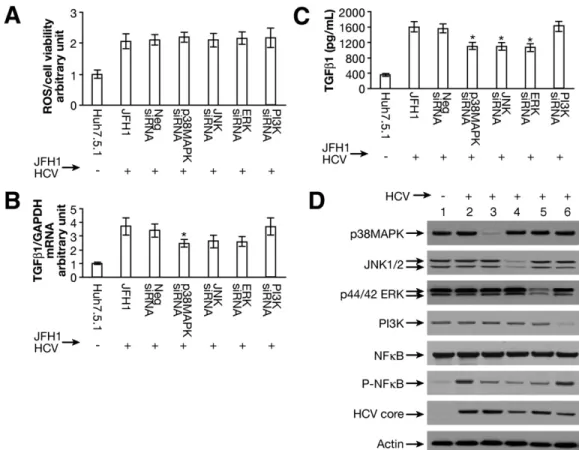
Figure 1. HCV increases TGF- 1 mRNA and ROS production in JFH1-infected Huh7.5.1 cells. (A) JFH1 HCV induces ROS production. ROS level was normalized by cell viability to calculate the ROS/cell viability arbitrary unit (n ⫽ 4; P ⫽ .001). (B) JFH1 increased ROS fluorescence. ROS fluorescent images in Huh7.5.1 and JFH1 live cells. (C) JFH1 HCV increases TGF- 1 expression. TGF-1 level was normalized to GAPDH level to calculate the TGF- 1/GAPDH arbitrary unit (n ⫽ 4; P ⫽ .007). (D) Western blot for HCV NS5A and HCV core. HCV NS5A, HCV core, and actin proteins levels were detected by Western blots.
BASIC–LIVER, PANCREAS,AND BILIARYTRACT
Results
HCV Increases TGF- 1 mRNA and ROS Production in JFH1 Cells
We first examined whether HCV infection has an effect on ROS production in JFH1 cells. We found a
⬎2-fold increase of ROS production in JFH1 cells com- pared with Huh7.5.1 cells (Figure 1A; P ⫽ .001). To visualize ROS activity in Huh7.5.1 cells and JFH1 cells, fluorescent images of the cells were obtained. We con- firmed that live cells infected with JFH1 HCV contained higher levels of ROS than uninfected Huh7.5.1 cells (Fig- ure 1B). We found that HCV infection enhances TGF-1 expression in a previous report.
5In this study, we con- firmed again that HCV increases TGF-1 expression by
⬎3-fold in JFH1 cells compared with Huh7.5.1 cells (Fig- ure 1C; P ⫽ .007). Western blot for HCV NS5A and HCV core confirmed expression of viral proteins in JFH1 cells (Figure 1D). With the use of fluorescent microscopy, we found that there ⱖ95% of the cells were infected with JFH1 (Supplementary Figure 1).
HCV Up-regulation of TGF- 1 Expression Is ROS Dependent
To determine whether HCV induction of TGF- 1 expression is linked to ROSs, we used DPI, a blocker of ROS formation. We found that DPI completely blocked not only HCV-induced ROS production but also abro- gated TGF- 1 enhancement ( Figure 2A and B).
HCV-Induced Oxidative Stress Regulates TGF- 1 Expression Through p38 MAPK, JNK, and ERK
We then asked how ROSs regulates TGF- 1 ex- pression. Because ROSs are possible upstream signaling molecules to the cellular kinases p38 MAPK, JNK, and ERK, we examined the interactions of ROS generation with these proteins in JFH1 cells. We monitored ROS production and TGF- 1 expression in Huh7.5.1 cells or JFH1 cells treated with several different pathway inhibi- tors. The p38 MAPK inhibitor SB, JNK inhibitor SP, or ERK inhibitor U0126 had no effect on HCV-induced ROS production (Figure 2A), but they partially blocked
Figure 2. The ROS inhibitor DPI blocks HCV up-regulation of TGF- 1. The inhibitors used included DPI, SB, SP, U0126, or LY; 1% DMSO was used as a negative control. (A) DPI blocked JFH1 HCV-mediated ROS generation. ROS level was normalized by cell viability to calculate the ROS/cell viability arbitrary unit. DPI completely blocked the HCV-induced ROS production compared with JFH1 in DMSO (P ⬍ .001; n ⫽ 4). (B) DPI inhibited JFH1 HCV-mediated TGF- 1 expression. TGF-1 level was normalized to GAPDH level to calculate the TGF-1/GAPDH arbitrary unit. DPI completely blocked the HCV- stimulated TGF- 1 expression (P ⫽ .002). SB, SP, or U0126 partially reduced TGF-1 production by 29.5% (P ⫽ .08), 32.2% (P ⫽ .07), and 27.5% (P ⫽ .1), respectively, compared with JFH1 in DMSO (n ⫽ 4). In contrast, LY had no effect on TGF-1 expression. (C) The ROS inhibitor DPI blocked phosphorylation of p38 MAPK, JNK, ERK. JFH1 HCV activated the phosphorylation of p38 MAPK, p42 ERK, and JNK (lane 2). ROS inhibitor DPI blocks phosphorylation of p38 MAPK, JNK, ERK to levels comparable to those seen with their specific inhibitors (lane 3). Antibody to PI3K was directed against unphosphorylated protein. We found that HCV does not activate PI3K phosphorylation (data not shown). Lane 1, Huh7.5.1 ⫹ DMSO; lane 2, JFH1 ⫹ DMSO; lane 3, JFH1 ⫹ DPI; lane 4, JFH1 ⫹ SB; lane 5, JFH1 ⫹ SP; lane 6, JFH1 ⫹ U0126; lane 7, JFH1 ⫹ LY.
BASIC–LIVER,PANCREAS,ANDBILIARYTRACT
TGF-1 expression in JFH1 cells (Figure 2B). In contrast, the PI3K inhibitor LY had no effect on HCV-mediated enhancement of TGF- 1 or ROS production ( Figure 2A and B). Western blotting showed that JFH1 induces the phosphorylation of p38 MAPK, JNK1/2, and p44/42 ERK (Figure 2C). Furthermore, the ROS inhibitor DPI blocked phosphorylation of p38 MAPK, JNK, and ERK to levels comparable to those seen with their specific inhibitors (Figure 2C). These data therefore suggest that p38 MAPK, JNK, and ERK lie downstream of ROS.
These results also indicate that HCV stimulates ROS generation, which in turn induces phosphorylation of p38 MAPK, JNK1/2, and p44/42 ERK. These interme- diates ultimately contribute to the up regulation of TGF- 1 expression.
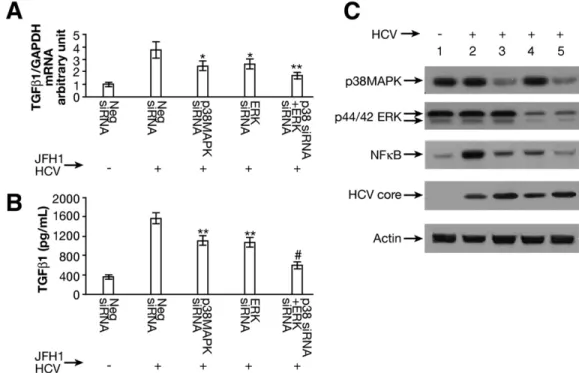
HCV-Induced TGF 1 Expression Is Partially Blocked by siRNA of p38 MAPK, JNK, or ERK
To further test the specific effects of HCV repli- cation on ROS production and TGF-1 expression path- ways, we performed siRNA-mediated knockdowns of p38 MAPK, JNK, ERK, or PI3K. We then assessed ROS pro- duction and TGF-1 expression in these cells. We found that siRNA knockdown of p38 MAPK, JNK, ERK, or PI3K had no effect on ROS production in JFH1 cells (Figure 3A). However, we found that TGF-1 mRNA expression was partially reduced by p38 MAPK, JNK, or ERK siRNA knockdown (Figure 3B). In contrast, PI3K siRNA had no effect on TGF-1 expression (Figure 3B). Data from en- zyme-linked immunoabsorbent assay showed that the
Figure 3. Effects of siRNA to p38 MAPK, JNK, ERK, or PI3K on ROS production and TGF- 1 expression. (A) siRNAs to p38 MAPK, JNK, ERK, or PI3K do not effect JFH1 HCV-stimulated ROS production. JFH1 cell increased ROS production by ⬎2-fold compared with Huh7.5.1 cell.
However, siRNAs to p38 MAPK, JNK, ERK, PI3K had no effect on ROS production in JFH1-infected cells. (B) siRNAs to p38 MAPK, JNK, ERK partially reduced JFH1 HCV-activated TGF- 1 mRNA expression. HCV infection enhanced TGF-1 expression by ⬎3-fold in JFH1 cells compared with Huh7.5.1 cells. The siRNA to p38 MAPK, JNK, or ERK partially inhibited TGF 1 mRNA expression enhancement in JFH1 cells by 45.9% (P ⫽ .035), 40.8% (P ⫽ .070), and 41.4% (P ⫽ .056), respectively, compared with TGF-1 mRNA in Neg siRNA in JFH1 (n ⫽ 4). In contrast, PI3K or Neg siRNA had no effect on TGF 1 expression in JFH1 cells. (C) siRNAs to p38 MAPK, JNK, ERK significantly inhibited JFH1 HCV-activated TGF- 1 cytokines. TGF-1 levels in supernatants were measured according to “Materials and Methods.” siRNA to p38 MAPK, JNK, or ERK each significantly reduced TGF- 1 cytokine levels to 1105 ⫾ 88 pg/mL (P ⫽ .015), 1102 ⫾ 95 pg/mL (P ⫽ .016), and 1073 ⫾ 105 pg/mL (P ⫽ .016), respectively, compared with TGF-1 levels in the presence of Neg siRNA in JFH1-infected cells (1571 ⫾ 111 pg/mL;
n ⫽ 4). (D) siRNA to p38 MAPK, ERK, or JNK reduced HCV-mediated NFB phosphorylation. siRNA to p38 MAPK, JNK, ERK, or PI3K knocked down the correspondent protein expression. siRNAs to p38 MAPK, JNK, ERK reduced HCV-mediated NF B activation. In contrast, PI3K siRNA has no effect on NF B phosphorylation. Lane 1, Huh7.5.1; lane 2, JFH1 ⫹ Neg siRNA; lane 3, JFH1 ⫹ p38 MAPK siRNA; lane 4, JFH1 ⫹ JNK siRNA; lane 5, JFH1 ⫹ ERK siRNA; lane 6, JFH1 ⫹ PI3K siRNA.
BASIC–LIVER, PANCREAS,AND BILIARYTRACT
knockdown of p38 MAPK, JNK, or ERK significantly reduced TGF-1 cytokine protein levels to 1105 ⫾ 88 pg/mL, 1102 ⫾ 95 pg/mL, and 1073 ⫾ 105 pg/mL, respectively, compared with Neg siRNA in JFH1 cells (1571 ⫾ 111 pg/mL; Figure 3C). We confirmed successful knockdown of p38 MAPK, JNK, ERK, or PI3K via West- ern blotting (Figure 3D). These data further show that HCV activated ROS production and subsequently in- creased TGF-1 mRNA and protein expression through the p38 MAPK, JNK, and ERK pathways.
Combination of siRNA to p38MAPK and ERK Cooperatively Reduces TGF- 1 Production
To assess the effect of both p38 MAPK and ERK on TGF- 1 expression in JFH1 cells, we performed siRNA to knock down both p38MAPK and ERK. We found that the combination of siRNAs to p38MAPK and ERK additively reduced TGF- 1 mRNA expression ( Figure 4A). TGF-1 levels in supernatants were significantly lower in the combination siRNAs to p38 MAPK and ERK (596 ⫾ 73 pg/mL) compared with Neg siRNA in JFH1 cells (1571 ⫾ 111 pg/mL; Figure 4B). Western blot con- firmed the knockdown of p38 MAPK and ERK proteins (Figure 4C). We also found a cooperative reduction of
NFB phosphorylation with the combination of siRNA to p38 MAPK and ERK (Figure 4C).
Inhibition of ROSs Blocks HCV-Activated NF- B Signaling
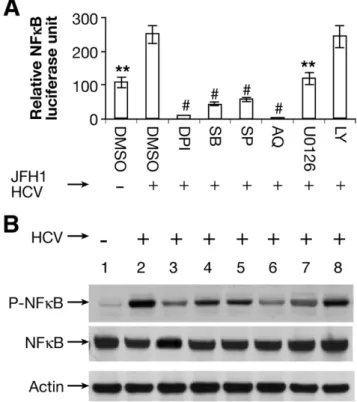
To assess the possibility that HCV-mediated up- regulation of TGF- 1 occurs through the NF-B path- way, we monitored NF- B promoter-driven luciferase ac- tivity in uninfected Huh7.5.1 or JFH1-infected cells treated with different pathway inhibitors. We found that JFH1 activated NF B signaling ( Figure 5A). The ROS inhibitor DPI completely abrogated NF B signaling to a level comparable to that observed with the NF B inhib- itor AQ. We found that SB, SP, and U0126 also reduced NF B signaling by 82.9%, 76.7%, and 52.1%, respectively.
In contrast, LY did not affect NF B signaling ( Figure 5A).
These data indicate that ROS-induced NF B signaling proceeds through p38 MAPK, JNK, and ERK. Western blotting showed that JFH1 activated NF B phosphoryla- tion and that DPI inhibited JFH1-driven NF B phos- phorylation to a comparable degree to the NF B inhib- itor AQ. In parallel with the functional expression data, SB, SP, or U0126 also partially reduced JFH1-induced NF- B phosphorylation. In contrast, LY had no effect on NF- B phosphorylation ( Figure 5B). It is possible that
Figure 4. The combination of siRNA to p38 MAPK and ERK further reduced TGF- 1 production. (A) The combination of siRNA to p38 MAPK and siRNA to ERK cooperatively reduced TGF- 1 mRNA expression. TGF-1 mRNA expression in JFH1-infected cells was partially inhibited by siRNAs to p38 MAPK (P ⫽ .031) or ERK (P ⫽ .046) compared with Neg siRNA. The combination of siRNA to p38MAPK and siRNA to ERK additively reduced TGF- 1 mRNA expression in JFH1 cells (P ⬍ .001). (B) The combination of siRNAs to p38MAPK and ERK significantly inhibited JFH1 HCV-activated TGF- 1 cytokines. TGF-1 levels in supernatants were measured with the human TGF-1 enzyme-linked immunoabsorbent assay kit. The combination of siRNAs to p38MAPK and ERK significantly inhibited TGF- 1 cytokine production (596 ⫾ 73 pg/mL; P ⬍ .001) compared with Neg siRNA in JFH1 cells (1571 ⫾ 111 pg/mL; n ⫽ 4). (C) The combination of siRNA to p38 MAPK and siRNA to ERK further inhibited HCV-mediated NF- B phosphorylation. Western blot confirmed that siRNA to p38 MAPK or ERK knocked down the corresponding protein expression. The combination of siRNA to p38 MAPK and ERK further reduced HCV-mediated NF B activation. Lane 1, Huh7.5.1 ⫹ Neg siRNA; lane 2, JFH1 ⫹ Neg siRNA; lane 3, JFH1 ⫹ p38 MAPK siRNA; lane 4, JFH1 ⫹ ERK siRNA; lane 5, JFH1 ⫹ p38 MAPK siRNA ⫹ ERK siRNA.
BASIC–LIVER,PANCREAS,ANDBILIARYTRACT
NFB-luciferase reporter induction is more sensitive to DPI than is formation of phospho-NFB, which corre- lates more strongly with TGF-1 expression. In either event, the observation of a strong correlation between NFB induction and TGF-1 supports NFB regulation of TGF-1.
HCV-Induced TGF- 1 Expression Is Abrogated by NF B siRNA
To show that NFB participates in HCV-mediated enhancement of TGF-1 expression, we performed siRNA-mediated knockdown of NFB. We found that JFH1 HCV-mediated enhancement of TGF-1 expression was blocked by NFB-specific siRNA but not by a nega- tive control siRNA (Figure 6A). We also confirmed that
NFB siRNA significantly inhibited JFH1 HCV-activated TGF-1 cytokine protein production (Figure 6B). These data confirm that HCV-mediated enhancement of TGF-1 depended on NFB activation. However, we found that HCV-mediated ROS production was not inhibited by NFB siRNA (Figure6C), indicating that ROS production was independent of NF-B activation. We also found that JFH1-activated NFB signaling was inhibited by NFB siRNA but not by a negative control siRNA (Figure 6D).
Western blotting confirmed that NFB protein expres- sion was knocked down by NFB siRNA but not by a negative control siRNA (Figure 6E).
Discussion
HCV infection can lead to liver fibrosis, cirrhosis, and hepatocellular carcinoma through multiple mecha- nisms. HCV-induced TGF-1 production appears to play a key role in the development of hepatic fibrosis. TGF-1 is the most potent known profibrogenic factor. However, the molecular mechanism by which HCV induces TGF-1 is not well characterized. It has been hypothesized that oxida- tive stress could contribute to the development of liver fibrosis by inducing the overproduction of TGF-1 and angiotensin II.
21,22Using an infectious cell culture model of HCV, we demonstrate for the first time that HCV induces TGF-1 through the generation of ROSs. Our data further indi- cate that ROSs induce TGF-1 through the activation of p38 MAPK, JNK, and ERK pathways, which in turn stim- ulate NFB phosphorylation. The activated NFB subse- quently induces TGF-1 expression. Our data provide new insights into a direct mechanism of liver fibrogenesis by HCV infection through the induction of ROSs, NFB, and TGF-1.
It has been previously shown that HCV can induce ROS production in HCV core, NS3, and NS5 protein expression models and in HCV replicon models.
4,6 – 8HCV core expression has also been shown to induce the acti- vation of JNK, p38 MAPK, and ERK pathways in the regulation of TGF-2 and vascular endothelial growth factor proteins.
23HCV infection has also been linked to endoplasmic reticulum stress, which is associated with ROS production in chronically infected patients.
15ROSs can induce the proliferation of HSCs and release of TGF-1. ROSs have also been shown to mediate TGF-
1–induced cellular responses in renal cells.
11This prob- ably plays an important role in the development of liver fibrosis associated with the HCV infection.
12ROS-medi- ated activation of the p38 MAPK, JNK, ERK, and NFB pathways have been reported in multiple in vitro and in vivo models. It has been shown that ROSs are required to activate p38/Smad3 signaling and the release of active and latent TGF-1 in stromal cells.
24Elevation of ROSs has also been reported to induce phosphorylation of p38 MAPK in hematopoietic stem cells.
25ROSs have also been shown to increase TGF-1 expression in rat HSCs through
Figure 5. Effects of ROS inhibitor on NF- B signaling pathway. An NF B promoter construct expressing firefly (pNFB-Luc) and the con- trol construct pRL-TK expressing Renilla luciferase were transfected into cells for 24 hours. The transfected Huh7.5.1 cells or JFH1 cells were incubated with 20 mol/L of different inhibitors for 14 hours. The inhibitors used included DPI, SB, SP, AQ, U0126, or LY; 1% DMSO was used as a negative control. Designations are the same in
Figure 5A and B. (A) DPI blocks HCV-activated NFB signaling. Relative luciferase activity was normalized by dividing the firefly luciferase value by the
Renilla luciferase value. HCV increased NFB promoter signaling by
⬎2-fold. DPI and AQ completely blocked NFB signaling. SB, SP, and U0126 reduced NF B signaling by 82.9%, 76.7%, and 52.1%, respec- tively. In contrast, LY had no effect on NF B signaling. (B) DPI blocked HCV-mediated NF B phosphorylation. HCV activated NFB phosphor- ylation in JFH1 cells compared with Huh7.5.1 cells. DPI and AQ blocked NF B phosphorylation. SB, SP, or U0126 partially reduced NFB phos- phorylation. In contrast, LY had no effect on NF B phosphorylation.
Lane 1, Huh7.5.1; lane 2, JFH1; lane 3, JFH1
⫹ DPI; lane 4, JFH1 ⫹ SB;
lane 5, JFH1
⫹ SP; lane 6, JFH1 ⫹ AQ; lane 7, JFH1 ⫹ U0126; lane 8, JFH1 ⫹ LY.
BASIC–LIVER, PANCREAS,AND BILIARYTRACT
activation of the MAPK pathway, including p38 MAPK, JNK, ERK, and NFB.
26,27Our study, unlike previous work, is the first systematic investigation of the mechanisms of HCV-induced ROS generation and TGF-1 production with the use of the JFH1 infectious HCV model.
16,17The finding that HCV directly induces profibrogenic cytokine release from hepatocytes in a ROS-dependent, p38 MAPK, JNK, and ERK– dependent manner is a novel one.
NFB is one of the main signal-transduction mole- cules activated in response to oxidant stress. Activation of NFB and its target genes is crucial for induction of immune responses and cell proliferation.
28,29It has been reported that the NF B pathway may regulate TGF-1 production during the resolution of inflammation in vivo; inhibition of NFB reduced TGF-1 expression in leukocytes.
30Our study now shows that ROS-induced
NF-B regulates TGF-1 expression in the HCV-infected hepatocyte.
It should be noted that TGF-1 is highly pleiotropic and could also produce beneficial effects on suppression of proliferative activity,
31,32so that not all effects of viral infection may be maladaptive. Nonetheless, the central role of TGF-1 in fibrogenesis makes its predominant effect profibrogenic. Although it has been reported that viral protein expression can inhibit TGF- reporter gene activity through a direct interaction between HCV core and Smad3,
31our data strongly support that in the context of whole viral infection there is strong induction of TGF- 1.
Our study provides new evidence, using an infectious tissue culture model, that HCV directly increases ROS and TGF-1 expressions. We propose a unique model in
Figure 6. Effects of NF B siRNA on ROS production and TGF-1 expression. The siRNAs were transfected into Huh7.5.1 cells or JFH1 cells in 96-well plate for 72 hours. The siRNAs used for gene knockdown included Neg siRNA, NF B siRNA#1, or NFB siRNA#2. ROS generation and TGF- 1 expression were assessed in these siRNA-transfected cells. (A) NFB siRNA reduced JFH1 HCV-activated TGF-1 mRNA expression.
TGF- 1 expression was assessed in these siRNA-transfected cells. HCV enhanced TGF-1 expression by ⬎3 fold in JFH1-infected cells compared with Huh7.5.1 cells. NF B-specific siRNA#1 or siRNA#2 inhibited enhancement of TGF-1 expression in JFH1 cells. (B) NFB siRNA significantly inhibited HCV-activated TGF- 1 cytokine production. TGF-1 cytokine levels in supernatants were measured by enzyme-linked immunoabsorbent assay. Both NF B-specific siRNA#1 and siRNA#2 significantly reduced JFH1-induced TGF-1 cytokine levels to 325 ⫾ 30 pg/mL (P ⬍ .001), and 440 ⫾ 48 pg/mL (P ⬍ .001), respectively, compared with Neg siRNA in JFH1-infected cells (1571 ⫾ 111 pg/mL; n ⫽ 4). (C) NFB siRNA had no effect on JFH1 HCV-stimulated ROS production. ROS generation was measured in these siRNA-transfected cells. HCV increased ROS production by
⬎2-fold in JFH1 cells. However, NFB siRNA#1 or siRNA#2 had no effect on ROS production in JFH1 cells. (D) NFB siRNA inhibited NFB signaling.
To monitor the effect of NF B siRNA on NFB signaling, at 48 hours after siRNA transfection, NFB promoter construct expressing firefly (pNF B-Luc) and construct pRL-TK expressing Renilla luciferase were transfected into these siRNA-transfected cells. Cell lysates were harvested for the luciferase assay after 24 hours of NF B promoter transfection. Firefly and Renilla dual-luciferase activity was measured. Relative luciferase activity was normalized by dividing the firefly luciferase value by the Renilla luciferase value. Both NF B siRNA#1 and siRNA#2 inhibited the HCV-mediated NF B signaling. (E) NFB siRNA knocked down NFB protein expression. NFB siRNA#1 or siRNA#2 knocked down the NFB protein expression.
Lane 1, Huh7.5.1
⫹ Neg siRNA; lane 2, JFH1 ⫹ Neg siRNA; lane 3, NFB siRNA#1, siRNA#4 NFB siRNA#2.
BASIC–LIVER,PANCREAS,ANDBILIARYTRACT
which HCV induces ROS generation, which in turn acti- vates the phosphorylation of p38 MAPK, JNK, and ERK.
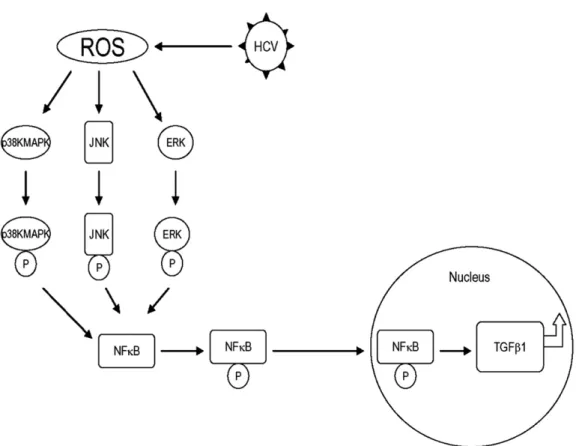
The phosphorylated p38 MAPK, JNK, and p42/44 ERK subsequently induces the phosphorylation of NFB. The activated NFB translocates to the nucleus, up-regulat- ing cytokine genes, including TGF-1 (Figure 7). We conclude that the HCV-mediated TGF-1 enhancement occurs through a ROS-induced and p38 MAPK, JNK, ERK1/2, NFB–dependent pathway. These results sup- port the hypothesis that HCV enhances hepatic fibrosis progression through the generation of ROSs and induc- tion of TGF-1. With the demonstration of a direct link between viral infection, generation of oxidative stress, and profibrogenic cytokine release, it would appear that strategies to limit the viral induction of oxidative stress are warranted to inhibit hepatic fibrosis.
Supplementary Material
Note: To access the supplementary material accompanying this article, visit the online version of Gastroenterology at www.gastrojournal.org, and at doi:
10.1053/j.gastro.2010.03.008.
References
1. Alter MJ. Epidemiology of viral hepatitis and HIV co-infection.
J Hepatol 2006;44(suppl):S6 –S9.
2. Lauer GM, Walker BD. Hepatitis C virus infection. N Engl J Med 2001;345:41–52.
3. Blackard JT, Kang M, Sherman KE, Koziel MJ, Peters MG, Chung RT. Effects of HCV treatment on cytokine expression during HCV/HIV coinfection. J Interferon Cytokine Res 2006;
26:834 – 838.
4. Bataller R, Paik YH, Lindquist JN, Lemasters JJ, Brenner DA.
Hepatitis C virus core and nonstructural proteins induce fibro- genic effects in hepatic stellate cells. Gastroenterology 2004;
126:529 –540.
5. Lin W, Weinberg EM, Tai AW, et al. HIV increases HCV replication in a TGF-beta1-dependent manner. Gastroenterology 2008;134:
803– 811.
6. Schulze-Krebs A, Preimel D, Popov Y, et al. Hepatitis C virus- replicating hepatocytes induce fibrogenic activation of hepatic stellate cells. Gastroenterology 2005;129:246 –258.
7. Otani K, Korenaga M, Beard MR, et al. Hepatitis C virus core protein, cytochrome P450 2E1, and alcohol produce combined mitochondrial injury and cytotoxicity in hepatoma cells. Gastroen- terology 2005;128:96 –107.
8. Miura K, Taura K, Kodama Y, Schnabl B, Brenner DA. Hepatitis C virus-induced oxidative stress suppresses hepcidin expression through increased histone deacetylase activity. Hepatology 2008;
48:1420 –1429.
9. Okuda M, Li K, Beard MR, et al. Mitochondrial injury, oxidative stress, and antioxidant gene expression are induced by hepatitis C virus core protein. Gastroenterology 2002;122:366 –375.
10. Machida K, Cheng KT, Lai CK, Jeng KS, Sung VM, Lai MM.
Hepatitis C virus triggers mitochondrial permeability transition with production of reactive oxygen species, leading to DNA dam- age and STAT3 activation. J Virol 2006;80:7199 –7207.
Figure 7. Schematic model of possible pathway that HCV increases TGF- 1 expression through generation of ROS and NFB activation. HCV infection induces ROS generation. ROSs activate the phosphorylation of p38 MAPK, JNK, and ERK. The phosphorylated p38 MAPK, JNK, and p42/44 MEK (MAP/ERK kinase) subsequently activate the phosphorylation of NF B. The activated NFB translocates to the nucleus to up-regulate large amounts of cytokine genes, including TGF- 1 production.
BASIC–LIVER, PANCREAS,AND BILIARYTRACT
11. Rhyu DY, Yang Y, Ha H, et al. Role of reactive oxygen species in TGF-beta1-induced mitogen-activated protein kinase activation and epithelial-mesenchymal transition in renal tubular epithelial cells. J Am Soc Nephrol 2005;16:667– 675.
12. Choi J, Ou JH. Mechanisms of liver injury, III: oxidative stress in the pathogenesis of hepatitis C virus. Am J Physiol Gastrointest Liver Physiol 2006;290:G847–G851.
13. Dolganiuc A, Oak S, Kodys K, et al. Hepatitis C core and non- structural 3 proteins trigger toll-like receptor 2-mediated path- ways and inflammatory activation. Gastroenterology 2004;127:
1513–1524.
14. Zhao LJ, Zhao P, Chen QL, Ren H, Pan W, Qi ZT. Mitogen- activated protein kinase signalling pathways triggered by the hepatitis C virus envelope protein E2: implications for the pre- vention of infection. Cell Prolif 2007;40:508 –521.
15. Tardif KD, Waris G, Siddiqui A. Hepatitis C virus, ER stress, and oxidative stress. Trends Microbiol 2005;13:159 –163.
16. Wakita T, Pietschmann T, Kato T, et al. Production of infectious hepatitis C virus in tissue culture from a cloned viral genome. Nat Med 2005;11:791–796.
17. Zhong J, Gastaminza P, Cheng G, et al. Robust hepatitis C virus infection in vitro. Proc Natl Acad Sci U S A 2005;102:9294 – 9299.
18. Zhu Z, Wilson AT, Mathahs MM, et al. Heme oxygenase-1 sup- presses hepatitis C virus replication and increases resistance of hepatocytes to oxidant injury. Hepatology 2008;48:1430 –1439.
19. Lin W, Choe WH, Hiasa Y, et al. Hepatitis C virus expression suppresses interferon signaling by degrading STAT1. Gastroen- terology 2005;128:1034 –1041.
20. Lin W, Kim SS, Yeung E, et al. Hepatitis C virus core protein blocks interferon signaling by interaction with the STAT1 SH2 domain. J Virol 2006;80:9226 –9235.
21. Bataller R, Brenner DA. Liver fibrosis. J Clin Invest 2005;115:
209 –218.
22. Urtasun R, Cubero FJ, Vera M, Nieto N. Reactive nitrogen species switch on early extracellular matrix remodeling via induction of MMP1 and TNFalpha. Gastroenterology 2009;136:1410 –1422, e1– 4.
23. Hassan M, Selimovic D, Ghozlan H, Abdel-kader O. Hepatitis C virus core protein triggers hepatic angiogenesis by a mechanism including multiple pathways. Hepatology 2009;49:1469 –1482.
24. Wang L, Clutter S, Benincosa J, Fortney J, Gibson LF. Activation of transforming growth factor-beta1/p38/Smad3 signaling in stro- mal cells requires reactive oxygen species-mediated MMP-2 ac- tivity during bone marrow damage. Stem Cells 2005;23:1122–
1134.
25. Ito K, Hirao A, Arai F, et al. Reactive oxygen species act through p38 MAPK to limit the lifespan of hematopoietic stem cells. Nat Med 2006;12:446 – 451.
26. Itagaki T, Shimizu I, Cheng X, et al. Opposing effects of oestradiol and progesterone on intracellular pathways and activation pro- cesses in the oxidative stress induced activation of cultured rat hepatic stellate cells. Gut 2005;54:1782–1789.
27. Popov Y, Patsenker E, Bauer M, Niedobitek E, Schulze-Krebs A, Schuppan D. Halofuginone induces matrix metalloproteinases in rat hepatic stellate cells via activation of p38 and NFkappaB.
J Biol Chem 2006;281:15090 –15098.
28. Fredericksen B, Akkaraju GR, Foy E, et al. Activation of the interferon-beta promoter during hepatitis C virus RNA replication.
Viral Immunol 2002;15:29 – 40.
29. Mehta S, Cox A, Hoover D, et al. Protection against persistence of hepatitis C. Lancet 2002;359:1478 –1483.
30. Lawrence T, Gilroy DW, Colville-Nash PR, Willoughby DA. Possible new role for NF-kappaB in the resolution of inflammation. Nat Med 2001;7:1291–1297.
31. Pavio N, Battaglia S, Boucreux D, et al. Hepatitis C virus core variants isolated from liver tumor but not from adjacent non- tumor tissue interact with Smad3 and inhibit the TGF-beta path- way. Oncogene 2005;24:6119 – 6132.
32. Battaglia S, Benzoubir N, Nobilet S, et al. Liver cancer-derived hepatitis C virus core proteins shift TGF-beta responses from tumor suppression to epithelial-mesenchymal transition. PLoS One 2009;4:e4355.
Received October 22, 2009. Accepted March 2, 2010.
Reprint requests
Address requests for reprints to: Raymond T. Chung, MD, Gastrointestinal Unit, Warren 1007, Massachusetts General Hospital, Boston, Massachusetts 02114. e-mail:
[email protected]; fax:(617) 643-0446.
Acknowledgments
The authors thank the following investigators and institutes for supplying the reagents: Dr Ralf Bartenschlager, University
Heidelberg, Germany; and Dr Takaji Wakita, Second Department of Virology, National Institute of Infectious Diseases, Tokyo, Japan (infectious HCV virus JFH1 DNA construct); and Dr Frank Chisari, Scripps Institute, CA (Hu7.5.1 cells).
W.L. and W.-L.T. contributed equally to this work.
Conflicts of interest
The authors disclose no conflicts.
Funding
This work was supported in part by NIH grants R01 AI069939 and U19 AI082630 (R.T.C.).
BASIC–LIVER,PANCREAS,ANDBILIARYTRACT