Original Article
Expression of reactive oxygen species-related proteins in
metastatic breast cancer is dependent on the
metastatic site
Hye Min Kim, Woo Hee Jung, Ja Seung Koo
Department of Pathology, Yonsei University College of Medicine, Seoul, South Korea
Received October 12, 2014; Accepted December 1, 2014; Epub December 1, 2014; Published December 15, 2014
Abstract: This study was performed to investigate the expression of reactive oxygen species (ROS)-related proteins and to analyze the implications for primary and metastatic breast cancer. We constructed a tissue microarray con-taining 143 metastatic breast cancers (52 lung metastases, 38 bone metastases, 37 brain metastases, and 16 liver metastases) and performed immunohistochemical staining for ROS-related proteins (catalase, GSTπ, TxNIP, and MnSOD). Analysis of ROS-related protein expression in metastatic breast cancers according to the metastatic sites revealed site-specific expression patterns. The expression of tumoral catalase was lower in bone metastases (P = 0.012), and stromal GSTπ expression was higher in bone and liver metastases (P < 0.001). The highest ROS ac-tivation status was observed for lung metastases, while non-activated ROS was observed for bone metastases (P = 0.001). Primary cancers were positive for stromal GSTπ, but a subset of lung metastases were negative (P = 0.021). Univariate analysis revealed that shorter overall survival (OS) was associated with negative catalase expression of the tumor (P = 0.026). Furthermore, univariate analyses according to the metastatic sites revealed that shorter OS was associated with TxNIP-positive tumors (P = 0.032) and the expression of stromal catalase (P = 0.032) in brain metastases. Tumors that were negative for MnSOD expression (P < 0.001) but positive for stromal catalase expres-sion (P = 0.022) were associated with shorter OS in patients with liver metastases. In concluexpres-sion, cancer cells and stromal tissues showed different ROS-related protein expression patterns according to the metastatic site. In addi-tion, the expression of ROS-related proteins is associated with patient prognosis.
Keywords: Breast cancer, metastasis, reactive oxygen species
Introduction
Among all cancers, breast cancer has one of
the highest rates of morbidity and mortality
due to the occurrence of distant metastases.
The major organs affected in metastatic breast
cancer are the lung, brain, liver, and bone [1, 2].
However, most of the existing studies are
per-formed for metastases to the brain and bone
[3-8]. Not all cancers show similar metastatic
patterns, raising the seed and soil hypothesis,
which states that a specific tumor (the seed)
grows in a specific visceral organ (the soil) [9].
Metastatic breast cancer also displays specific
characteristics depending on the metastatic
site. According to previous studies, the
charac-teristics associated with brain metastases
include young age, estrogen receptor (ER)
neg-ativity, prior lung metastasis, human epidermal
growth factor receptor 2 (HER-2)
overexpres-sion, epidermal growth factor receptor (EGFR)
overexpression, and basal subtype [5-7]. In
contrast, the characteristics associated with
bone metastases are lower histologic grade, ER
positivity, ER positivity/progesterone receptor
(PR) negativity, strand growth pattern, and the
presence of fibrotic foci in invasive ductal
carci-noma [4, 10, 11]. Therefore, the fact that
differ-ent metastatic cancers display differdiffer-ent
char-acteristics depending on the metastatic site is
well supported.
Neoplastic cells differ from normal cells; the
most significant difference is that they receive
constant stimulation from growth promoting
signals. The resulting infinite cell proliferation
allows for different metabolic activities of the
neoplastic cells compared to the normal cells.
Specifically, these changes lead to accelerated
cell proliferation and impose increased
oxida-tive stress, which results in an alteration of the
normal redox balance.
A previous study showed that the redox
buffer-ing systems such as the thioredoxin,
glutathi-one, and antioxidant systems (for example
cat-alase and superoxide dismutase) are either
deregulated or overexpressed in tumors
[12-14]. The altered redox process can lead to
oncogenic transformation or mutations within
the tumor. Consequently, the ROS pathway was
recently investigated as a new possible target
for therapy [15]. Because targeted therapy can
be utilized not only for primary cancer but also
for metastatic cancer, it is important to
under-stand the ROS status of both primary and
met-astatic cancers. It has previously been shown
that the ER, PR, and HER-2 status of primary
and metastatic breast cancers can be
discor-dant. Therefore, the relationship between the
ROS status of primary and metastatic breast
cancers needs to be investigated. To address
this discrepancy, this study investigates the
expression of ROS-related proteins and its
implications in primary and metastatic breast
cancers.
Materials and methods
Patient selection
Patients with invasive primary breast cancer
and metastases to distant organs (lung, bone,
brain, and liver) were selected using their
medi-cal records at the Department of Pathology of
Severance Hospital. Only patients with a
diag-nosis of invasive ductal carcinoma were
includ-ed. In total, 143 patients were identified, and
for 38 of those patients samples of primary and
metastatic cancers were available. All slides
were reviewed and the resulting pathologic
diagnoses were approved by 2 pathologists
in this study are shown in Table 1.
Formalin-fixed, paraffin-embedded (FFPE) tissue
sam-ples were used as follows: 3 μm-thick slices
from the FFPE tissue block were deparaffinized
and rehydrated in xylene and alcohol solutions
and stained using the Ventana Discovery XT
automated stainer (Ventana Medical System,
Tucson, AZ, USA). Antigen retrieval was
per-formed with Cell Conditioning 1 buffer (citrate
buffer pH 6.0, Ventana Medical Systems).
Appropriate positive and negative controls were
used.
Interpretation of immunohistochemical results
A cut-off value of 1% or more was used to define
ER and androgen receptor positivity in
positive-ly stained nuclei [17]. The HER-2 staining was
analyzed according to the American Society of
Clinical Oncology/College of American Path-
ologists guidelines using the following
catego-ries: (0) = no immunostaining; (1+) = weak and/
or incomplete membrane staining in less than
10% of tumor cells; (2+) = complete membrane
staining that is either uniform or weak in at
least 10% of tumor cells; and (3+) = uniform,
intense membrane staining in at least 30% of
tumor cells [18]. The HER-2 immunostaining
was considered positive when a strong (3
+)
membrane staining was observed, whereas it
was considered negative when none or weak (0
to 1+) staining was seen.
IHC result interpretation was based on the
product of the proportion of stained cells and
the immunohistochemical staining intensity. A
product between 0 and 1 was regarded as
neg-ative, a product between 2 and 4 as a low
posi-tive, and a product between 5 and 6 as a high
positive [19]. The proportion of stained cells
was scored as 0 for negative, 1 for positive with
less than 30% of the cells stained, and 2 for
positive with greater than or equal to 30% of
cells stained. The staining intensity was scored
Table 1. Clone, dilution, and source of antibodies used
Antibody Clone Dilution Source
Catalase Polyclonal 1:600 Abcam, Cambridge, UK GSTπ Polyclonal 1:500 Assay Design, Michican, USA
TxNIP JY2 1:100 MBL International Corporation, Woburn, USA MnSOD Polyclonal 1:100 Abcam, Cambridge, UK
GSTπ, Glutathione S-transferase π; TxNIP, Thioredoxin interacting protein; MnSOD, Manganese superoxide dismutase.
(JSK and WHJ). The
histolog-ical grade was assessed
based on the Nottingham
grading system [16]. This
study was approved by the
Institutional Review Board.
Immunohistochemistry
The antibodies used for
immunohistochemistry (IHC)
as 0 for negative, 1 for weak, 2 for moderate,
and 3 for strong.
Statistical analysis
Data were statistically processed using SPSS
for Windows, version 12.0 (SPSS Inc., Chicago,
IL, USA). Correlation analysis of the
immunos-taining results between primary and metastatic
breast cancer was performed using the
McNemar test. Comparative statistics were
performed using chi-square analysis. Statistical
significance was assumed for P
< 0.05.
Kaplan-Meier survival curves and log-rank statistics
were used to evaluate the time until tumor
metastasis and the time of survival.
Results
Basal characteristics of patients
Our study included a total of 143 patients. Of
these, 52 (36.4%) had lung metastases, 38
(26.6%) had bone metastases, 37 (25.9%) had
brain metastases, and 16 (11.2%) had liver
metastases. The proportion of patients that
were ER-positive and PR-positive was higher
among those with bone and liver metastases
compared to patients with metastases to other
sites (P < 0.001). The proportion of patients
that were HER-2 positive was higher in patients
with brain metastases compared to patients
with metastases to other sites (P = 0.035).
Furthermore, luminal A type breast cancer was
more common among patients with bone and
liver metastases, while triple negative breast
cancer (TNBC) was more common among
patients with brain and lung metastases (P =
0.010) (Table 2).
Expression of ROS-related proteins in breast
cancer metastasis depending on the
meta-static site
The analysis of ROS-related protein expression
depending on the metastatic site in metastatic
breast cancer revealed site-specific expression
patterns (Figure 1). The expression of catalase
in tumor cells was lower in bone metastases (P
= 0.012), and the expression of stromal
gluta-thione S-transferase π (GSTπ) was higher in
bone and liver metastases (P < 0.001). The
ROS status defined by the expression of
ROS-related proteins differed depending on the
met-Table 2. Basal clinicopathological characteristics of breast cancer metastases according to the
meta-static sites
Parameters n = 143 (%)Total Bone metastasisn = 38 (%) Brain metastasisn = 37 (%) Liver metastasisn = 16 (%) Lung metastasisn = 52 (%) P-value
Age (years) 0.169 ≤ 50 75 (52.4) 22 (57.9) 17 (45.9) 5 (31.2) 31 (59.6) > 50 68 (47.6) 16 (42.1) 20 (54.1) 11 (68.8) 21 (40.4) ER < 0.001 Negative 66 (46.2) 7 (18.4) 26 (70.3) 4 (25.0) 29 (55.8) Positive 77 (53.8) 31 (81.6) 11 (29.7) 12 (75.0) 23 (44.2) PR < 0.001 Negative 100 (69.9) 21 (55.3) 36 (97.3) 7 (43.8) 36 (69.2) Positive 43 (30.1) 17 (44.7) 1 (2.7) 9 (56.2) 16 (30.8) HER-2 0.035 Negative 99 (69.2) 31 (81.6) 19 (51.4) 12 (75.0) 37 (71.2) Positive 44 (30.8) 7 (18.4) 18 (48.6) 4 (25.0) 15 (28.8) Molecular subtypes < 0.001 Luminal A 54 (37.8) 27 (71.1) 3 (8.1) 9 (56.2) 15 (28.8) Luminal B 24 (16.8) 5 (13.2) 8 (21.6) 3 (18.8) 8 (15.4) HER-2 29 (20.3) 4 (10.5) 12 (32.4) 3 (18.8) 10 (19.2) NBC 36 (25.2) 2 (5.3) 14 (37.8) 1 (6.2) 19 (36.5) Patient death 48 (33.6) 21 (55.3) 11 (29.7) 4 (25.0) 12 (23.1) 0.010
ER, estrogen receptor; PR, progesterone receptor; HER-2, human epidermal growth factor receptor 2; TNBC, triple negative breast cancer.
astatic site; the highest ROS activation status
was observed for lung metastases, while
non-activated ROS was observed in cancer cells
derived from bone metastases (P = 0.001)
(Table 3).
Correlation of expression of ROS-related
pro-teins between primary and metastatic breast
cancer depending on the metastatic site
We analyzed the expression levels of
ROS-related proteins in primary and metastatic
can-cers in 38 patients from whom both samples
were available, and found that the expression
levels were not different. However, in
metastat-ic cancer patients, primary cancers were
posi-tive for stromal GSTπ, while a subset of lung
metastases were negative (P = 0.021) (Table
4).
The impact of autophagy-related protein
ex-pression on patient prognosis
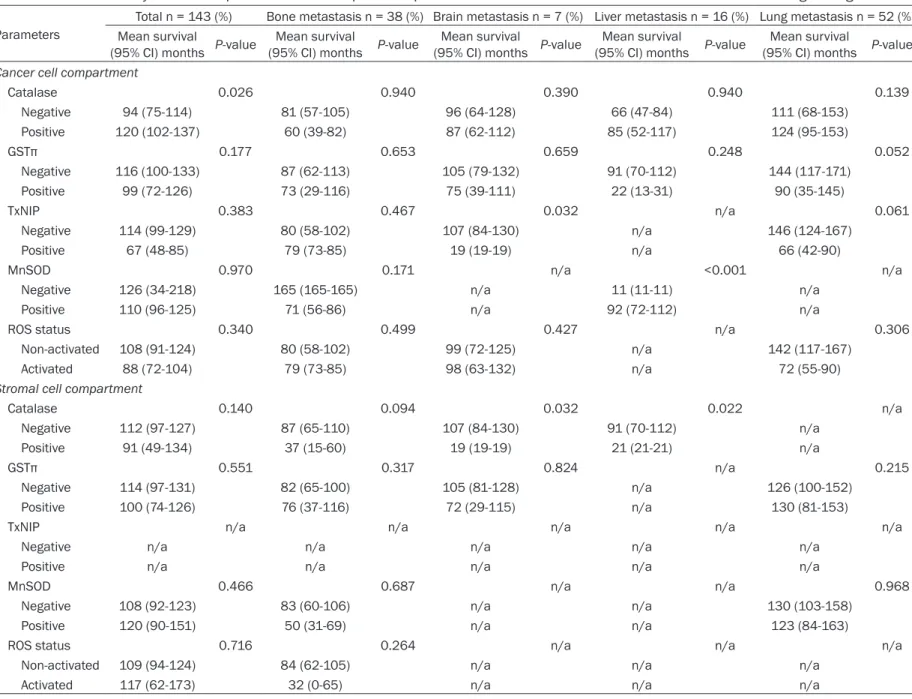
Using univariate analysis, we analyzed the
association of ROS-related protein expression
with respect to patient prognosis (Table 5 and
Figure 2). We found that the factor associated
with shorter overall survival (OS) was a tumor
with negative catalase expression (P = 0.026).
Using univariate analysis with respect to the
metastatic site, we found that the factors
asso-ciated with shorter OS in patients with brain
metastases were tumors with positive Thiore-
doxin Interacting Protein (TxNIP) staining (P =
0.032) and stromal catalase expression (P =
0.032). Tumors with negative manganese
superoxide dismutase (MnSOD) staining (P <
0.001) and positive stromal catalase
expres-Figure 1. Expression of ROS-related proteins in metastatic breast cancers according to the metastatic sites. The expression of tumoral catalase was lower in bone metastasis, and that of stromal GSTπ was higher in bone and liver metastasis.sion (P = 0.022) were associated with shorter
OS in patients with liver metastases.
Discussion
In this study, differences in the expression of
ROS-related proteins were observed among
patients with metastatic breast cancer
depend-ing on the metastatic site. Our analysis revealed
site-specific expression patterns of catalase in
tumor cells, with lower expression levels in
patients with bone metastases (P = 0.012).
Furthermore, higher expression levels of
stro-mal GSTπ were observed in patients with bone
and liver metastases (P < 0.001). A comparison
based on previous studies was not possible
due to the lack of ROS-related protein
expres-sion data of metastatic breast cancers. ROS is
widely known to play an important role in tumor
metastasis [20]. ROS promotes metastasis by
activating the signaling pathway that is involved
in tumor metastasis. Mechanistically, ROS
acti-vates key signal transduction proteins through
Table 3. Expression of ROS-related proteins in the tumor cell compartment of breast cancer metastasis
according to the metastatic sites
Parameters n = 143 (%)Total Bone metastasisn = 38 (%) Brain metastasisn = 37 (%) Liver metastasisn = 16 (%) Lung metastasisn = 52 (%) P-value Cancer cell compartment
Catalase 0.012 Negative 75 (52.4) 27 (71.1) 21 (56.8) 8 (50.0) 19 (52.4) Positive 68 (47.6) 11 (28.9) 16 (43.2) 8 (50.0) 68 (47.6) GSTπ 0.051 Negative 102 (71.3) 31 (81.6) 28 (75.7) 13 (81.2) 30 (57.7) Positive 41 (28.7) 7 (18.4) 9 (24.3) 3 (18.8) 22 (42.3) TxNIP 0.126 Negative 126 (88.1) 34 (89.5) 36 (97.3) 14 (87.5) 42 (80.8) Positive 17 (11.9) 4 (10.5) 1 (2.7) 2 (12.5) 10 (19.2) MnSOD 0.198 Negative 5 (3.5) 1 (2.6) 3 (8.1) 1 (6.2) 0 (0.0) Positive 138 (96.5) 37 (97.4) 34 (91.9) 15 (93.8) 52 (100.0) ROS status 0.001 Non-activated 113 (79.0) 35 (92.1) 32 (86.5) 14 (87.5) 32 (61.5) Activated 30 (21.0) 3 (7.9) 5 (13.5) 2 (12.5) 20 (38.5) Stromal cell compartment
Catalase 0.080 Negative 130 (90.9) 31 (81.6) 36 (97.3) 14 (87.5) 49 (94.2) Positive 13 (9.1) 7 (18.4) 1 (2.7) 2 (12.5) 3 (5.8) GST π < 0.001 Negative 99 (69.2) 21 (55.3) 32 (86.5) 4 (25.0) 42 (80.8) Positive 44 (30.8) 17 (44.7) 5 (13.5) 12 (75.0) 10 (19.2) TxNIP 0.623 Negative 142 (99.3) 38 (100.0) 37 (100.0) 16 (100.0) 51 (98.1) Positive 1 (0.7) 0 (0.0) 0 (0.0) 0 (0.0) 1 (1.9) MnSOD 0.110 Negative 118 (82.5) 30 (78.9) 34 (91.9) 15 (93.8) 39 (75.0) Positive 25 (17.5) 8 (21.1) 3 (8.1) 1 (6.2) 13 (25.0) ROS status 0.426 Non-activated 136 (95.1) 35 (92.1) 37 (100.0) 15 (93.8) 49 (94.2) Activated 7 (4.9) 3 (7.9) 0 (0.0) 1 (6.2) 3 (5.8)
GSTπ, Glutathione S-transferase π; TxNIP, Thioredoxin interacting protein; MnSOD, Manganese superoxide dismutase; ROS, Reac-tive oxygen species.
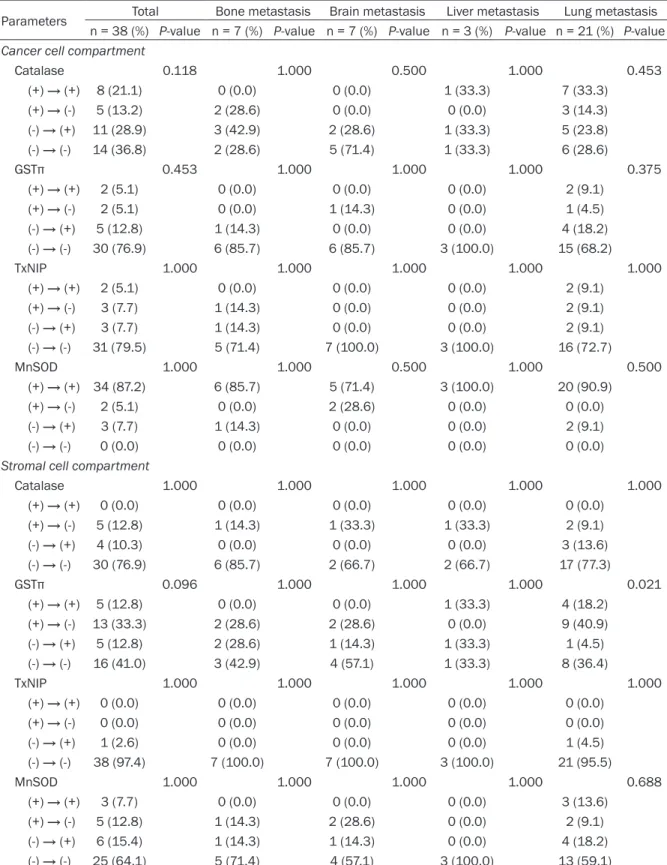
Table 4. Correlation of ROS-related protein expression in cancer cells between primary and metastatic
breast cancers with respect to the metastatic sites
Parameters Total Bone metastasis Brain metastasis Liver metastasis Lung metastasis n = 38 (%) P-value n = 7 (%) P-value n = 7 (%) P-value n = 3 (%) P-value n = 21 (%) P-value Cancer cell compartment
Catalase 0.118 1.000 0.500 1.000 0.453 (+) → (+) 8 (21.1) 0 (0.0) 0 (0.0) 1 (33.3) 7 (33.3) (+) → (-) 5 (13.2) 2 (28.6) 0 (0.0) 0 (0.0) 3 (14.3) (-) → (+) 11 (28.9) 3 (42.9) 2 (28.6) 1 (33.3) 5 (23.8) (-) → (-) 14 (36.8) 2 (28.6) 5 (71.4) 1 (33.3) 6 (28.6) GSTπ 0.453 1.000 1.000 1.000 0.375 (+) → (+) 2 (5.1) 0 (0.0) 0 (0.0) 0 (0.0) 2 (9.1) (+) → (-) 2 (5.1) 0 (0.0) 1 (14.3) 0 (0.0) 1 (4.5) (-) → (+) 5 (12.8) 1 (14.3) 0 (0.0) 0 (0.0) 4 (18.2) (-) → (-) 30 (76.9) 6 (85.7) 6 (85.7) 3 (100.0) 15 (68.2) TxNIP 1.000 1.000 1.000 1.000 1.000 (+) → (+) 2 (5.1) 0 (0.0) 0 (0.0) 0 (0.0) 2 (9.1) (+) → (-) 3 (7.7) 1 (14.3) 0 (0.0) 0 (0.0) 2 (9.1) (-) → (+) 3 (7.7) 1 (14.3) 0 (0.0) 0 (0.0) 2 (9.1) (-) → (-) 31 (79.5) 5 (71.4) 7 (100.0) 3 (100.0) 16 (72.7) MnSOD 1.000 1.000 0.500 1.000 0.500 (+) → (+) 34 (87.2) 6 (85.7) 5 (71.4) 3 (100.0) 20 (90.9) (+) → (-) 2 (5.1) 0 (0.0) 2 (28.6) 0 (0.0) 0 (0.0) (-) → (+) 3 (7.7) 1 (14.3) 0 (0.0) 0 (0.0) 2 (9.1) (-) → (-) 0 (0.0) 0 (0.0) 0 (0.0) 0 (0.0) 0 (0.0)
Stromal cell compartment
Catalase 1.000 1.000 1.000 1.000 1.000 (+) → (+) 0 (0.0) 0 (0.0) 0 (0.0) 0 (0.0) 0 (0.0) (+) → (-) 5 (12.8) 1 (14.3) 1 (33.3) 1 (33.3) 2 (9.1) (-) → (+) 4 (10.3) 0 (0.0) 0 (0.0) 0 (0.0) 3 (13.6) (-) → (-) 30 (76.9) 6 (85.7) 2 (66.7) 2 (66.7) 17 (77.3) GSTπ 0.096 1.000 1.000 1.000 0.021 (+) → (+) 5 (12.8) 0 (0.0) 0 (0.0) 1 (33.3) 4 (18.2) (+) → (-) 13 (33.3) 2 (28.6) 2 (28.6) 0 (0.0) 9 (40.9) (-) → (+) 5 (12.8) 2 (28.6) 1 (14.3) 1 (33.3) 1 (4.5) (-) → (-) 16 (41.0) 3 (42.9) 4 (57.1) 1 (33.3) 8 (36.4) TxNIP 1.000 1.000 1.000 1.000 1.000 (+) → (+) 0 (0.0) 0 (0.0) 0 (0.0) 0 (0.0) 0 (0.0) (+) → (-) 0 (0.0) 0 (0.0) 0 (0.0) 0 (0.0) 0 (0.0) (-) → (+) 1 (2.6) 0 (0.0) 0 (0.0) 0 (0.0) 1 (4.5) (-) → (-) 38 (97.4) 7 (100.0) 7 (100.0) 3 (100.0) 21 (95.5) MnSOD 1.000 1.000 1.000 1.000 0.688 (+) → (+) 3 (7.7) 0 (0.0) 0 (0.0) 0 (0.0) 3 (13.6) (+) → (-) 5 (12.8) 1 (14.3) 2 (28.6) 0 (0.0) 2 (9.1) (-) → (+) 6 (15.4) 1 (14.3) 1 (14.3) 0 (0.0) 4 (18.2) (-) → (-) 25 (64.1) 5 (71.4) 4 (57.1) 3 (100.0) 13 (59.1)
Table 5. Univariate analysis of the impact of ROS-related protein expression in metastatic breast cancers on overall survival using the log-rank test
ParametersTotal n = 143 (%) Bone metastasis n = 38 (%) Brain metastasis n = 7 (%) Liver metastasis n = 16 (%) Lung metastasis n = 52 (%) Mean survival
(95% CI) months P-value (95% CI) months P-valueMean survival (95% CI) months P-valueMean survival (95% CI) months P-valueMean survival (95% CI) months P-valueMean survival Cancer cell compartment
Catalase 0.026 0.940 0.390 0.940 0.139 Negative 94 (75-114) 81 (57-105) 96 (64-128) 66 (47-84) 111 (68-153) Positive 120 (102-137) 60 (39-82) 87 (62-112) 85 (52-117) 124 (95-153) GSTπ 0.177 0.653 0.659 0.248 0.052 Negative 116 (100-133) 87 (62-113) 105 (79-132) 91 (70-112) 144 (117-171) Positive 99 (72-126) 73 (29-116) 75 (39-111) 22 (13-31) 90 (35-145) TxNIP 0.383 0.467 0.032 n/a 0.061 Negative 114 (99-129) 80 (58-102) 107 (84-130) n/a 146 (124-167) Positive 67 (48-85) 79 (73-85) 19 (19-19) n/a 66 (42-90)
MnSOD 0.970 0.171 n/a <0.001 n/a
Negative 126 (34-218) 165 (165-165) n/a 11 (11-11) n/a
Positive 110 (96-125) 71 (56-86) n/a 92 (72-112) n/a
ROS status 0.340 0.499 0.427 n/a 0.306
Non-activated 108 (91-124) 80 (58-102) 99 (72-125) n/a 142 (117-167)
Activated 88 (72-104) 79 (73-85) 98 (63-132) n/a 72 (55-90)
Stromal cell compartment
Catalase 0.140 0.094 0.032 0.022 n/a Negative 112 (97-127) 87 (65-110) 107 (84-130) 91 (70-112) n/a Positive 91 (49-134) 37 (15-60) 19 (19-19) 21 (21-21) n/a GSTπ 0.551 0.317 0.824 n/a 0.215 Negative 114 (97-131) 82 (65-100) 105 (81-128) n/a 126 (100-152) Positive 100 (74-126) 76 (37-116) 72 (29-115) n/a 130 (81-153)
TxNIP n/a n/a n/a n/a n/a
Negative n/a n/a n/a n/a n/a
Positive n/a n/a n/a n/a n/a
MnSOD 0.466 0.687 n/a n/a 0.968
Negative 108 (92-123) 83 (60-106) n/a n/a 130 (103-158)
Positive 120 (90-151) 50 (31-69) n/a n/a 123 (84-163)
ROS status 0.716 0.264 n/a n/a n/a
Non-activated 109 (94-124) 84 (62-105) n/a n/a n/a
Activated 117 (62-173) 32 (0-65) n/a n/a n/a
oxidative posttranslational modifications of
redox-sensitive proteins [21]. Therefore,
meta-static cancers are expected to show an increase
in the expression of ROS-related proteins. In
this study, the expression of ROS-related
pro-teins differed depending on the metastatic site.
Previous studies reported different expression
patterns of the most important biomarkers of
breast cancer (ER, PR, and HER-2) according to
the metastatic site. Most brain metastases are
TNBC or HER-2 positive [6], whereas most bone
metastases are hormone receptor positive [4].
These results were in agreement with our study.
The proportion of hormone receptor positive
cancer was high in liver metastases, and the
proportion of TNBC was high in lung
metasta-ses. Our study showed different biological
char-acteristics depending on the metastatic site.
Previous studies showed a reverse correlation
between ER and ROS. Specifically, the
suppres-sion of ER resulted in increased ROS
produc-tion in breast cancer cells [22]. In this study,
patients with bone metastases showed a high
proportion of ER positivity and non-activated
ROS status, while patients with lung
metasta-ses showed a low proportion of ER positivity
and activated ROS status. Thus, the difference
of ROS status according to the metastatic site
could be the result of the hormone receptor
status. Further research is required to
substan-tiate this hypothesis.
Stromal tissues showed different expression
patterns of ROS-related proteins; stromal GSTπ
showed higher expression levels in bone and
liver metastases. The possible theory, which
can explain the expression of ROS-related
pro-teins in stromal tissue, is the reverse-Warburg
effect theory. According to this theory, cancer
cells generate ROS (such as nitric oxide), which
can cause oxidative stress and trigger
glycoly-sis, autophagy (mitophagy), and mitochondrial
dysfunction through NFκB and HIF-1α in
stro-mal cells. Ketone bodies and lactate are formed
through glycolysis in stromal cells that enter
the cancer cells and produce ATP effectively
through oxidative phosphorylation in the
mito-chondria of the cancer cells, which as a whole
contributes to their survival and growth
[23-27]. According to the reverse Warburg effect
theory, to maintain the metabolic support of
cancer cells, stromal cells should withstand the
oxidative stress caused by ROS secreted from
cancer cells. If detoxifying enzymes such as
GSTπ are expressed at high levels, stromal cells
could maintain the metabolic support of cancer
cells under such oxidative stress environments.
Previous studies reported that the reverse
Warburg effect occurs in a high proportion of
hormone receptor-positive luminal type breast
cancers [28]. In this study, bone and liver
metastases, of which a high proportion was of
the luminal type, showed high stromal GSTπ
expression. This can be because most bone
and liver metastases display a reverse Warburg
effect. However, further validation is required
to generalize the findings of this study.
The clinical significance of this study is that
ROS regulators may be a treatment modality.
Previous studies reported that the substance
increasing ROS caused ROS-induced apoptosis
in cancer cells, while normal cells were not
affected [29, 30]. However, the substance
decreasing ROS accelerated tumor growth [31].
Therefore, ROS modulators can be considered
as potential therapeutic agents that cause
can-cer cell death by further increasing ROS levels
in targeted metastatic cancers with already
increased ROS levels. However, more research
is required to validate this hypothesis.
In conclusion, our study showed different
expression patterns of ROS-related proteins in
cancer cells and stromal tissues in metastatic
breast cancers depending on the metastatic
site. The expression of catalase was lower in
bone metastases and that of stromal GSTπ was
higher in bone and liver metastases.
Acknowledgements
This study was supported by a grant from the
National R&D Program for Cancer Control,
Ministry of Health & Welfare, Republic of Korea
(1420080).
Disclosure of conflict of interest
None.
Address correspondence to: Dr. Ja Seung Koo, De- partment of Pathology, Yonsei University College of Medicine, Severance Hospital, 50 Yonsei-Ro, Seodaemun-Gu, Seoul 120-752, South Korea. Tel: 82-2-2228-1772; Fax: 82-2-362-0860; E-mail: [email protected]
References
[1] Weil RJ, Palmieri DC, Bronder JL, Stark AM and Steeg PS. Breast cancer metastasis to the
cen-tral nervous system. Am J Pathol 2005; 167: 913-920.
[2] Woodhouse EC, Chuaqui RF and Liotta LA. General mechanisms of metastasis. Cancer 1997; 80: 1529-1537.
[3] Abali H and Celik I. High incidence of central nervous system involvement in patients with breast cancer treated with epirubicin and docetaxel. Am J Clin Oncol 2002; 25: 632-633. [4] Colleoni M, O’Neill A, Goldhirsch A, Gelber RD,
Bonetti M, Thurlimann B, Price KN, Castiglione-Gertsch M, Coates AS, Lindtner J, Collins J, Senn HJ, Cavalli F, Forbes J, Gudgeon A, Simoncini E, Cortes-Funes H, Veronesi A, Fey M and Rudenstam CM. Identifying breast cancer patients at high risk for bone metastases. J Clin Oncol 2000; 18: 3925-3935.
[5] Evans AJ, James JJ, Cornford EJ, Chan SY, Burrell HC, Pinder SE, Gutteridge E, Robertson JF, Hornbuckle J and Cheung KL. Brain metas-tases from breast cancer: identification of a high-risk group. Clin Oncol (R Coll Radiol) 2004; 16: 345-349.
[6] Gaedcke J, Traub F, Milde S, Wilkens L, Stan A, Ostertag H, Christgen M, von Wasielewski R and Kreipe HH. Predominance of the basal type and HER-2/neu type in brain metastasis from breast cancer. Mod Pathol 2007; 20: 864-870.
[7] Hicks DG, Short SM, Prescott NL, Tarr SM, Coleman KA, Yoder BJ, Crowe JP, Choueiri TK, Dawson AE, Budd GT, Tubbs RR, Casey G and Weil RJ. Breast cancers with brain metastases are more likely to be estrogen receptor nega-tive, express the basal cytokeratin CK5/6, and overexpress HER2 or EGFR. Am J Surg Pathol 2006; 30: 1097-1104.
[8] Lorincz T, Toth J, Badalian G, Timar J and Szendroi M. HER-2/neu genotype of breast cancer may change in bone metastasis. Pathol Oncol Res 2006; 12: 149-152.
[9] Paget S. The distribution of secondary growths in cancer of the breast. Lancet 1889; 1: 571-572.
[10] Hasebe T, Imoto S, Yokose T, Ishii G, Iwasaki M and Wada N. Histopathologic factors signifi-cantly associated with initial organ-specific metastasis by invasive ductal carcinoma of the breast: a prospective study. Hum Pathol 2008; 39: 681-693.
[11] Wei B, Wang J, Bourne P, Yang Q, Hicks D, Bu H and Tang P. Bone metastasis is strongly associ-ated with estrogen receptor-positive/proges-terone receptor-negative breast carcinomas. Hum Pathol 2008; 39: 1809-1815.
[12] Pennington JD, Wang TJ, Nguyen P, Sun L, Bisht K, Smart D and Gius D. Redox-sensitive signal-ing factors as a novel molecular targets for cancer therapy. Drug Resist Updat 2005; 8: 322-330.
[13] Valko M, Leibfritz D, Moncol J, Cronin MT, Mazur M and Telser J. Free radicals and anti-oxidants in normal physiological functions and human disease. Int J Biochem Cell Biol 2007; 39: 44-84.
[14] Woolston CM, Deen S, Al-Attar A, Shehata M, Chan SY and Martin SG. Redox protein expres-sion predicts progresexpres-sion-free and overall sur-vival in ovarian cancer patients treated with platinum-based chemotherapy. Free Radic Biol Med 2010; 49: 1263-1272.
[15] Gorrini C, Harris IS and Mak TW. Modulation of oxidative stress as an anticancer strategy. Nat Rev Drug Discov 2013; 12: 931-947.
[16] Elston CW and Ellis IO. Pathological prognostic factors in breast cancer. I. The value of histo-logical grade in breast cancer: experience from a large study with long-term follow-up. Histopathology 1991; 19: 403-410.
[17] Hammond ME, Hayes DF, Dowsett M, Allred DC, Hagerty KL, Badve S, Fitzgibbons PL, Francis G, Goldstein NS, Hayes M, Hicks DG, Lester S, Love R, Mangu PB, McShane L, Miller K, Osborne CK, Paik S, Perlmutter J, Rhodes A, Sasano H, Schwartz JN, Sweep FC, Taube S, Torlakovic EE, Valenstein P, Viale G, Visscher D, Wheeler T, Williams RB, Wittliff JL and Wolff AC. American Society of Clinical Oncology/ College Of American Pathologists guideline recommendations for immunohistochemical testing of estrogen and progesterone recep-tors in breast cancer. J Clin Oncol 2010; 28: 2784-2795.
[18] Wolff AC, Hammond ME, Schwartz JN, Hagerty KL, Allred DC, Cote RJ, Dowsett M, Fitzgibbons PL, Hanna WM, Langer A, McShane LM, Paik S, Pegram MD, Perez EA, Press MF, Rhodes A, Sturgeon C, Taube SE, Tubbs R, Vance GH, van de Vijver M, Wheeler TM and Hayes DF. American Society of Clinical Oncology/College of American Pathologists guideline recommen-dations for human epidermal growth factor re-ceptor 2 testing in breast cancer. J Clin Oncol 2007; 25: 118-145.
[19] Won KY, Kim GY, Kim YW, Song JY and Lim SJ. Clinicopathologic correlation of beclin-1 and bcl-2 expression in human breast cancer. Hum Pathol 2010; 41: 107-112.
[20] Lei Y, Huang K, Gao C, Lau QC, Pan H, Xie K, Li J, Liu R, Zhang T, Xie N, Nai HS, Wu H, Dong Q, Zhao X, Nice EC, Huang C and Wei Y. Proteomics identification of ITGB3 as a key regulator in re-active oxygen species-induced migration and invasion of colorectal cancer cells. Mol Cell Proteomics 2011; 10: M110.005397.
[21] Yang W, Zou L, Huang C and Lei Y. Redox regu-lation of cancer metastasis: molecular signal-ing and therapeutic opportunities. Drug Dev Res 2014; 75: 331-341.
[22] Cook KL, Clarke PA, Parmar J, Hu R, Schwartz-Roberts JL, Abu-Asab M, Warri A, Baumann WT and Clarke R. Knockdown of estrogen recep-tor-alpha induces autophagy and inhibits anti-estrogen-mediated unfolded protein response activation, promoting ROS-induced breast can-cer cell death. FASEB J 2014; [Epub ahead of print].
[23] Bonuccelli G, Tsirigos A, Whitaker-Menezes D, Pavlides S, Pestell RG, Chiavarina B, Frank PG, Flomenberg N, Howell A, Martinez-Outschoorn UE, Sotgia F and Lisanti MP. Ketones and lac-tate “fuel” tumor growth and metastasis: Evidence that epithelial cancer cells use oxida-tive mitochondrial metabolism. Cell Cycle 2010; 9: 3506-3514.
[24] Martinez-Outschoorn UE, Balliet RM, Riva- deneira DB, Chiavarina B, Pavlides S, Wang C, Whitaker-Menezes D, Daumer KM, Lin Z, Witkiewicz AK, Flomenberg N, Howell A, Pestell RG, Knudsen ES, Sotgia F and Lisanti MP. Oxidative stress in cancer associated fibro-blasts drives tumor-stroma co-evolution: A new paradigm for understanding tumor metabo-lism, the field effect and genomic instability in cancer cells. Cell Cycle 2010; 9: 3256-3276. [25] Pavlides S, Tsirigos A, Vera I, Flomenberg N,
Frank PG, Casimiro MC, Wang C, Fortina P, Addya S, Pestell RG, Martinez-Outschoorn UE, Sotgia F and Lisanti MP. Loss of stromal caveo-lin-1 leads to oxidative stress, mimics hypoxia and drives inflammation in the tumor microen-vironment, conferring the “reverse Warburg ef-fect”: a transcriptional informatics analysis with validation. Cell Cycle 2010; 9: 2201-2219. [26] Pavlides S, Whitaker-Menezes D, Castello-Cros
R, Flomenberg N, Witkiewicz AK, Frank PG, Casimiro MC, Wang C, Fortina P, Addya S, Pestell RG, Martinez-Outschoorn UE, Sotgia F and Lisanti MP. The reverse Warburg effect: aerobic glycolysis in cancer associated fibro-blasts and the tumor stroma. Cell Cycle 2009; 8: 3984-4001.
[27] Witkiewicz AK, Whitaker-Menezes D, Dasgupta A, Philp NJ, Lin Z, Gandara R, Sneddon S, Martinez-Outschoorn UE, Sotgia F and Lisanti MP. Using the “reverse Warburg effect” to iden-tify high-risk breast cancer patients: stromal MCT4 predicts poor clinical outcome in triple-negative breast cancers. Cell Cycle 2012; 11: 1108-1117.
[28] Choi J, Kim do H, Jung WH and Koo JS. Metabolic interaction between cancer cells and stromal cells according to breast cancer molecular subtype. Breast Cancer Res 2013; 15: R78.
[29] Raj L, Ide T, Gurkar AU, Foley M, Schenone M, Li X, Tolliday NJ, Golub TR, Carr SA, Shamji AF, Stern AM, Mandinova A, Schreiber SL and Lee SW. Selective killing of cancer cells by a small molecule targeting the stress response to ROS. Nature 2011; 475: 231-234.
[30] Wu XJ and Hua X. Targeting ROS: selective kill-ing of cancer cells by a cruciferous vegetable derived pro-oxidant compound. Cancer Biol Ther 2007; 6: 646-647.
[31] Salganik RI. The benefits and hazards of anti-oxidants: controlling apoptosis and other pro-tective mechanisms in cancer patients and the human population. J Am Coll Nutr 2001; 20: 464S-472S; discussion 473S-475S.