ORIGINAL ARTICLE
Microarray 분석을 이용한 대하 (
Fenneropenaeus chinensis
) 유생의 카드뮴 단기 노출에 따른 유전자변화김수경1) 치오궈1,2) 윤종화1) 장인권1)*
1) 국립수산과학원 서해수산연구소 해역산업과, 2) 연성기술연구소 해양 생명공학과
Acute Toxicity of Cadmium on Gene Expression Profiling of Fleshy Shrimp, Fenneropenaeus Chinensis Postlarvae Using a cDNA Microarray
Su-Kyoung Kim1), Guo Qiao1,2), Jong-Hwa Yoon1), In-Kwon Jang1)*
1)Department of Aquaculture, National Fisheries Research & Development Institute, Taean 357-945, Korea
2)Marine and Bioengineering Department, Yancheng Institute of Technology, Yancheng, China
Abstract
Microarray technology provides a unique tool for the determination of gene expression at the level of messenger RNA (mRNA). This study, the mRNA expression profiles provide insight into the mechanism of action of cadmium in Fleshy shrimp (Fenneropenaeus chinensis). The ability of genomic technologies was contributed decisively to development of new molecular biomarkers and to the determination of new possible gene targets. Also, it can be approach for monitoring of trace metal using oligo-chip microarray-based in potential model marine user level organisms.
15K oligo-chip for F. chinensis that include mostly unique sets of genes from cDNA sequences was developed. A total of 13,971 spots (1,181 mRNAs up- regulated and 996 down regulated) were identified to be significantly expressed on microarray by hierarchical clustering of genes after exposure to cadmium for different conditions (Cd24-5000 and Cd48-1000). Most of the changes of mRNA expression were observed at the long time and low concentration exposure of Cd48-1000. But, gene ontology analysis (GO annotation) were no significant different between experiments groups. It was observed that mRNA expression of main genes involved in metabolism, cell component, molecular binding and catalytic function. It was suggested that cadmium inhibited metabolism and growth of F. chinensis .
Key words : Microarray, Fenneropenaeus chinensis, Cadmium, Toxicity
1)1. 서론
대하(Fenneropenaeus chinensis)는 북서태평양 연 안, 한국, 일본, 남중국에 분포하고 있으며(Changcheng, 1984; Kubo, 1949; Lee 와 Lee, 1992), 국내에서는 연 안을 중심으로 제한적 분포를 하고 있다. 이들의 생활사
를 볼 때 최근 경제개발이 활발하게 진행되고 있는 중국 과 인접하고 있는 황해가 주요 서식지이며, 산란장인 것 을 알 수 있다. 1980년대까지 대하는 주요어종으로써 한 국에서 어획되는 총 새우류의 17% (1,124MT)를 차지 하였다(Sheridan 등, 1984). 그러나, 1990년부터 진행된 국내 대규모 간척사업과(Lee 와 Lee, 1992) 2000년 중
Received 1 October, 2014; Revised 10 April, 2015;
Accepted 2 May, 2015
*Corresponding author : In-Kwon Jang, Department of Aquaculture, National Fisheries Research & Development Institute, Taean 357- 945, Korea
Phone: +82-32-745-0700 E-mail: [email protected]
ⓒ The Korean Environmental Sciences Society. All rights reserved.
This is an Open-Access article distributed under the terms of the Creative Commons Attribution Non-Commercial License (http://
creativecommons.org/licenses/by-nc/3.0) which permits unrestricted non-commercial use, distribution, and reproduction in any medium, provided the original work is properly cited.
국의 WTO가입 후 증가한 GDP와 비례하여 대하의 어 획량도 2000년도 이후 연간 546만톤의 생산량을 기록하 는데 그쳤다(Ministry of Oceans and Fisheries, 2013).
다양한 인간들의 활동으로 인해 자연적으로 유입되는 중 금속 양보다 더 고농도의 중금속이 연안해역 강이나 기 수역에서(Eysink 등, 1988a, 1988b) 검출되었고, 여기 에 서식하고 있는 해양생물의 조직에서도 검출되었다 (Carvalho 등., 2000, 2001). 일반적으로 오염되지 않은 해수의 평균 카드뮴 농도는 약 0.05 Cd/L 이지만, 최 근 황해 인근 연안에서는 증가하는 추세를 보여 0.1 Cd/L 이상 심지어 10 Cd/L 을 기록하는 지역도 있었 다(Soegianto 등, 1999). 카드뮴뿐 아니라 아연과 같은 중금속 농도도 4-800 Zn/l-1 광범위한 농도로 검출되 었다(Wu 와 Chen, 2004) .
중금속 물질 중 카드뮴은 비 필수 원소로 해양과 연안 에 서식하는 생물들에 강한 독성영향을 미치는 물질로 잘 알려져 있으며(Papathanassion, 1983; Wu 와 Chen, 2004), 특히 비이온화된 상태로 녹아 있을 때 가장 치명 적인 것으로 알려져 있다 (Mance, 1987). 특히 유전자의 전사과정이나 생체막의 수송과 같은 생리적인 과정의 전 반에 영향을 미치는 것으로 알려져 있고(Maroni 등, 1986), 갑각류에서는 대사활동을 비롯한 많은 생리학적 변화가 일어난다고 보고되고 있다(Barbieri 등, 2005;
Barbieri, 2009) .
소형어류, 갑각류를 이용한 다양한 종류의 중금속 물 질에 대한 독성평가는 이미 오래 전부터 시도되고 있으 며, 환경모니터링에 이용되고 있다(Benjamin 와 Carols, 2011; Kim 등, 2010). 그러나 중금속물질이 체내에 쉽 게 축적되지만 분해나 방출은 잘 이루어지지 않는다는 특성을(Eimers 등, 2001; Landrum 등, 1990; Reynoldon, 1987) 고려해볼 때 소비자 위치에 있는 생물에 대한 독 성영향 평가가 요구된다.
일반적으로 생물이 생리적, 대사활동 등을 제어하는 기능은 단일 유전자의 단독기능이 아니라 여러 유전자들 의 연쇄반응에 결과다(Geard 와 Wiles, 2005; Schilstra 과 Bolouri, 2002; Vohradsky, 2001). 유전자 칩분석은 이러한 측면에서 대량의 유전자들의 변화를 한번에 효 과적으로 처리하는데 용이한 기법이라고 할 수 있다 (Benjamin와 Carols, 2011; Ki 등, 2009; Leu 등, 2011) .
본 연구에서는 중금속 물질 중 카드뮴이 미치는 영향 을 분자생물수준에서 규명하고자 디자인한 유전자 칩을 이용하여 연구종인 대하와 같이 상위 소비자에 위치하고 있는 생물이 중금속물질에 노출되었을 때 영향 받는 유 전자 군을 선별하고, 이를 이용하여 소비자군의 생물모 니터링을 하는데 이용하고자 한다.
2. 재료 및 방법
2.1. 실험방법
대하유생 (F. chinensis, postlarvae 20기, 평균 체중 25.57 ± 12.15 mg) 1,000마리를 충남 대산에 위치한 청 수수산 종묘양식장에서 이송하여 23 1톤 수조에서 3 일간 순치하였다. 순치기간 알테미아를 급이 하였으며, 매일 환수하였다(Buikema 등, 1982). 해수는 1차 모래 여과기, 2차 카트리지필터 (100, 50 )를 이용하여 필터 한 후 마지막으로 오존살균 한 해수를 24시간 폭기 후 사 용하였다.
농도별 생존율 실험은 1 L 유리비커를 이용하였으며, 24 , 30psu, 용존산소 4.5 mg/L, pH 8.0 해수에 0, 10, 100, 1000, 5000 Cd/L 카드뮴 농도별 실험구를 5반복으로 준비하였다. 카드뮴 시험용액은 3차 증류수에 염화카드뮴(CdCl2, Sigma- Aldrich, USA)를 넣은 용액 을 시험용액으로 이용하였다. 각 실험구별 10마리의 순 치된 대하를 넣고 관찰하였다. 죽은 개체는 즉시 유리막 대를 이용하여 제거하였고, 12, 24, 48, 72, 96 시간별 노 출시간에 따른 생존 개체 수를 확인하였다.
반수치사 농도는 probit 분석을 기반으로 95% 신 뢰수준에서 계산하였다(Finney, 1952; Litchfield 와 Wilcoxon, 1949).
Microchip assay 칩분석에는 24시간 5000 cd/L 고농도로 노출된 시험구 (Cd24- 5000)와 반수치사농도 로 알려진 (Cd48- 1000)에 노출된 두 시료를 각각 분석 하였다. 각 시험구별 5마리 3반복을 1 ml RNA later® (Qiagen, Valencia, CA, USA)가 들어있는 2 ml 멸균튜 브 채집하여, -80 에 분석 전까지 보관하였다.
2.2. RNA 추출
실험새우로부터 RNA를 Trizol ® regent (Invitrogen, CA, USA)를 이용하여 추출하였다. 분쇄한 조직을 Trizol®
Regent와 혼합하여 용해될 때까지 섞어준 뒤, 1 ml를 1.5 ml 마이크로 튜브에 분주하여 13000 rpm으로, 10분 간 원심분리 하였다. 상층액을 분리하여 새 튜브에 넣고, chloroform 200 μl를 첨가하여 잘 섞어준 뒤 다시 13000 rpm로 10분간 원심 분리하여 팰렛을 수집하였다.
수집한 펠렛을 75% 에탄올로 세척하여 건조시킨 후 DEPC (0.1%) 처리된 증류수에 녹였다. microarray 실 험을 위해 확보된 RNA 시료는 Bioanalyzer 2100 (Agilent Technologies Inc, CA, USA)를 이용하여 RNA 순도를 측정하였다. Bioanalyzer 2100을 통해 얻어지는 28S/
18S rRNA의 integrity가 조직에서 추출한 RNA의 경우 에는 1.3 이상인 것을 사용하였다.
2.3 cDNA oligo-microarray 제작 및 분석
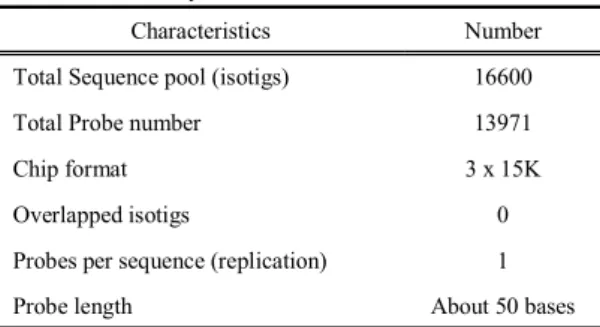
본 실험실에서 연구, 보유하고 있는 16,600개의 대하 cDNA 데이터베이스를 이용하여 획득한 13,971개의 독 립유전자의 염기서열을 토대로 50bp의 15K microarray 를 제작하였다(Table 1, Microarray. com, NJ, USA).
Table 1. Selection of sequence for 15K F. chinensis oligo microarray
Characteristics Number
Total Sequence pool (isotigs) 16600
Total Probe number 13971
Chip format 3 x 15K
Overlapped isotigs 0
Probes per sequence (replication) 1
Probe length About 50 bases
대조군에서 분리한 RNA는 cyanine 3-labeled (Cy 3, reference) 녹색 형광표지 하였고, 실험군에서 분리된 RNA는 cyanine 5-labeled (Cy 5, target) 적색 형광표 지 하였다. RNA amplification 및 labeling 반응은 Agilent사의 Low RNA Input Linear Amplification kit (Agilent Technologies Inc, CA, USA)를 사용하였다.
형광표지 방법은 2.2에서 추출한 RNA 시료 1 과 T7 promoter primer 1.2 를 혼합하고, 65 에서 10 분간 반응 후, 각각의 반응용기에 cDNA master mix (5X First strand buffer, 0.1M DTT, 10mM dNTP
mix, RNaseOut, and MMLVRT)에 혼합하고, 다시 40 에서 2시간 반응시킨다. Transcription master mix (4X Transcription buffer, 0.1M DTT, NTP mix, 50%
PEG, RNaseOut, Inorganic pyrophosphatase, T7RNA polymerase, Cyanine 3/5-CTP)에 dsDNA를 혼합하 고 40 에서 2시간 전사반응 시킨다. Amplification 및 labeling된 cRNA는 RNase mini column (Qiagen, USA) 를 이용하여 정제하고, ND-1000 분광광도계 (NanoDrop Technologies, Inc., Wilmington, DE)를 이용하여 농도 와 형광광도 효율을 측정하였다. 효율을 측정한 후 750 ng의 Cy 3 및 Cy 5 cRNA를 이용하여 후처리 과정을 수 행한다 (10X blocking 및 25X fragmentation, 60 , 30 min). 반응이 끝난 후, 2X hybridization buffer (Microarray. com, NJ, USA)를 첨가한 후, 파이펫으로 잘 섞어준 뒤, Agilent Hybridization oven (Agilent Technologies Inc, CA, USA)을 이용하여, Oligo micro -array chip에 65 에서 17시간 동안 5 rpm속도로 중합 반응(hybridization)을 실시한 뒤 42 에서 24시간 반 응시킨다. 반응이 끝난 칩은 42 세척용액1(2X SSC, 0.1% SDS)에서 5분, 실온에서 세척용액 2(0.1X SSC, 0.1% SDS)에서 10분, 그리고 마지막으로, 실온에서 0.1X SSC 용액에 1분 동안 4회에 걸쳐 세척한다. 세척 이 끝난 칩은 650 rpm으로 5분간 건조시킨다. 건조한 칩 은 GenePix Pro 6.0 software (Axon Instrument, Union City, CA)를 이용하여 암실에서 스캔하고, 정량데이터 화 한다. 각 spot에 대한 평균신호와 배경 형광 강도는 local background 값을 제외하고, Feature Extraction Software (Agilent Technologies Inc, CA, USA)를 이 용하여 계산하였다.
2.4 데이터 및 통계분석
Microarray 데이터들은 GeneSpring 7.3.1 (Silicon Genetics, Redwood, CA, USA)을 이용하여 표준화, 통 계 분석 및 군집분석을 시행하였다. LOWESS (Locally Weighted Scatter plot Smoothing, Cleveland, 1979) 알고리즘을 이용하여 표준화를 실시하였다. 표준화 과정 은 Cross-gene error model에 의해 산출된 값을 이용하 여 선별작업을 수행하고 이용 가능한 유전자들을 추출한 뒤, 선별된 유전자를 이용하여 산점도 (Scatter Plot)를 작성하였다. 통계분석을 위한 Fold change는 다음과 같
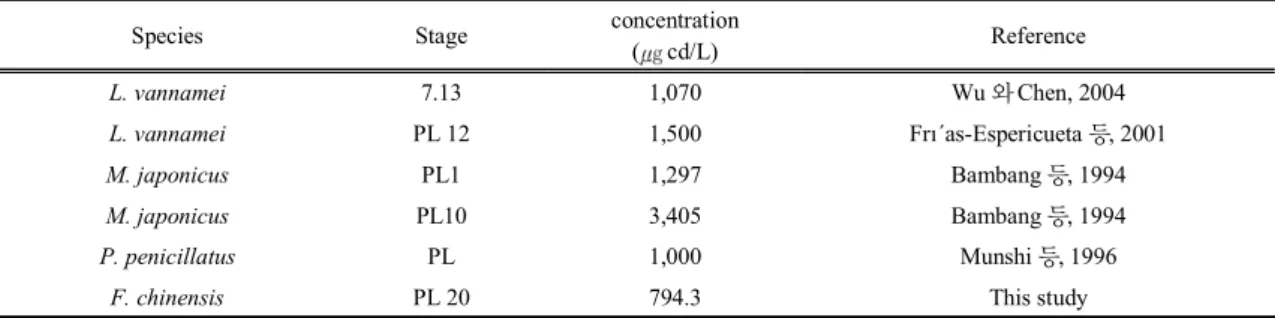
Species Stage concentration
( cd/L) Reference
L. vannamei 7.13 1,070 Wu 와 Chen, 2004
L. vannamei PL 12 1,500 Frı´as-Espericueta 등, 2001
M. japonicus PL1 1,297 Bambang 등, 1994
M. japonicus PL10 3,405 Bambang 등, 1994
P. penicillatus PL 1,000 Munshi 등, 1996
F. chinensis PL 20 794.3 This study
Table 2. 96-hr LC50 values ( cd/L) of total Cd. For several crustacean species
은 공식으로 계산하였다.
Fold change
= 적색염료 강도 (Cy 5) / 녹색염료 강도 (Cy 3)
각 조건에 따른 fold change의 비율을 각 표본을 계산 하여 up-regulated 유전자는 1.5-fold, down-regulate 유전자는 0.66-fold change를 기준으로 정렬하고, 유전 자들의 유의 수준을 p<0.05로 하여 T-검정을 통해 유의 성 검증을 하였다. 또한 각 실험구별로 유의하게 증감한 (up, down regulate) 유전자들을 호제법(euclidean) 알 고리즘을 이용하여 유전자들 간 거리를 분석하고, 군집 분석을 실시하였다(MultiExperiment Viewer, MA, USA).
2.5 유전자 기능별 색인 (Gene Ontology Annotation) 유전자는 기능별 색인(Gene ontology annotation)을 통해 크게 세포구성, 생물학적 과정 그리고 분자기능 부 분으로 분류된다(http: Geneontology.org). 이는, 생물 학적 시스템을 이용하는데 효과적인 방법으로 본 연구에 서는 각 염기서열 사이의 유사한 영역을 찾기 위해 blast (http://ftp.ncbi.nih.gov/blast/db/)를 수행하여 가장 높 은 일치도 값을 보이는 쿼리의 유전자 기능 색인을 할당 하였다.
3. 결과
3.1 생존율
기존의 다른 새우 종들의 실험을 바탕으로 평균 반수 치사 농도 1000 cd/L (Cd48-1000) 기준으로 대하(F.
chinensis) 유생의 시간에 따른 생존율을 관찰한 결과, 노출 24시간까지는 대조구와 차이를 보이지 않았으나,
48시간부터 사망개체가 관찰되기 시작하면서, 종료 시 96시간 노출 후 생존율이 40%로 나타났다. 본 연구결과 를 바탕으로 반수치사 농도를 계산한 결과 대하(F.
chinensis) 유생의 카드뮴 반수치사 농도(LC50)는 794.3 cd/L으로 나타났다.
두번째 실험은 카드뮴 농도별 노출실험으로 시료채집 을 위한 최소한 개체가 남는 시점을 종료시간으로 하고, 설정하였다. 그 결과 고농도의 카드뮴(Cd24-5000) 실험 구에 노출된 대하가 30시간째 20% 생존율을 보였고, 유 전자 분석을 위한 시료채집을 위해 실험을 종료하였다.
3.2 Microarray 데이터의 신뢰성과 발현 양상
카드뮴 독성에 의한 유전자 발현 변화패턴을 알아보 기 위해 농도별, 노출별 대표구로 두 종류의 실험에 대한 칩분석을 실시하였다. 첫 번째는 Cd24-5000실험구와 Cd48-1000 실험구에서 각각 채집한 대하 (F. chinensis) 시료로부터 추출한 RNA를 시험구(target)로 이용하고, 대조구(reference)는 각 실험의 대조구인 해수에서 채집 한 시료를 이용하였다. 각 실험구간 발현 프로파일은 형 광신호 값을 상용대수(log10) 값으로 변환하여 비율과 신호의 세기에 대한 함수로 표현되는 산점도 분석을 통 해 신뢰도를 검증하였다. 카드뮴 노출 농도가 5000 cd/L에서 1000 cd/L으로 농도가 감소함에 따라 유전 자들의 분포도가 넓어지는 것을 볼 수 있다(Fig. 1 a, b).
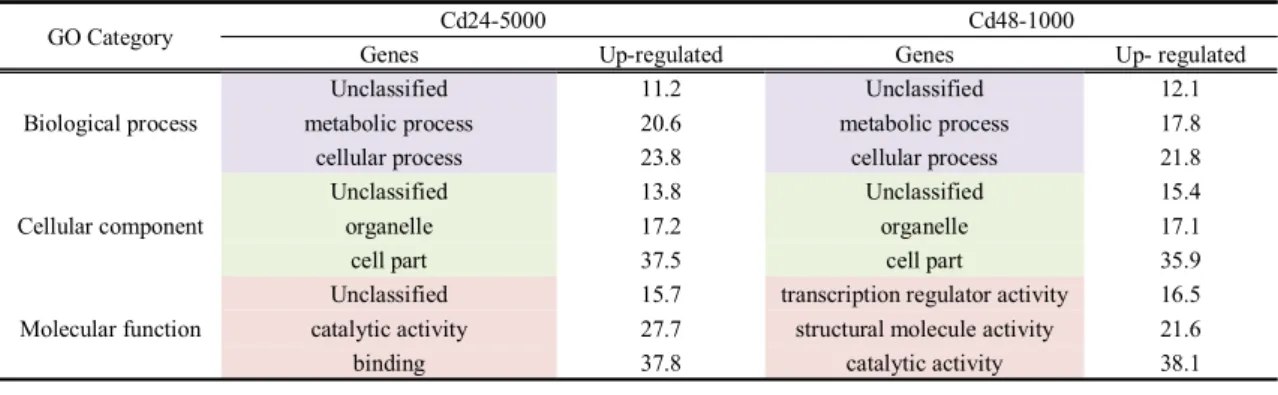
산점도 분석을 통해 표준화 처리 후 선별된 유전자들은 유의성 검정을 통해 활성화된 유전자와 감소한 유전자들 을 생물학적 과정, 세포구성, 유전자기능 세가지 유형으 로 분류하였다(Table 3a, b).
유형별로 가장 높은 발현 변화를 보이는 상위3개 군집 을 Cd24-5000과 Cd48-1000 실험구별 증가된 유전자
(a) Up-regulated
GO Category Cd24-5000 Cd48-1000
Genes Up-regulated Genes Up- regulated
Biological process
Unclassified 11.2 Unclassified 12.1
metabolic process 20.6 metabolic process 17.8
cellular process 23.8 cellular process 21.8
Cellular component
Unclassified 13.8 Unclassified 15.4
organelle 17.2 organelle 17.1
cell part 37.5 cell part 35.9
Molecular function
Unclassified 15.7 transcription regulator activity 16.5 catalytic activity 27.7 structural molecule activity 21.6
binding 37.8 catalytic activity 38.1
(b) Down-regulated
GO Category Cd24-5000 Cd48-1000
Genes Down- regulated Genes Down- regulated
Biological process
biological regulation 9.13 Unclassified 9.93
metabolic process 15.85 metabolic process 19.02
cellular process 20.23 cellular process 20.70
Cellular component
organelle part 13.74 Unclassified 15.15
organelle 14.72 organelle 16.60
cell part 36.69 cell part 37.03
Molecular function
structural molecule activity 12.23 Unclassified 14.15
catalytic activity 21.44 catalytic activity 26.12
binding 41.49 binding 39.28
Fig. 1. Reproducibility of hybridizations and independent experiments. a) RNAs from the control and Cd24-5000 were labeled with CH2 (Cy3) and CH1 (Cy5) hybridized to the same microarray. b) RNAs from the control and Cd48-1000 were labeled with CH2 (Cy3) and CH1 (Cy5) hybridized to the same microarray. A scatter plot comparing the log10 raw fluorescent signal intensities of CH2 (Cy3) and CH1 (Cy5) is shown, indicating that 99.8%
of the ESTs were within a 2-fold range.
Table 3. Gene annotation of Fenneropenaeus chinensis 15K microarray showing proportion of genes involved in biological process, cellular components and molecular function. A total of ~14000 genes were annotated
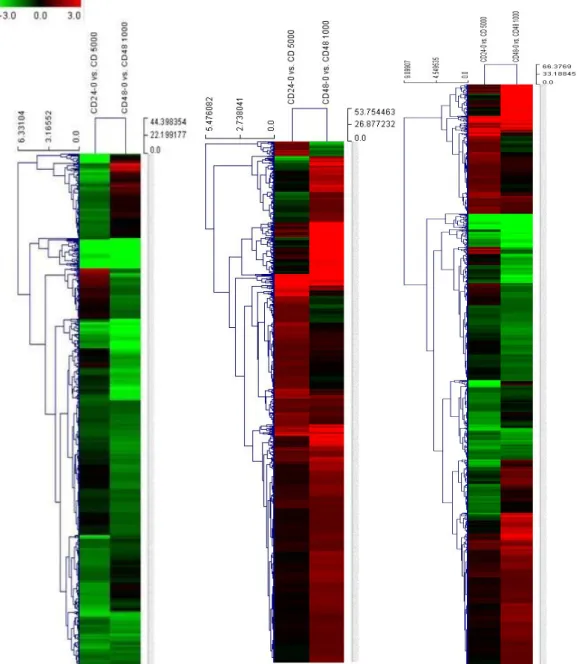
Fig. 2. Hierarchical clustering of expressed genes (13,971 spots) over the concentration/time in Cd-exposed shrimps for Cd24-5000 and Cd48-1000. (a) Spots representing down-regulated genes, (b) spots representing up-regulated genes and (c) total spots.
(up-regulated)의 군집을 결과 생물학적 과정에서는 세 포과정 유전자가 각각 23.8, 21.8%로 가장 높은 비율을 차지하였다. 다음으로 주요단백질 인코딩하는 대사에 관 여하는 유전자가 20.6%, 17.8% 그 뒤를 이었다. 세포구
성요소에 대한 코딩유전자를 비교하였을 때, 대부분이 세포의 일부를 형성하는 세포구성을 하는 유전자가 37.5, 35.9%였고, 다음으로 소기관을 형성하는 유전자 가 17%로 나타났다(Table 3a). 분자기능과 관련 있는
유전자들은 Cd24-5000과 Cd48-1000 실험구에서 차이 를 보였는데, Cd24-5000에서 결합기능을 하는 분자활 동이 37.8%로 주요군인 반면, Cd48-1000에서는 촉매 활동을 하는 유전자들이 38.1%로 다수를 보였다. 감소 발현(down-regulated) 변화를 보이는 하위3개 군집의 Cd24-5000과 Cd48-1000 두 실험구간 큰 차이를 보이 지 않았다. 생물학적 과정에서 대사와 세포구성요소 관 련하여 20%, 17%로 앞서 증가한 유전자군과 유사하였 으며, 분자기능과 관련한 유전자 또한 결합기능과 촉매 활동과 관련하여 각각 40, 20%로 비슷한 경향을 보였다 (Table 3b).
다음은 변화를 보인 유전자들간의 거리를 계통분석을 통해 분석한 결과로 총 13,971개 유전자 중 Cd24-5000 시험구에서 934개, Cd48-1000 시험구에서 1,181개 유 전자가 각각 증가(>1.5 fold)하였고, 831, 996개 유전자 가 각각 감소(<0.66 fold)하는 경향을 보였다(Fig. 2).
4. 고찰
본 연구 결과에 따르면 대하 (F. chinensis)유생의 카 드뮴 반수치사 농도는 794.3 cd/L로, 앞서 연구된 보 리새우과(Penaeid), 흰다리새우(Litopenaeus vannamei) 유생(1,500 cd/L), 보리새우(Marsupenaeus japonicus) 유생 (3,405 cd/L)의 반수치사 농도에 비해 각각 1/2, 1/4배 낮은 수치이고, 닭새우과(Panulirus) 가지뿔닭새 우(Panulirus penicillatus)에 비해서도 낮았다(Table 2). Bambang 등 (1994)의 결과에 따르면 보리새우(M.
japonicus)는 카드뮴에 대한 순응이 발달단계가 지남에 따라 함께 증가하는 경향을 보였으며, 이러한 결과는 개 체크기가 커지고, 탈피 전까지 시간이 길어지는 기본 생리 과정의 효율의 증가와 관련 있다고 하였다. 그러나 본 실험 에 이용한 대하(F. chinensis)는 유생기 20기로, Bambang 등(1994)이 실험한 보리새우(M. japonicus) 유생보다 10기 이후 단계였음에도 불구하고, 더 낮은 카드뮴 농도 에서 사망하였다. 따라서, 대하(F. chinensis) 유생기 단 계에 관계없이 다른 새우종에 비해 카드뮴 독성에 민감 한 것으로 사료된다.
카드뮴 독성에 의한 대하(F. chinensis)유생의 유전자 발현변화 패턴을 보기 위한 Microarray 분석은 각기 다 른 조건의 시료들 간에 수십만 개의 유전자 발현 패턴 변
화를 측정하는 것으로, 실험의 정교함과 데이터의 신뢰 성이 우선적으로 확보되어야 한다. 산점도 분석은 이러 한 데이터의 신뢰성을 검증하기 위한 자료로써 제시되어 왔다(Irizarry 등, 2003; Tusher 등, 1998). 본 연구에서 산점도 분석결과, Cd24-5000 실험구가 Cd48-1000 실 험구에 비해 유전자들의 분포가 좁게 나타나는 것을 확 인할 수 있었고(Fig. 1), 대하(F. chinensis)유생이 고농 도의 카드뮴에서 단시간 노출되었을 때 더 많은 유전자 들이 유의하게 영향을 받았다는 것을 알 수 있었다.
그러나, 유의한 변화를 보인 유전자들 중 증가 (up-regulated) 또는 감소(down-regulated) 경향을 보이 는 유전자들에 대한 기능적 분류 결과 Cd24-5000, Cd48-1000 실험구 전체에서 대사활동과 세포 또는 소 기관을 구성하는 기능을 하는 유전자들이 전체유전자의 20 ~ 40%로 높은 영향을 받은 것으로 나타났다 (Table 3b).
이러한 결과를 볼 때, 카드뮴 독성이 대하(F. chinensis)유 생의 대사활동과 세포형성 관여하는 mRNA 유전자에 교란을 일으켜 생리적 기능 및 대사활동에 영향을 미칠 것으로 보인다. 이는 앞선 카드뮴 독성 관련한 연구결과 들과도 일치하고 있다(Barbieri 등, 2005; Barbieri, 2009; Maroni 등, 1986).
Microarray를 이용한 칩분석은 대량의 유전자들을 단 시간에 효율적으로 탐색하고, 얻어진 유전자 정보를 이 용하여 데이터베이스를 구축 할 수 있는 장점을 가지고 있다(Geard와 Wiles, 2005; Ki 등, 2009). 축적된 정보 들은 기능이 알려진 유전자를 비롯해 아직 기능이 알려 져 있지 않은(Unclassified) 유전자들에 대한 프로파일 링을 통해 생물들이 갖고 있는 복잡한 전사단계를 통한 메커니즘을 이해하는데 도움을 줄 수 있다(Leu 등, 2011). 그러나, 아직 새우를 비롯한 해양생물에 유전자 분석 연구는 미비한 실정이다.
본 연구는 분자수준에서 대하(F. chinensis)유생이 카 드뮴에 노출되었을 때 변화를 유전자 칩분석을 통해 변 화를 관찰하고, 증가 또는 감소의 형태로 영향을 받은 유 전자들에 대하여 기능적인 측면에서 분류하였다. 그 결 과 대사과정과 세포, 소기관을 구성하는 기능을 갖는 유 전자들이 영향을 받는 것으로 나타났다. 향후 다른 중금 속들을 이용한 실험을 통해 공통적으로 영향을 받은 유 전자들을 선별하여 목적유전자로 개발한다면, 간이진단 키트 형태로 환경 생태모니터링을 하는데 이용 가능할
것으로 사료된다.
본 연구는 국립수산과학원 경상과제 (RP-2013-AQ -164)에 의하여 수행되었으며 연구에 도움을 주신 서해 수산연구소 양식연구센터 연구원들께 감사 드립니다.
REFERENCE
Bambang, Y., Charmantier, G., Thuet, P., Trilles, J-P., 1994.
Effect of cadmium on survival and osmoregulation of various developmental stages of the shrimp Penaeus japonicus. Marine Biology, 123, 443-450.
Barbieri, E., Passos, E. A., Garcia, C.A.B., 2005. Use of metabolism to evaluate the sub-lethal toxicity of mercury on Farfantepaneus brasiliensis larvae (Latreille 1817, crustacean), J. Shellfish Research, 24, 1229- 1234.
Barbieri, E., 2009. Effects of zinc and cadmium on oxygen consumption and ammonium excretion in pink shrimp (Farfantepenaeus paulensis, Perez- Farfante, 1967, Crustacea). Ecotoxicology, 18, 312- 318.
Benjamin, P., Carols, B., 2011. A genomic and eco- toxicological perspective of DNA array studies in aquatic environmental risk assessment. Aquatic Toxicology, 105, 40-49.
Buikema, A.L. Jr., Niederlehner, B.R., Cairns, J. Jr., 1982. Biological monitoring. Part IV. Toxicity testing. Water Res., 16, 239-262.
Carvalho, C.E.V., Cavalcante, M.P.O, Gomes, M.P., Faria, V.V., Rezende, C.E., 2001. Distribuicao de Metais Pesados em Mexilhoes (Perna perna, L.) da Ilha de Santana, Macae, SE, Brasil. Ecotoxicol.
Environ. Rest., 4, 1 5.
Carvalho, C.E.V., Fariam, V.V., Cavalcante, P.O., Gomes, M.P., Rezende, C.E., 2000. Distribuicao de Metais Pesados em Peixes Costeiros Bentonicos da Regiao de Macae, R.J., Brasil. Ecotoxicol. Environ.
Rest., 3, 12 16.
Changcheng, Y., 1984. The prawn (Penaeus orientalis Kishinouye) in Pohai Sea and their fishery. In:
Gulland, J.A., Rothschild., Rothschild, B.J. (Eds.),
Penaeid shrimps- Their Biology and Management.
Fishing News Books / Blackwell Scientific Publication, Oxford press. pp. 49-60.
Cleveland, W. S. 1979. Robust locally weighted regression and smoothing scatterplots. J. American Statistical Association, 74, 829 836.
Eimers, R.D., Evans, R.D., Welbourn, P.M., 2001.
Cadmium accumulation in the freshwater isopod Asellus racovitzai: the relative importance of solute and particulate sources at trace concentrations, Environ Pollut., 111, 247-258.
Eysink, G.G.J., Padua, H.B., Bertoletti, S.A.E., Pereira, D.N., 1988a. Metais pesados no vale do Ribeirae em Iguape Ilha Comprida. R. Ambiente., 2, 6- 13.
Eysink, G.G.J., Padua, H.B., Martins, M.C., 1988b.
Presenca de Mercurio no Ambiente. R. Ambiente., 2, 43 50.
Finney, D.J., 2001. Probit Analysis. 2nd ed. Cambridge:
Cambridge University Press; 1952. Frı´as-Espericueta MG, Voltolina D, Osuna-Lo´pez JI. Acute Toxicity of Cadmium, Mercury, and Lead to White leg shrimp (Litopenaeus vannamei) Postlarvae. Bull.
Environmental Contamination and Toxicolog,. 67, 580-586.
Geard, N., Wiles, J., 2005. A gene network model for developing cell lineages. Artificial Life, 11, 249-67.
Irizarry, R.A., Bolstad, B.M., Collin, F., Cope, L.M., Hobbs, B., Speed, T.P., 2003. Summaries of Affymetrix Gene Chip probe level data. Nucleic Acids Res., 31, e15.
Ki, J.S, Raisuddin, S., Lee, K-W., Hwang, D.S., Han, J.H., Rhee, J-S., Kim, I-C., Park, H.G., Ryu, J-C., Lee, J.S., 2009. Gene expression profiling of copper-induced responses in the intertidal copepod Tigriopus japonicus using a 6K oligochip microarray.
Aquatic Toxicology, 93,177-187.
Kim, S.Y., Yoon, N.N., Ji, H.S., Han, S.M., Kwon, D.M., Lee, K.S., 2010. Characteristics of Ecotoxicity in Industrial Effluent using Daphnia magna. The Annual Report of Busan Metropolitan City Institute of Health & Environment, 20, 131-142.
Kubo, I., 1949. Studies on the penaeids of Japanese and its adjacent water. J. Tokyo College Fish, 36, 393-398.
Landrum, R.F., Robbins, J.A., 1990. Bioavailability of sediment associated contaminants to benthic inver -tebrates. In: Bando R, Giesy J and Muntau H (eds).
Sediments chemistry and toxicity of in-place pollutants, Boston, Lewis Publishers, pp. 237-263.
Lee, D.O.C., Wickins, J.F., 1992. Crustacean Farming.
Blackwell Scientific Publications, Oxford press, pp.
392.
Lee, H.Y., Lee, S.H., 1997. Impacts of Large-scale reclamation on environment in Korea. The Korean Geographical Society, 32, 463-478.
Leu, J-H., Chen, S-H., Wang, Y-B., Chen, Y.C., Su, S-Y., Lin, C.Y., Ho, J.M., Lo, C.F., 2011. A review of the major penaeid shrimp EST studies and the construction of a shrimp transcriptome data based on the ESTs from four penaeid shrimp. Marine Biotechnology, 13, 608-621.
Litchfield, J.T. Jr., Wilcoxon, F., 1949. A simplified method of evaluating dose-effect experiments. J.
Pharmacol Exp Ther., 96, 99-113
Mance, G., 1987. Pollution Threats of Heavy Metals in Aquatic Environments. Elsevier Appied. London, UK. Science Publishers Ltd, pp. 230.
Maroni, G., Lastowski-Perry, D., Otto, E., Watson, D., 1986. Effects of heavy metals on Drosophila larvae and a metallothionein cDNA, Environ Health Perspect., 65, 108-116.
Ministry of Oceans and Fisheries. Statistics of Fisheries Production. www. fips.go.kr [accessed 10 September 2013].
Munshi, A.B., Su, Y.Q., Li, S.J., 1996. Acute toxicities of copper, cadmium and Cu: Cd mixture to larvae of the shrimp Penaeus Penicilliatus. China Journal
of Oenology and Limnology, 14, 170-174.
Papathanassion, E., 1983. Effects of cadmium and mercury ions on respiration and survival of the common prawn Palaemon serratus. (Pennant). Rev.
Inst. Oceanogr. Med., 70, 21-35.
Reynoldson, T.B., 1987. The role of environmental factors in the ecology of tubificid oligochaetes-an experimental study. Holarct Ecol., 10, 241-248.
Schilstra, M.J., Bolouri, H., 2002. Modeling the Regulation of Gene Expression in Genetic Regulatory Networks.
Biocomputation group, University of Hertfordshire.
Sheridan, P.F., Brower, J.A., Powers, J.E., 1984.
Ecological interactions between penaeid shrimp and bottom fish assemblages. In: Gulland, J.A., Rothschild., Rothschild, B.J. (Eds.) Penaeid shrimps- Their Biology and Management. Fishing News Books/Blackwell Scientific Publication, Oxford press, pp. 4235-4253.
Soegianto, A., Charmantier-Daures, M., Trilles, J.P., Charmatier, G., 1999. Impact of Cadmium on the Structure of Gills and Epipodites of the Shrimp Penaeus japonicus (Crustacea: Decapoda). Aquatic Living Resources, 12, 57-70.
Tusher, V.G., Tibshirani, R., Chu, G., 1998. Significance analysis of microarrays applied to the ionizing radiation response. Proc Natl Acad Sci, USA. pp.
5116-5121.
Vohradsky, J., 2001. Neural model of the genetic network. J. Biol. Chem., 276, 36168-73.
Wu, J.P., Chen, H.C., 2004. Effects of cadmium and zinc on oxygen consumption, ammonium excretion, and osmoregulation of white shrimp (Litopenaeus vannamei). Chemosphere, 57, 1591-1598.