• 검색 결과가 없습니다.

Improvement and Application of the ArcGIS-based Model to Estimate Direct Runoff

N/A
N/A
Protected

Academic year: 2021

Share "Improvement and Application of the ArcGIS-based Model to Estimate Direct Runoff"

Copied!
7
0
0

로드 중.... (전체 텍스트 보기)

전체 글

(1)

Improvement and Application of the ArcGIS-based Model to Estimate Direct Runoff

직접유출량 모의를 위한 ArcGIS 기반의 모형 개발 및 개선

Kim, Jonggun

a

⋅Lim, Kyoung Jae

b

⋅Engel, Bernie

c

⋅Cha, Sang Sun

d

⋅ Park, Chan-Gi

e

⋅Park, Youn Shik

f,†

김종건⋅임경재⋅Bernie Engel⋅차상선⋅박찬기⋅박윤식

Abstract

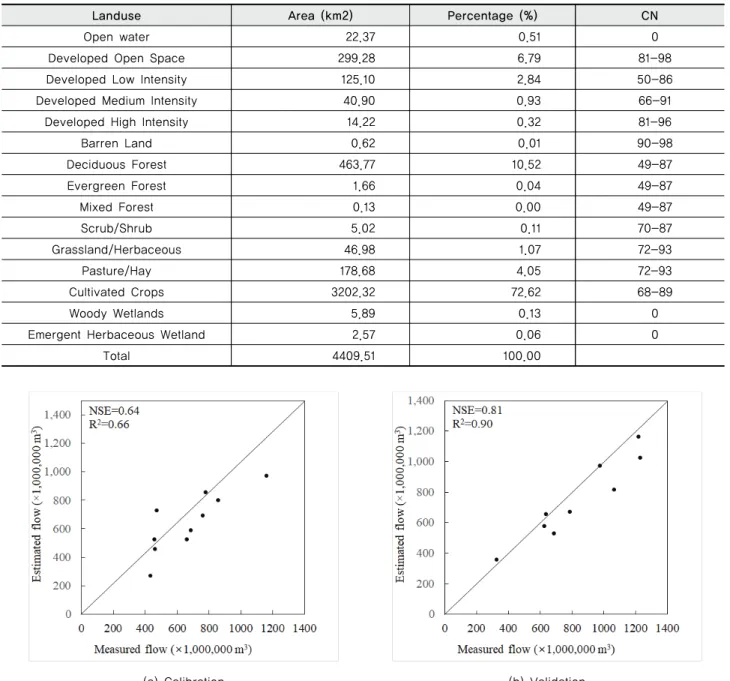
The Long-Term Hydrologic Impact Assessment (L-THIA) model is a quick and straightforward analysis tool to estimate direct runoff and nonpoint source pollution. L-THIA was originally implemented as a spreadsheet application. GIS-based versions of L-THIA have been developed in ArcView 3 and upgraded to ArcGIS 9. However, a major upgrade was required for L-THIA to operate in the current version of ArcGIS and to provide more options in runoff and NPS estimation. An updated L-THIA interfaced with ArcGIS 10.0 and 10.1 has been developed in the study as an ArcGIS Desktop Tool. The model provides a user-friendly interface, easy access to the model parameters, and an automated watershed delineation process. The model allows use of precipitation data from multiple gauge locations for the watershed when a watershed is large enough to have more than one precipitation gauge station. The model estimated annual direct runoff well for our study area compared to separated direct runoff in the calibration and validation periods of ten and nine years. The ArcL-THIA, with a user-friendly interface and enhanced functions, is expected to be a decision support model requiring less effort for GIS processes or to be a useful educational hydrology model.

Keywords: Automated watershed delineation; ArcGIS desktop; curve number; direct runoff; long-term hydrologic impact assessment

Ⅰ. Introduction

Land use changes are influential to hydrologic phenomenon in a watershed; in other words, they result in changes of runoff, streamflow, and groundwater recharge. Urbanization, which is a common landuse change and which increases impervious surfaces, causes increased runoff and shorter time to peak runoff. The increased runoff and shorter time to peak runoff results in not only decreased ground water recharge but also

increased non-point source (NPS) pollutant loads. Furthermore, they contribute to downstream flooding and affect municipal water supplies. Therefore, minimizing the disturbance of urbanization (e.g. low impact development, LID) may be required to ensure safe, stable water supplies. A model to simulate the impact of landuse changes without profound knowledge of the model is needed, which is capable of considering different levels of impact of each landuse, for city managers, planners, and water resource professionals.

The Long-Term Hydrologic Impact Assessment (L-THIA) model has been used to estimate long-term impacts of direct runoff and NPS pollution. L-THIA, requiring a modest effort to prepare input data, estimates runoff using the National Resources Conservation Service - Curve Number (NRCS-CN) method and a pollutant coefficient (Event Mean Concentration;

EMC) approach to estimate pollutant loads (Bhaduri et al., 2000; Choi et al., 2009; Jeon et al., 2013; Kim et al., 2010;

Lim et al., 1999; Pandey et al., 2000; Tang et al., 2005). The NRCS-CN method is an empirical watershed-scale approach to estimate event/daily direct runoff. L-THIA was originally implemented as a spreadsheet application, and was integrated with GIS in ArcView 3 (Lim et al., 1999) and later with ArcGIS 9 (Kim et al., 2009). Lim et al. (1999) developed an L-THIA

a

Postdoctoral Researcher, Department of Regional Infrastructures Engineering, Kangwon National University

b

Professor, Department of Regional Infrastructures Engineering, Kangwon National University

c

Professor, Department of Agricultural and Biological Engineering, Purdue University

d

Department Assistant, Department of Rural Construction Engineering, Kongju National University

e

Professor, Department of Rural Construction Engineering, Kongju National University

f

Associate Professor, Department of Rural Construction Engineering, Kongju National University

Corresponding author

Tel.: +82-41-330-1267 Fax: +82-41-330-1269 E-mail: [email protected]

Received: September 5, 2018

Revised: October 4, 2018

Accepted: October 15, 2018

(2)

web GIS system that communicated with the ArcView GIS tool, which allowed estimation of average annual NPS pollution for 15 pollutants. Kim et al. (2009) improved the L-THIA model performance integrating with SCE-UA which is an optimization technique to auto-calibrate a parameter (e.g., Curve Number) used in the model. The model was applied to the Wildcat Creek Watershed in north central Indiana by Pandey et al.(2000) who showed the landuse changes in the watershed led to significant changes in total average runoff. Tang et al. (2005) applied L-THIA to the Little Eagle Creek (LEC) watershed in Indiana and showed that runoff change by urbanization could be minimized by appropriate planning. The LEC watershed had been significantly urbanized from 1973 to 1997, and the urban growth from 1973 to 1984 was largely commercial and high density residential uses, while most urban growth from 1991 to 1997 was low density residential uses. The increased runoff between 1973 and 1983 was 3.5 million cubic meters (44%

increase) for a 14% increase in urban area in the watershed, while the runoff increased 1.4 million cubic meters (11%

increase) between 1991 and 1997 for a 34% increase in urban area in the watershed. Bhaduri et al. (2000) applied the model to the LEC watershed and found a 19% landuse change from non-urban to urban resulted in a 60% increase of phosphorus and nitrogen loads. Furthermore, a 49% increase in urban area in the watershed resulted in increases of 98% total lead, 92%

total copper, and 93% total zinc loads. Choi et al. (2009) used the L-THIA model for two small watersheds in South Korea, which are the Wol-oe and An-nae watersheds. They used Nash-Sutcliffe coefficient of efficiency index (NSE) and determination coefficient (R

2

) to evaluate the estimated direct runoff by the model. The NSE and R

2

in the Wol-oe watershed were 0.95 and 0.93, and they were 0.81 and 0.71 in the An-nae watershed.

L-THIA has been applied in various watersheds and showed reasonable results, however, an upgrade for L-THIA was required for implementation in the current version of ArcGIS and to provide more options for direct runoff estimation. The L-THIA ArcView 3 system is obsolete due to the age of the GIS tool. The L-THIA in ArcGIS 9 allows use of single location of precipitation gauge station, moreover, it is inconvenient or provides limited access to the model parameters such as CNs in tab-separated file format and predefined dormant/growing season. Further, ArcGIS 9 is no longer supported. Therefore, the objective of the study was to develop L-THIA in ArcGIS

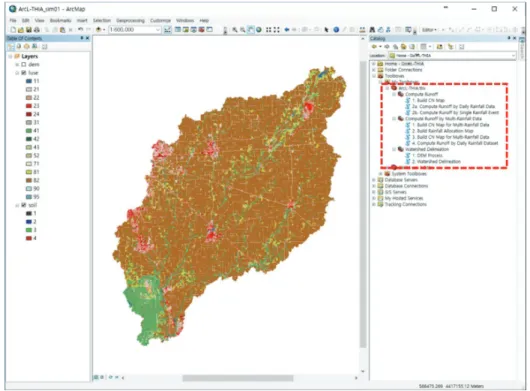
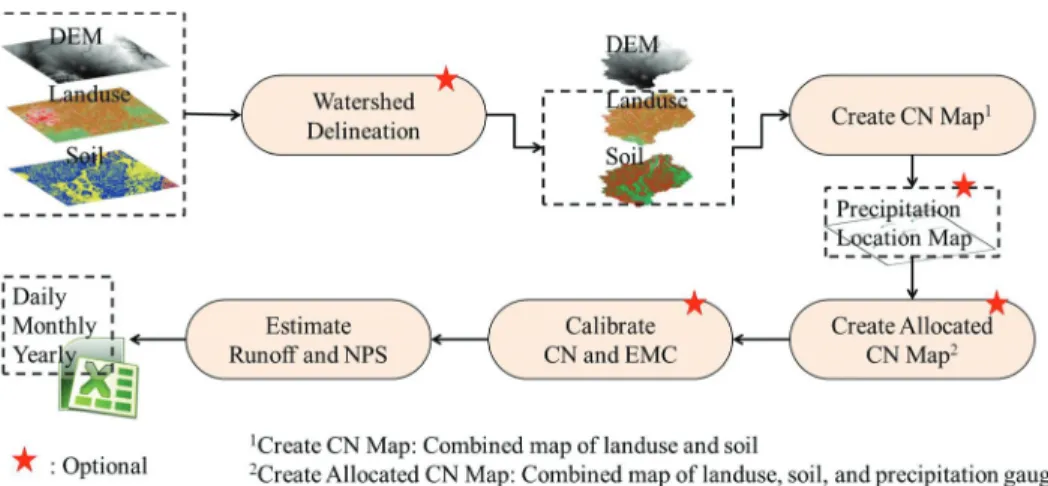
10.0 and 10.1 to estimate long-term direct runoff and NPS loads, considering actual daily precipitation data. The expected purposes of the model were to support decision making and for use as an educational hydrology model. Therefore, it was necessary to maintain an easy-to-use modeling philosophy with a user-friendly interface. In addition, it was required to allow use of multiple precipitation data locations and consideration of antecedent moisture condition to adjust CNs.

Ⅱ. Methodology 1. Runoff Calculation

The NRCS-CN method of the National Resources Conversion Service (formerly Soil Conservation Service) is a simple and widely used method to calculate direct runoff, and has been applied for hydrology and NPS simulation (Garen et al., 2005). The method requires rainfall amount and CN to calculate direct runoff. The CN is based on Hydrologic Soil Group (HSG), landuse, and hydrologic condition (i.e.

Antecedent Moisture Condition; AMC) (Eqs. 1-4).

  

 



for  

(1)

   for ≥ 

(2)

 

(3)

   

(4)

Where, Q is runoff (mm), P is rainfall (mm), Ia is initial abstraction (mm), and S is potential maximum retention after runoff begins (mm).

Initial abstraction is all losses before direct runoff begins, including interception storage on plants, surface storage, evapotranspiration, and infiltration. Initial abstraction could be defined as a percentage of S; it was found to be approximated by Eq. 3 (USDA, 1986). S is related to landuse and HSG through CN ranging from 0 to 100.

Antecedent Moisture Condition (AMC) is related to soil

moisture, AMC I represents dry soil moisture condition (i.e. the

soil moisture content is very low or at wilting point), and AMC

(3)

III represents wet soil moisture condition (i.e. the soils are saturated or the soil moisture content is at field capacity). The conditions are based on the 5-day antecedent rainfall (P

5

, sum of antecedent 5 days precipitation) and growing/dormant season (Table 1).

AMC Description

5-day antecedent rainfall (P

5

) Growing

season

Dormant season AMC I Soils are dry. P

5

< 35mm P

5

< 12mm

AMC II 35 mm ≤

P

5

≤53mm

12 mm ≤ P

5

≤ 28mm AMC III Soils are wet. 53 mm < P

5

28 mm < P

5

Table 1 Classification of AMC

Once AMC is defined, CNs are adjusted (i.e. CN I for AMC I and CN III for AMC III) by Eqs. 5 and 6. AMC adjustment is optional in the ArcL-THIA model. If AMC is not applied, daily runoff is calculated with CN II.

       ×  

(5)

       ×  

(6)

2. Development of ArcL-THIA

ArcL-THIA has been developed as an ArcGIS Desktop Toolsets (Fig. 1) and is programmed in ArcPy and ArcObject.

The model has a user-friendly interface with drop-down menus and buttons. Moreover, it allows easy updates of CN and EMC through a file in comma separated values (CSV) format.

Fundamentally, the model requires landuse and HSG data in raster format to assign CNs, because many spatial data are already in raster format from remote sensing and classification processing (Lim et al., 1999). A Digital Elevation Model (DEM) is required to delineate watersheds in the model (Fig. 2); the watershed delineation step was never provided in previous GIS-based L-THIA versions. The automated watershed delineation is an optional step that employs a series of ArcGIS tools to delineate a watershed using a raw DEM data. The step would be helpful for non-experts in ArcGIS. While DEM data are an optional input in the model, landuse and soil map data are required inputs which are used to assign CNs.

L-THIA computes long-term average annual runoff from long-term and actual precipitation data and focuses on the long-term average impact (Pandey et al., 2000). The model therefore requires daily precipitation data. Moreover, use of a set of precipitation data from multiple gauge locations may be

Fig. 1 Interface of ArcL-THIA

(4)

desirable if the watershed area is large enough to have more than one precipitation gauge station. While an identical value of precipitation on the day is applied for all CNs in a watershed if the watershed has a single gauge station, the allocated precipitation values by the locations of precipitation gauge locations are applied to the CNs in each allocated area if multiple locations are provided by the user. The model creates a CN map using landuse and soil map data for both single and multiple precipitation gauge station cases. It creates another CN map named ‘Allocated CN Map’ (Fig. 2) if the user chooses to use multiple precipitation data. The first CN map has only landuse and soil map information to assign CN, but the

Allocated CN Map has the information of landuse, soil, and the areas allocated by precipitation gauge stations.

The AMC is applied based on dormant/growing season defined by the user, and the runoff is calculated with CN I, II, and III adjusted by Eqs. 5 and 6.

Ⅲ. Application of ArcL-THIA

To demonstrate the direct runoff estimation ability of the model, a watershed named East White River in the Columbus Watershed in east central Indiana (Fig. 3) was selected, Fig. 2 Schematic depicting ArcL-THIA to estimate direct runoff and pollutant loads

Fig. 3 Location of study area and rainfall gauge stations

(5)

extending 39°09’55” to 40°03’31” north latitude and 86°11’20”

to 85°13’20” west longitude. Input datasets (e.g., spatial data, weather, and measured streamflow) has been well established in this watershed for validating the ArcL-THIA model performance for a long-term simulation. The spatial input datasets to delineate the watershed and to assign CN in the study were the 30 m resolution Digital Elevation Model (DEM) from the United States Geological Survey (USGS) National Elevation Dataset, the National Land Cover Dataset 2001 (NLCD 2001)

from USGS, and Soil Survey Geographic Database (SSURGO) from United States Department of Agriculture (USDA). Total watershed area is 4409.51 km

2

, with 72.62 % of the watershed landuse being Cultivated Crops (Table 2). There are seven precipitation gauge stations inside or near the watershed (Fig.

3). Nineteen years of daily precipitation data from 1994-01-01 to 2012-12-31 were collected from the National Climate Data Center (NCDC).

The model estimates direct runoff and therefore the daily

Landuse Area (km2) Percentage (%) CN

Open water 22.37 0.51 0

Developed Open Space 299.28 6.79 81-98

Developed Low Intensity 125.10 2.84 50-86

Developed Medium Intensity 40.90 0.93 66-91

Developed High Intensity 14.22 0.32 81-96

Barren Land 0.62 0.01 90-98

Deciduous Forest 463.77 10.52 49-87

Evergreen Forest 1.66 0.04 49-87

Mixed Forest 0.13 0.00 49-87

Scrub/Shrub 5.02 0.11 70-87

Grassland/Herbaceous 46.98 1.07 72-93

Pasture/Hay 178.68 4.05 72-93

Cultivated Crops 3202.32 72.62 68-89

Woody Wetlands 5.89 0.13 0

Emergent Herbaceous Wetland 2.57 0.06 0

Total 4409.51 100.00

Table 2 Landuse distribution for study watershed

(a) Calibration (b) Validation

Fig. 4 Comparison of measured and estimated flow in calibration and validation

(6)

streamflow from the USGS at the outlet of the watershed was separated into direct runoff and baseflow components using the Web GIS-based Hydrograph Analysis Tool (WHAT)(Lim et al., 2005). The WHAT system was developed by Lim et al. (2005) to separate streamflow into direct runoff and baseflow using three methods (Local Minimum Method, BFLOW filter, and Eckhardt filter). In this study, the Eckhardt filter in WHAT was used to estimate baseflow based BFI(Base Flow Index) which indicates the ratio of baseflow to streamflow considering various aquifer types. The ArcL-THIA was calibrated using the separated direct runoff from 1994 to 2003 and validated using the separated direct runoff from 2004 to 2012. NSE and R

2

were used to evaluate the estimated direct runoff by the model. In annual direct runoff comparisons, the NSE and R

2

for the calibration period were 0.64 and 0.66 (Fig. 4(a)), and they were 0.81 and 0.90 for the validation period (Fig. 4(b)). Santhi et al. (2001) assumed a model performance is acceptable if NSE is greater than 0.5 and R

2

is greater than 0.6. Fig. 4 (a) and (b) display the comparison of measured direct runoff (i.e.

separated direct runoff from measured streamflow) and estimated direct runoff, the estimated annual runoff were close to the measured annual runoff in calibration and validation periods.

Ⅳ. Conclusions

L-THIA is a hydrology model and has been applied in various watersheds to evaluate the impact of landuse change in watersheds. L-THIA with links to ArcView 3 and ArcGIS 9 had been developed previously. However, an upgrade for L-THIA implementation in the current version of ArcGIS was necessary and to provide more options for runoff estimation.

A newer L-THIA was developed in the study to provide enhanced capability in direct runoff estimation.

The first enhancement is that the watershed delineation process is automated in the model as an optional step. The model employs a series of ArcGIS tools to delineate a watershed for the spatial input datasets provided by users. It helps the users not only to delineate a watershed using DEM data but also transforms the landuse and soil maps into watershed forms.

The second benefit is that the model allows use of multiple precipitation data locations. If the watershed area is large enough to have more than one precipitation gauge station, use

of multiple rainfall gauge locations may improve model performance. To consider multiple locations of precipitation gauge stations, the model divides the watershed into areas based on rainfall gauge locations, and then the direct runoff is computed by CNs in each area and the precipitation data allocated to the area.

The third benefit is that the model allows consideration of AMC by dormant/growing season which needs to be adjustable by watershed. AMC to adjust CNs considers soil moisture based on precipitation in the previous five days and dormant/growing season. The model allows change of dormant/growing season for a watershed.

The fourth benefit is that the model provides easy access to the database file for CN and EMC. The database file is in CSV file format which can be conveniently edited with spreadsheet software.

Based on the facts that L-THIA is a quick and straightforward approach to estimate direct runoff and that the ArcL-THIA model has a user-friendly interfaces, it is expected that the model will be a decision support model requiring less effort for GIS processes and less knowledge on hydrology or would be a useful hydrology-educational model(https://npsLab.

kongju. ac.kr). However, the model has a limitation to apply it in a steep slope area due to the limitation of NRCS-CN method. In future, the ArcL-THIA model will be improved to overcome the limitation and provide better model performance.

ACKNOWLEDGEMENTS

This work was supported by Korea Institute of Planning and Evaluation for Technology in Food, Agriculture, Forestry and Fisheries (IPET) through Advanced Production Technology Development Program, funded by Ministry of Agriculture, Food and Rural Affairs MAFRA) (11068-03-3-WT011) and this work was carried out with the support of “Cooperative Research Program for Agriculture Science & Technology Development (Project No. PJ012569032018)” Rural Development Administration, Republic of Korea

REFERENCES

1. Bhaduri, B., J. Harbor, B. A. Engel, and M. Grove, 2000.

Assessing watershed-scale, long-term hydrologic impacts

(7)

of land use change using a GIS-NPS model. Environmental Management 26(6): 643-658. doi:10.1007/s002670010122.

2. Choi, J. W., H. Lee, D. S. Shin, and S. U. Cheon, 2009.

Evaluation of estimated storm runoff and non-point pollutant discharge from upper watershed of Daecheong reservoir during rainy season using L-THIA ArcView GIS model. Journal of Korean Society on Water Quality 25(6):

984-993 (in Korean).

3. Garen, D. C., and D. S. Moore, 2005. Curve number hydrology in water quality modeling: uses, abuses, and future directions. Journal of the American Water Resources Association 41(2): 377-388. doi:10.1111/j.1752-1688.2005.

tb03742.x.

4. Jeon, J., D. K. Cha, D. Choi, and T. Kim, 2013. Spatial analysis of nonpoint source pollutant loading from the Imha dam watershed using L-THIA. Journal of the Korean Society of Agricultural Engineers 55(1): 17-29.

5. Kim, J., B. A. Engel, W. S. Jang, Y. S. Park, J. Park, D.

Shin, S. J. Kim, and K. J. Lim, 2010. Development and application of L-THIA 2009 system for accurate direct runoff estimation in Doam-dam watershed. American Society of Agricultural and Biological Engineers Annual International Meeting. Paper Number: 1000012.

6. Kim, J. J., T. D. Kim, D. H. Choi, K. J. Lim, B. A. Engel, and J. H. Jeon, 2009. L-THIA modification and SCE-UA application for spatial analysis of nonpoint source pollution at Gumho River Basin. Journal of Korean Society on Water Quality 25(2): 311-321 (in Korean).

7. Lim, K. J., B. A. Engel, Y. Kim, B. Bhaduri, and J. Harbor, 1999. Development of the Long Term Hydrologic Impact Assessment (LTHIA) WWW systems. Soil Conversion Organization Meeting, pp. 1018-1023.

8. Lim, K. J., B. A. Engel, Z. Tang, J. Choi, K. S. Kim, S.

Muthukrishnan, and D. Tripathy, 2005. Automated Web GIS-based Hydrograph Analysis Tool, WHAT. Journal of the American Water Resource Association 41(6): 1407- 1416. doi:10.1111/j.1752-1688.2005.tb03808.x.

9. Pandey, S., R. Gunn, K. J. Lim, B. A. Engel, and J. Horbor, 2000. Developing a web-enabled tool to assess long-term hydrologic impacts of land-use change: information technology issues and a case study. Journal of the Urban and Regional Information System Association 12(4): 5-17.

10. Santhi, C., J. G. Arnold, J. R. Williams, W. A. Dugas, R. Srinivasan, and L. M. Hauck, 2001. Validation of the SWAT model on a large river basin with point and nonpoint sources. Journal of the American Water Resource Association 37(5): 1169-1188. doi:10.1111/j.1752-1688.2001.

tb03630.x.

11. Tang, Z., B. A. Engel, K. J. Lim, B. C. Pijanowski, and J. Harbor, 2005. Minimizing the impact of urbanization on long term runoff. Journal of the American Water Resources Association 41(6): 1347-1359. doi:10.1111/j.1752-1688.2005.

tb03804.x.

12. USDA, 1986. Urban hydrology for small watersheds,

Natural Resources Conservation Service, United States

Department of Agriculture.

수치

Fig. 1 Interface of ArcL-THIA
Fig. 3 Location of study area and rainfall gauge stations
Fig. 4 Comparison of measured and estimated flow in calibration and validation

참조

관련 문서

1 John Owen, Justification by Faith Alone, in The Works of John Owen, ed. John Bolt, trans. Scott Clark, &#34;Do This and Live: Christ's Active Obedience as the

As a specific educational method, we proposed the cultural elements teaching model and the model through the learning plan based on the prototype Moran-model, and took

In this study, the kinetic model based on the coupled reaction model was used to investigate the compositions and amount changes among the molten steel, slag and inclusions

The purpose of this study is to use Lucia jig, leaf gauge, and cotton roll among the anterior deprogramming devices being used to induce the centric

○ The calculation model which converts general equilibrium model into computable general equilibrium (CGE) model and then analyzes quantitative effects of

mould with rapid and uniform cooling characteristics using the deposition of the multi-materials based on the direct metal rapid tooling process.. In order

Also, in order to estimate the consequentially colliding relations of the benefits and cost of using location based services, perceived value, security

The duty of the representatives is to examine the financial activities after the fact, and then to feedback with pointing out the wrongs based on the closing accounts.