64-2 / C. Hsieh
• IMID 2009 DIGEST
Abstract
This paper presented an automatic system for display quality measurement by image processing. The goal is to replace human eyes for display quality evaluation by computer vision and get the objective quality review for consumer to make purchase of monitor or TV. Color, contrast, brightness, sharpness and motion blur are the main five factors to affect display quality that could be measured by supplying patterns and analyzing the corresponding images captured from webcam. The scores are calculated by image processing techniques. Linear regression model is then adopted to find the relation between human score and the measured display performance.
1. Introduction
While purchasing a television, most of people go to shops to choose a preferred monitor. They judge the monitor with his/her own eyes without objective methods to measure the quality of monitor or TV. Even manufacturers provide the specifications for consult, the data for each item may look similar. However, the specification measurement is probably different for each manufacturer and the monitor display may look different when they are working.
Usually, the equipments for display quality measurement [1] of flat panel display are expensive and the operations maybe too complicated. End users in general cannot operate it. From the viewpoints of consumers, eager for an easy operation and non-expensive tool [2, 3] to measure display quality of monitor is quite helpful. The developed measurement tool in this paper can also be placed in store for people to evaluate different brand name monitors. The tool is cheap and user friendly.
2. System Architecture
2.1. System Architecture
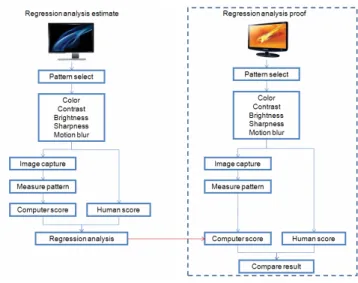
The system architecture is shown in Fig. 1. In order to measure the display quality, we designed several patterns for human and computer to evaluate. The monitor is scored by human for each test items. Then, the same monitor is graded by computer through image grabber and edge detection [4]. Linear regression analysis [5, 6] is adopted to find the relation between human scores and computer scores.
Fig. 1. System diagram.
In order to prove the system feasibility, new monitors are first scored by the developed system and then scored by human. From experimental results, the scores after regression are close to human scores. The error rates are almost under 3.2% and it proves the system performance.
2.2. Color
The first parameter for static measurement is RGB. Display one component of RGB color on the panel. User could manually adjust the darkness on the left side while keep the right side the brightest. Decrease
Automatic Display Quality Measurement by Image
Processing
Bo-Sheng Chen and Chen-Chiung Heish
Dept. of Computer Science and Engineering, Tatung University, JhongShang District, Taipei 104, Taiwan
TEL:886-2-2182-2928#6571, e-mail: [email protected]
64-2 / C. Hsieh
IMID 2009 DIGEST • the scale level of the left side until there is detectable
difference.
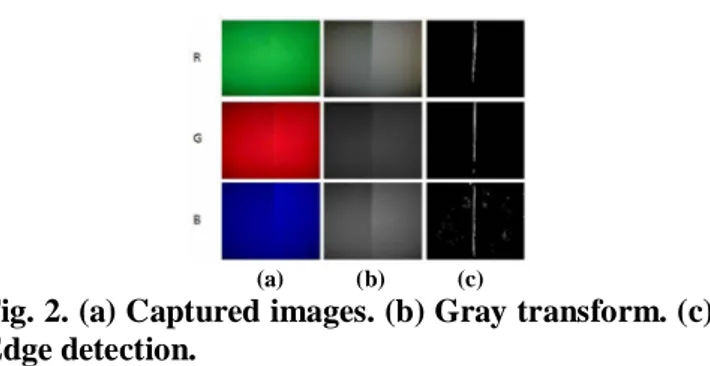
As to automatic measurement, the webcam is aimed at the center of the monitor and the captured image is as shown in Fig. 2(a). The image was firstly transformed to gray scale as shown in Fig. 2(b) for edge detection. The result is as shown in Fig. 2(c). When the edge between both sides can be detected, it means that the webcam can distinguish the difference between the picture’s two sides. Therefore, the gray scale level need not be further decreased in order to detect the edge. The ending gray scale is the highest color performance for this certain webcam.
(a) (b) (c)
Fig. 2. (a) Captured images. (b) Gray transform. (c) Edge detection.
The advantage is that this method will not be affected by the changes of lighting and shadow. The edge is always there regardless of the lighting However, it is much more accurate if the measurement could be conducted in the darkroom to reduce the lighting effects.
2.3. Contrast
The full scaled white pattern (255, 255, 255) is used to test contrast. Contrast [7] is the LCD performance of the maximum RGB level. It is similar to color measurement. Usually, the higher the value is, the better the performance. Bad contrast situation means that the maximum contrast value could not be reached. We show the brightest gray level on the right side and decrease the gray level on the left side if no edge could be detected as shown in Fig. 3. Initially, the left gray level is set to 255. The lower the left gray level is, the lower the contrast ability. If the result of edge detection is not apparent, contrast is not enough. As shown in Fig. 4, line A is early saturated and line C is under saturated. Both situations make color unacceptable. The ideal situation is depicted like line B where each input gray level corresponds to an output gray level and the maximum contrast could be reached.
(a) (b)
Fig. 3. (a) Captured contrast image. (b) Resulting image after edge detection.
Fig. 4. Contrast measurement. Line B is perfect while line A and C are early saturated and under saturated, respectively.
2.4. Brightness
Human eye is sensitive to gray level transformation especially in black area. The full black (0, 0, 0) pattern is used for brightness [8] test. On the contrary of contrast, it tests the monitor’s ability to display the lowest black gray level as shown in Fig. 5. The darkest gray level of line A is above zero of output gray level which makes some dark level unused. As to line C, there are some near dark gray levels all mapped to zero which makes the dark scene all black. Thus, the best mapping is like line B where the darkest gray level maps to zero. The measuring is of the same with RGB and contrast. We adjust the black level on the left side until edge detected as shown in Fig. 6. The higher the starting black gray level is, the worse the brightness ability.
Fig. 5. Level of brightness.
(a) (b)
Fig. 6. (a) Captured brightness image. (b) Resulting image after edge detection.
64-2 / C. Hsieh
• IMID 2009 DIGEST 2.5. Sharpness
The sharpness [9] measurement is conducted by setting up a pattern with interleaved black and white strips. The distance between black line and white line can be adjusted. If the distance is shorter, the monitor is sharper. When a low sharp monitor displays a high sharpness pattern, there will just be a blurred image in the screen.
Initially, the width of black lines and white lines are set to nine pixels. If human can distinguish line edges clearly, decrease the width until picture blurred or flickered. The thinner the width is, the sharper ability of the monitor.
From the webcam captured image as shown in Fig. 7(a), we can count the number of black lines and white lines by scanning the image. Then, the ratio of the number of black lines to the number of white lines is calculated. If the ratio is equal to one, it means the sharpness of current line width is very good. If the ratio is unequal to one, it means some lines are missed. It is due to blurring or flickering effects as shown in Fig. 7(b).
(a) (b) (c)
Fig. 7. (a) Distinguishable black/white line image of a monitor. (b) Non-distinguishable flickering line image. (c) Blurred line image.
2.6. Motion Blur
Motion blur [10] is a very important index for dynamic display quality. Webcam can still be applied to measure the liquid crystal response time. By displaying different moving speed boxes, the response time could be calculated by counting the blurred box area as shown in Fig. 8.
Fig. 8. Captured different moving speed box image.
The first box moves in normal speed and there is almost no blurred area as shown in Fig. 8. The second and third boxes move faster and some blurred area can also be shown in Fig. 8. As to the forth box, it moves too fast to determine the blurring degree. To score the response speed of monitors, we play the same movie clip on each monitor and then the first and third boxes are captured for area comparison. Due to the capturing distance may vary from one to another, the area of the first box are normalized to get the scaling factor which is then used to scale the third box as shown in Fig. 9. The score of motion blur is the area of the third box after normalization.
(a) (b) (c)
Fig. 9. Areas for the first box(a), second box(b), and the third box(c).
3. Experimental results and discussions
(a) (b)
(c) (d)
(e) (f)
(g)
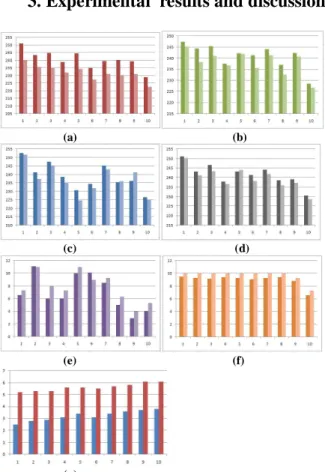
Fig. 10. Evaluation results for (a) R, (b) G, (c) B, (d) contrast, (e) brightness, (f) sharpness, and (g) motion blur.
64-2 / C. Hsieh
IMID 2009 DIGEST • Ten monitors are evaluated by ten persons and the
developed automatic system for each performance index including color, contrast, brightness, sharpness, and motion blur. However, each person may come out with different scores. Therefore, the ten human scores are averaged. On the other hand, each performance index is measured by the system three times. Similarly, the scores from computer are also averaged. Fig. 10(a)-(g) shows these average values for each item. Note that the left bar is human evaluation and the right bar the computer’s.
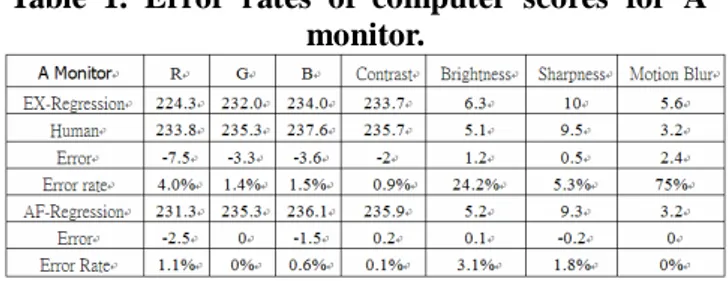
From the above figures, we can find out there are really some gaps between human eyes and computer vision. By using regression analysis, the gaps can be compensated by regression functions. To demonstrate the effectiveness of these functions, another three monitors are first evaluated by computer and the results are mapped by the regression functions to approach human scores. From table 1 to table 3, the error rates for computer estimated scores after regression are all under 3.2% except for brightness of monitor B (8.8%).
Table 1. Error rates of computer scores for A monitor.
Table 2. Error rates of computer scores for B monitor.
Table 3. Error rates of computer scores for C monitor.
4. Conclusions
This paper developed an automatic display quality measurement system by deploying webcam and edge detection. For each test property, we designed a specific pattern for analysis. The characteristic changes with different monitors. By finding the regression functions between human scores and computer scores, we can then use them for display quality measurement. Furthermore, if the human involves in the regression functions are professionals, the system evaluation scores will be more accurate. The more regression samples and more people to score, the more precise the scoring function will be.
In the future, there will be more testing patterns for panel evaluation with regarding to more precise measurement while reducing the inconsistency among human perception. The correlations between human and machine will be improved to a more accurate extent for practical objective reference.
5. References
1. Chroma ATE Inc., Video Pattern Generator.
2. Graphics & Media Lab Video Group, MSU Video Quality Measurement Tool (2005).
3. Ugra, Ugra Display Analysis and Certifcation Tools. 4. J. Canny, “A computational approach to edge detection,” IEEE Trans. Pattern Analysis and Machine Intelligence, Vol. 8, pp. 679-714, (1986) 5. D. V. Lindley, “Regression and correlation
analysis,” New Palgrave: A Dictionary of Economics, Vol. 4, pp. 120–23, (1987)
6. K. Hirai, T. Nakaguchi, N. Tsumura, and Y. Miyake, “Correlation analysis between motion blur width and human perception,” International Display Workshop’07, Sapporo, pp. 1201-1204, (2007) 7. Practical Home Theater Guide, Contrast Ratio and
Video Displays.
8. C. Poynton, Digital Video and HDTV Algorithms and Interfaces, ( 2000)
9. http://www.cambridgeincolour.com, Tutorials: sharpness.
10. H. Pan, X. F. Feng, and S. Daly, “LCD motion blur modeling and analysis,” IEEE International Conference on Image Processing 05, pp. 21–24, Sept. (2005)