Global Production vs. Inventory Supply and
Financial Performance: Evidence from Korean
Multinational Firms
Seungrae LeeSchool of Economics and Trade, Kyungpook National University Seung Jae Park*
School of Business, Ewha Womans University
(Received: May 15, 2016 / Revised: May 28, 2016 / Accepted: May 29, 2016)
ABSTRACT
We analyze how firms’ global production activities affect their inventory supply and financial performance in regards to its production location. For the analysis, we use information on global production quantities of 3,076 Korean multi-national firms that operate business in Europe and Asia through foreign direct investment (FDI) from 2006 to 2013. Our estimation results show that an increase in global production ratio, measured by global production/total produc-tion, decreases inventory supply and financial performance of firms that produce in European countries, while it de-creases financial performance of firms that produce in Asian countries. Although our results indicate that global pro-duction decreases financial performance of firms that produce in Europe and Asia, we find that its negative effects on financial performance are different based on the market demand uncertainty.
Keywords: Global Production, Inventory Supply, Financial Performance * Corresponding Author, E-mail: [email protected]
1. INTRODUCTION
Globalization has allowed firms to make various production location decisions. For instance, Hyundai Motorsproduces its vehicles from seven different for-eign countries as well as in Korea. In particular, Hyun-dai Motors has produced 2,919 thousand vehicles from abroad in 2013, which account for more than 60 percent of its total production (HMG, 2016). Furthermore, its amount of global production keeps increasing. In 2014, the global production has increased 18.6 percent com-pared to that in 2013 and it was recorded as the highest production ever (Park, 2014).
Firms produce in foreign countries for different rea-sons. For example, they produce abroad to take
advan-tage of small labor costs and transportation costs, or to gain access to foreign markets and advanced technology. However, production in foreign countries is usually ac-companied by the significant risks. According to the sur-vey by Accenture, globalization in supply chains can be negatively associated with firms’ financial performances mainly due to the complex logistics, volatile fuel prices and currency exchange rates, consumer preference shifts, and natural disasters (Chopra and Meindl, 2010). Hence, global production may result in a profit or loss.
In this study, we analyze how firms’ global produc-tion activities affect their inventory supply and financial performances. For the analysis, we use information on global production quantities of 3,076 Korean multina-tional firms that operate business in Europe and Asia
through foreign direct investment (FDI) from 2006 to 2013, where the data is obtained from the Export-Import Bank of Korea and Data Guide. Following the previous literature on firm’s global production (Han et al., 2013; Hitt et al., 2006), we estimate the effects of global pro-duction on inventory supply and financial performance by measuring the global production ratio by (global pro-duction/total production); the inventory supply by ((365 ×total inventory)/industry-specific PPI); the financial performance by return on sales (ROS).
In the empirical specifications, we use two separate samples which include firms that locate production in Europe and firms that locate production in Asia. Our estimation results from using a sample of firms that pro-duce in Europe show that an increase in a global produc-tion ratio decreases both inventory supply and financial performance, while its negative effects are more evident in countries where demand uncertainty is low. These re-sults imply that higher production in European countries may be detrimental due to higher labor costs. However, the higher production can be beneficial when demand uncertainty is high since the production facilities are lo-cated near one of the largest markets in the world, which would reduce lead time. Hence, a firm can adjust its pro-duction decisions quickly and global propro-duction would have a positive impact on its financial performance in the long-run.
On the other hand, estimation results from using a sample of firms that produce in Asian countries provide different outcomes. We find that while global produc-tion decreases firm’s financial performance, it is likely to increase financial performance as the firm has more stable market demand. These results imply that, com-pared to the results from European countries, production facilities in Asian countries are used to satisfy stable demand and as market becomes more stable, an increase in production can lead to better financial performance. We also find that inventory supply and financial per-formance have U-shaped relationship regardless of for-eign production location. That is, financial performance may increase when inventory supply is either too high or too low.
To the best of our knowledge, this study is the first to investigate how global production affects inventory supply and financial performance. Our results show that global production and demand uncertainty have differ-ent interaction effects on firm’s invdiffer-entory supply and financial performance in regards to its production loca-tion. In contrast to the common belief, in particular, we provide evidence that firm’s engagement in global pro-duction does not always bring the profits. Instead, ef-fects of global production depend on the location where actual production takes place and its demand conditions.
2. LITERATURE REVIEW
Our study is related to the previous literatures that
analyze the relationship between international diversifi-cation and firms’ performance.1) Findings from resear-chers are mixed. For instance, Vernon (1971) and Kim
et al. (1993) show that international diversification and
firm performance are positively related; whereas, Fatemi (1984) shows a negative relationship. In addition, an in-verted U-shape is used to explain the relationship be-tween international diversification and firms’ perform-ances, see Hitt et al. (1997). We refer Hitt et al. (2006), which provides a comprehensive review in this area.
Among recent studies, our work is closely related to Han et al. (2012) who analyze how firm sales in emer-ging markets are related to its inventory supply and fi-nancial performance. In their empirical analysis, the emer-ging market sales ratio is measured by sales in emeremer-ging markets/total sales, inventory supply by (365×total in-ventory)/cost of goods sold, and financial performances by net income/sales (i.e., return on sales, or ROS) and net income/assets (i.e., return on assets, or ROA). They find that an increase in emerging market sales ratio de-creases firm’s inventory supplies while increasing both ROS and ROA. Although our study is closely related to Han et al. (2012), we focus on examining how inventory supply and financial performances are associated with the global production ratio rather than the global (or emerging) markets sales ratio. Furthermore, while Han
et al. (2012) find that global sales increase firm
perfor-mance, our results provide evidence that global produc-tion may rather decrease firm’s financial performance.
3. ESTIMATION STRATEGY
Global production may increase or decrease firm’s financial performance. Firms make production location decisions in foreign countries to take advantage of small labor costs, transportation costs, inventory holding costs, and import and export taxes. On the other hand, firms so-metimes establish global production platform to absorb superior technology at the expense of large costs that include operational and financial risks, such as complex logistics and currency exchange rates (Hitt et al., 2006; Han et al., 2012).
Production in foreign countries as well as in the home country may increase or decrease firm’s inventory supply. If a production facility is located in a faraway region from customers to exploit low labor costs, it may increase firm’s inventory supply because of an increase in lead time. On the other hand, locating production facility nearby final consumption market, mainly to save transportation costs and import taxes, is likely to de-crease firm’s inventory supply because of a dede-crease in lead time (Chopra and Meindl, 2010).
Here, we use following estimation equations to
1) The international diversification is also referred to as global diversification.
amine how global production affects inventory supply and financial performance:
Inventory_Supply =α0+α1⋅Global_Production +α2⋅Demand_Uncertainty
+α3⋅Global_Production ⋅ Demand_Uncertainty
+α4⋅Exchange_Rate +α5⋅Debt_Cost
+α6⋅Gross_Margin +α7⋅Capital_Intensity +α8⋅Firm_Size + Industry_Effects + Firm_Effects
+ Time_Effects +ε1 (1) Financial_Performance = β0+β1⋅Global_Production +β2⋅Demand_Uncertainty +β3⋅Global_Production ⋅ Demand_Uncertainty +β4⋅Exchange_Rate +β5⋅Inventory_Supply +β6⋅Inventory_Supply_Squared +β7⋅Leverage_Level +β8⋅Capital_Intensity + Industry_Effects + Firm_Effects + Time_Effects +ε2 (2) where
• Inventory_Supply: 365×total inventory (deflated using industry-specific PPI);
• Inventory_Supply_Squared: square of Inven-tory_Supply;
• Global_Production: total production in foreign plants/total production;
• Financial_Performance: net profit/total sales (i.e., return on sales or ROS);
• Demand_Uncertainty: standard deviation of de-trended annual sales during a rolling 3-year period; • Exchange_Rate: real exchange rate of Korea; • Debt_Cost: total interest expenses/total liabilities • Gross_Margin: cost of goods sold/total sales; • Capital_Intensity: capital investment/total sales; • Firm_Size: total sales (deflated using
industry-specific ppi);
• Leverage_Level: total liabilities/total assets; • Industry_Effects: two-digit KSCI industry-specific
dummy variables;
• Firm_Effects: firm-specific dummy variables; • Time_Effects: year-specific dummy variables.
In both estimation equations, we include demand uncertainty in the production location as a control vari-able which reflects market dynamics faced by a firm that produce abroad. While above estimation equations and variables are similar to Han et al. (2012)’s estimation stra-tegy, we consider global production instead of emerging market sales and additionally include currency exchange rate as a control variable that might affect firm’s inven-tory supply and financial performance.
For the empirical analysis, we use dataset that in-cludes information on global production quantities of Korean multinational firms that operate business in Eu-rope and Asia through FDI from 2006 to 2013. This foreign affiliate-level dataset is obtained from the Over-seas Direct Investment Statistics from the Export-Import
Bank of Korea and contains information on individual foreign affiliates owned by Korean firms, such as loca-tion, industry sectors, and account variables. Since our dataset provides the firm identification number for each foreign affiliate, we match foreign affiliates to their par-ent firms and aggregate foreign affiliate accounts by their parent firms for the analysis.
To capture firm activity and performance, on the other hand, we use firm-level data from the Data Guide. This dataset includes all Korean firms that are registered as corporations which are externally audited or publicly traded in the Korean Stock Exchange. It contains infor-mation on account variables of firms that are classified by the five-digit Korean Standard Industrial Classifica-tion (KSIC).
For the estimation, while most of variables in Eq. (1) and Eq. (2) are computed by using information on firm account variables, such as inventory level, debt cost, gross margin, firm size, and leverage level, we use in-formation on foreign affiliate accounts to measure the variables of our interest. In particular, using information on foreign affiliate’s inventory asset and sales, we calcu-late firm’s total production in foreign country as a sum of foreign affiliate’s current sales and net inventory change between current and previous year. We then di-vide foreign production by firm’s total production to obtain global production ratio. To measure demand un-certainty in the foreign production location, on the other hand, we calculate the standard deviation of foreign af-filiate’s de-trended annual sales from their location dur-ing a rolldur-ing 3-year period. For instance, for a firm that makes production at country j in 2013, demand uncer-tainty is computed by the standard deviation of annual sales made by its foreign affiliates in country j during 2010~2013 after controlling for time trends. For our new variable, currency exchange rate, we use data on real ex-change rates of Korea, which is obtained from Bruegel, the Brussels-based Think Tank.2)
To prevent a potential bias that may arise from the extreme values on regression results, we winsorize all variables by replacing high extreme values with 99 per-centiles and low extreme values with 1 percentile. De-scriptive summary statistics for winsorized variables are presented in Table 1.
2) Note that different from the nominal exchange rate, accord-ing to IMF (2016), the real exchange rate measures “the value of a country’s goods against those of another country, a group of countries, or the rest of the world.” In other words, the real exchange rate measures the average real value of a currency compared to multiple countries. For in-stance, Bruegel’s real exchange rates are based on data from 178 countries, Bruegel (2016). We use the real exchange rate due to the fact that our dependent variables (i.e., inven-tory supply and ROS) may be affected by multiple curren-cies because firms can either produce or sell in multiple countries.
Table 1. Descriptive Summary Statistics Mean Standard Deviation Mini-mum Maxi-mum Inventory_Supply 18.63 2.306 12.03 24.74 Financial_Performance -0.0186 0.598 -11.11 1.31 Global_Production 0.0004 0.0042 -0.081 0.2376 Demand_Uncertainty 15.35 1.99 9.74 20.75 Exchange_rate 4.706 0.091 4.52 4.867 Debt_Cost -7.865 3.22 -15.67 -0.281 Gross_Margin 0.47 3.424 -7.591 8.984 Capital_Intensity 0.068 3.319 -8.245 8.403 Firm_Size 21.08 3.319 -8.245 8.403 Leverage_Level -0.821 0.603 -3.918 0.482 Note) All variables represent performance of firms that
pro-duce in Europe and Asia. Inventory_Supply and Firm_ Size are computed in logarithm terms.
4. EXPERIMENTAL RESULTS
Table 2 and Table 3 present the results from esti-mating the effects of global production on firm’s inven-tory level and financial performance by using a sample of firms that locate production in European countries and firms in Asian countries respectively. In all specifi-cations, we include year-, firm-, and two-digit KSIC in-dustry-specific fixed effect to control for unobserved firm characteristics and unobserved systematic differences across time and industry sectors that also may affect inventory supply and financial performance. Robust stan-dard errors clustering for host countries are reported in the parenthesis to control for the possible correlated shocks that might affect all foreign affiliates producing in the same host country.
4.1 Inventory Supply
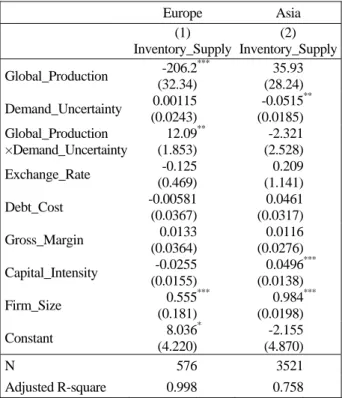
Investigating the effects of global production on firm’s inventory supply in different regions, coefficients in columns (1) and (2) in Table 2 show that inventory supply is negatively and significantly associated with the global production ratio in European countries, while there is no significant relationship between the two vari-ables in Asian countries. Taking into account that Europe is one of the largest markets in the world, these results imply that producing nearby large final consumption market reduces lead time between production and sales which in turn reduces inventory supply of firms. On the other hand, insignificant relationship between global production ratio and inventory supply in Asian countries may be explained by the fact that most of Korean FDI firms in these countries heavily rely on export than local sales. Therefore, production in either Korea or Asian countries may not reduce lead time and inventory supply.
Table 2. Global Production and Inventory Supply
Europe Asia (1) Inventory_Supply (2) Inventory_Supply Global_Production -206.2 (32.34) *** 35.93 (28.24) Demand_Uncertainty 0.00115 (0.0243) -0.0515 (0.0185) ** Global_Production ×Demand_Uncertainty 12.09 (1.853) ** -2.321 (2.528) Exchange_Rate -0.125 (0.469) 0.209 (1.141) Debt_Cost -0.00581 (0.0367) 0.0461 (0.0317) Gross_Margin 0.0133 (0.0364) 0.0116 (0.0276) Capital_Intensity -0.0255 (0.0155) 0.0496 (0.0138) *** Firm_Size 0.555 (0.181) *** 0.984 (0.0198) *** Constant 8.036 (4.220) * -2.155 (4.870) N 576 3521 Adjusted R-square 0.998 0.758
Note) Robust standard errors clustering for host countries are in parenthesis. *, **, *** denote statistically significant at the 10%, 5%, and 1% level, respectively.
Examining the effects of demand uncertainty, we find that coefficient estimates on demand uncertainty in Asian countries is negative and significant. Considering that Asia is one of the largest production platform in the world consisting of countries that are largely different in economic growth and demand risks, negative and sig-nificant coefficient on demand uncertainty in the second column in Table 2 provides evidence that as market de-mand becomes more predictable, firms are likely to ex-ploit economies of scale in that location and increase inventory supplies (Allon and van Mieghem, 2010).
We also estimate the effects of firm’s global pro-duction on inventory supply by considering demand uncertainty in its production location. The coefficient estimate on interaction term between global production and demand uncertainty in the first column is positive and significant, while it is insignificant in the second column in Table 2.This implies that the effects of global production on firm’s inventory supply are significantly associated with demand uncertainty from the production location for firms that locate production in European countries than firms that produce in Asian countries. That is, firms that locate production in European coun-tries are likely to increase their inventory supply as they face unstable market demand in the production location. These results suggest that the high demand uncertainty induces a firm to increase its safety stock not in Korea but in Europe due to the closeness to the market.
4.2 Financial Performance
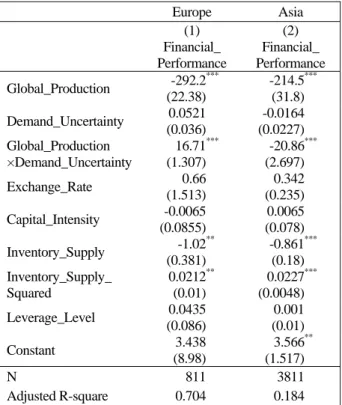
In regards to firm’s financial performance from pro-ducing in different regions, coefficient estimate in the first column in Table 3 indicates that ROS for firms that locate production in European countries is negatively and significantly associated with the global production ratio. It implies that firm’s ROS increases as its global production in European countries decreases, which may be explained by the higher labor costs in these countries compared to that in Korea. While demand uncertainty has insignificant effects, its interaction term with global production ratio has positive and significant effects on firm’s ROS. This implies that negative effects of global production on firm’s ROS are offset by the high demand uncertainty in the production location. In other words, firms are more likely to increase their ROS as they make production in European countries where demand is un-predictable. While most of European countries in our sample incur high labor costs, due to the small lead time between production and sales, firms can make more fle-xible operation decisions than the case when they pro-duce in Korea. Therefore, under the high uncertainty in market demand, locating production nearby large final consumption markets can be profitable.
Table 3. Global Production and Financial Performance
Europe Asia (1) Financial_ Performance (2) Financial_ Performance Global_Production -292.2 (22.38) *** -214.5 (31.8) *** Demand_Uncertainty 0.0521 (0.036) -0.0164 (0.0227) Global_Production ×Demand_Uncertainty 16.71 (1.307) *** -20.86 (2.697) *** Exchange_Rate 0.66 (1.513) 0.342 (0.235) Capital_Intensity -0.0065 (0.0855) 0.0065 (0.078) Inventory_Supply -1.02 (0.381) ** -0.861 (0.18) *** Inventory_Supply_ Squared 0.0212 (0.01) ** 0.0227 (0.0048) *** Leverage_Level 0.0435 (0.086) 0.001 (0.01) Constant 3.438 (8.98) 3.566 (1.517) ** N 811 3811 Adjusted R-square 0.704 0.184 Note) Robust standard errors clustering for host countries are
in parenthesis. *, **, *** denote statistically significant at the 10%, 5%, and 1% level, respectively. In addition, the number of firms in Table 2 and Table 3 are different because we use different control variables (i.e., Debt_ Cost, Gross_Margin, and Firm_Size are only used in Eq. (1) and Leverage_Level is only used in Eq. (2)) and there are more missing values in control variables in Eq. (1) than those in Eq. (2).
Coefficient estimates in the second column in Ta-ble 3 indicate that global production in Asian countries has negative and significant effects on firm’s ROS, which is consistent with firms in European countries. While demand uncertainty does not appear to have significant effects, its interaction term with global production ratio now has negative and significant effects on ROS. In con-trast to the European countries, this implies that negative effects of global production on firm’s ROS are strength-ened by the high demand uncertainty in the production location. In other words, firms are more likely to incur loss on their ROS as they locate production in Asian countries where demand is not stable.
Turning to our control variables, we find a signifi-cant curvilinear association between inventory supply and ROS for firms that locate production in European countries and in Asian countries. The U-shaped relation-ship between inventory supply and ROS in both Euro-pean and Asian countries suggest that ROS may incre-ase when inventory supply is either too low or too high. Considering the significant relationship between global production ratio and inventory supply for firms that lo-cate production in European countries, these results sug-gest that increasing global production in European coun-tries initially decreases firm’s inventory supply and ROS. However, after inventory supply reaches beyond certain lowest point, global production will increase firm’s ROS.
5. CONCLUSIONS
In this study, we investigate how firm’s global pro-duction is related to its inventory supply and financial performance in regards to its production location. Using a sample of firms that locate production in European countries and firms that locate production in Asian coun-tries, we first find that firm’s inventory supply is likely to decrease as the global production ratio increases in European countries. In particular, negative effects of glo-bal production on inventory supply appears to be more evident in countries where market demand is more pre-dictable. Among firms that produce in Asian countries, on the other hand, our results indicate that there is no significant relationship between global production and inventory supply, while market demand uncertainty has significant and negative effects on firm’s inventory supply.
We additionally find that while firm’s global pro-duction significantly reduces ROS, global propro-duction has different effects when market demand uncertainty is considered. Our results suggest that firms that locate production in Asian countries are likely to have a high ROS as they produce in countries where market demand is more stable. For firms that locate production in Euro-pean countries, on the other hand, they are more likely to have a high ROS as they produce in countries where market demand is less stable.
Although this study provides rigorous analysis, se-veral extensions may be possible. Recent free trade
ag-reements (FTAs) among countries have significantly changed the global supply chain. Hence, analyzing the effects of FTAs on global production and financial per-formance may be interesting. Also, considering that firms may influence inventory supply of their own foreign affiliates that operate business abroad through intra-firm trade, it will be interesting to study how global produc-tion is linked to firm’s inventory supply through inven-tory changes in foreign production facilities.
ACKNOWLEDGEMENT
This work was supported by the Ewha Womans University Research Grant of 2016 (No. 1201602960011).
REFERENCES
Allon, G. and J. A. Van Mieghem, “Global dual sourcing: Tailored Base Surge Allocation to Near and Offshore Production,” Management Science 56, 1 (2010), 110-124.
Bruegel (HMG), Real effective exchange rates for 178
countries: a new database, Accessed May 27, 2016,
http://bruegel.org/2012/03/real-effective-exchange-rates-for-178-countries-a-new-database, 2016. Chopra, S. and P. Meindl, Supply chain management,
strategy, planning and operation Pearson, Upper
Saddle River, NJ, USA, 2010.
Fatemi, A. M., “Shareholder benefits from corporate international diversification,” Journal of Finance 39 (1984), 1325-1344.
Han, C., Y. Dong, and M. Dresner, “Emerging market
penetration, inventory Supply, and financial per-formance,” Production and Operations
Manage-ment 22, 2 (2012), 335-347.
Hitt, M. A., R. E. Hoskisson, and H. Kim, “International diversification: Effects on innovation and firm per-formance in product-diversified firms,” Academy of
Management Journal 40 (1997), 767-777.
Hitt, M. A., L. Tihanyi, T. Miller, and B. Connelly, “In-ternational diversification: Antecedents, outcomes, and moderators,” Journal of Management 32, 6 (2006), 831-867.
Hymer, S. H., The international operations of national
firms: A study of foreign direct investment MIT Press, Cambridge, MA, 1976.
Hyundai Motor Group (HMG), Manufacturing, Acces-sed May 2, 2016, http://worldwide.hyundai.com/ WW/Corporate/Network/Manufacturing/index.html, 2016.
International Monetary Fund (IMF), Why real exchange
rate, Accessed May 27, 2016, https://www.imf.org/
external/pubs/ft/fandd/2007/09/pdf/basics.pdf, 2016. Kim,W. C., P. Hwang, and W. P. Burgers, “Multina-tional’s diversification and the risk-return trade-off,”
Strategic Management Journal 14 (1993), 275-286.
Park, J., “Hyundai, global production at record high,”
The Korea Times December 29, 2014.
Rumyantsev, S. and S. Netessine, “What can be learned from classical inventory models? A cross-industry exploratory investigation,” Manufacturing &
Ser-vice Operations Management 9, 4 (2007), 409-429.
Vernon, R., Sovereignty at bay: The multinational
sp-read of U.S. enterprises Basic Books, New York,