As information technology rapidly develops and the period required to enter new technology shortens, there emerges a wide variety of alternatives for consumers. When there are many alternatives in the market, users choose after making comparisons. This process of making comparisons is our research key. We established a research model to find a mixed effect that comes from new attitudes to technology adoption and alternative’s continuous usage intention. The effect is revealed through a relative attractiveness (RA) factor to explain a user’s process of comparison. We empirically test our research model in the new media services, such as mobile TV, web TV, and mobile IPTV. According to our research results, a continuous usage intention of an existing technology is an important factor to explain the adoption of a new technology. So, the contribution of our research is in finding a role for the RA factor in research in new technology adoption.
Keywords: Mobile IPTV, mobile TV, DMB, Web TV, extended technology adoption model, continuous usage intention.
Manuscript received Mar. 19, 2010; revised Aug. 30, 2010; accepted July 13, 2010. Hyori Jeon (phone: +82 42 860 6438, email: [email protected]) and Yonghee Shin (email: [email protected]) are with the Technology Strategy Research Division, ETRI, Daejeon, Rep. of Korea.
Munkee Choi (email: [email protected]) and Jae Jeung Rho (email: [email protected]) are with the Department of Management Science, KAIST, Daejeon, Rep. of Korea.
Myung Seuk Kim (email: [email protected]) is with the Internet Research Laboratory, ETRI, Daejeon, Rep. of Korea.
doi:10.4218/etrij.11.0110.0160
I. Introduction
Information technology (IT) is changing from having a monopoly to a competition-based industrial structure (as it did in the late 1990s) as the technology lifecycle enters maturity. Characteristics of IT industrial change include the appearance of convergence services, the shortening of research and development time, a speed-up of new service entrances, and the expansion of technical similarities. Owing to technology and market changes, an understanding of customer needs is more important than ever in the IT industry. In former days, new technology development in consecutive order caused a step-by-step generational shift of IT services. Customers chose a service or product according to a technology development roadmap. For customers, there was only one new service to choose from. Comparing services was useless in the IT industry. In most cases, a new service was substituted for an old one because it was superior in a certain technological aspect. These days, there are many alternatives in the IT service market. For example, if customers want to watch TV, they must choose one of many similar services, such as terrestrial TV, cable TV, video on demand, mobile TV, and IPTV. To study the IT market under a competitive structure, understanding customer behavior patterns rather than technological superiority will be an important factor [1].
According to earlier studies on the customer adoption of IT technologies, many researchers have used the theory of reasoned action (TRA) and the technology adoption model (TAM). The TRA and TAM models are robust and powerful. TAM is a proper model for studying adoption patterns controlled by technology attributes. However, they have some limitations. One is they do not explain various effective factors, such as emotional, social, and economical ones. The original
User Adoption Model under Service Competitive
Market Structure for Next-Generation Media Services
Hyori Jeon, Yonghee Shin, Munkee Choi, Jae Jeung Rho, and Myung Seuk KimTAM usually focused on technical aspects, such as perceived ease of use. In this case, studies on the extended TAM have overcome the limitation [2], [3]. Another limitation is the research scope is only on one technology. They ignore inter-relations among similar technologies. The original adoption models are not proper to study such market changes. To understand the decision process for user adoption of a new IT service, there is a need to modify the adoption model considering the technology attributes as well as the relation between substitute services as competitors.
In this paper, we suggest a new user adoption model to overcome the second limitation of previous TRA and TAM. Our research model has three stages: continuous usage intention of competitive existing technologies, user choice of the compared relative attractiveness (RA) between new and competitive services, and the adoption of a new service. Comparing a decision process structure between technologies is a major difference from previous adoption models. The paper is organized as follows. First, we analyze mobile IPTV adoption. Next, we forecast a market construct using our suggested research model. Finally, we obtain the implications from the empirical study.
II. Limitations of Previous Adoption Studies
When a new technology emerges in the market, customers will either adopt it or not. In cases when a new technology completely replaces an existing one, we only study the independent user adoption effect of the new one. These days, many IT service cases are not perfect substitutes. Most services are under competition with similar ones that give customers the same utility. In these cases, customer choice is more complicated. We explain this situation using a customer decision process model with a network effect in Fig. 1 [4], [5]. When a new technology emerges in a competitive market with similar technologies, there are two possible consumer choices: adoption of the new technology, including a transition period, or retaining the previous technology. Consumers compare the utility of the previous technology with that of the new one. If the utility of the previous technology is better, customers will choose to retain it. If the utility of the new technology is better, customers will choose to transition to that new technology.
The results of a reviews on user adoption regarding TRA [6], TAM [7], and extended TAM [2] models only explain user choice and the adoption of a new service. They do not consider the step of retaining an original service. Other research models such as the expectation confirmation paradigm (ECP) and information service post adoption model (IS-PAM) [3], [8]- [10] explain the continuous usage intention of old services. These earlier studies do not fully consider the relationship
Fig. 1. Customer choice decision process.
Old
technology technology New
Substitution Retention Quit Quit 1 2 Adoption 1' Adoption
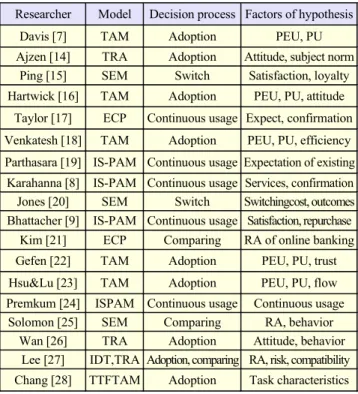
Table 1. Literature review of adoption and post adoption.
Researcher Model Decision process Factors of hypothesis
Davis [7] TAM Adoption PEU, PU
Ajzen [14] TRA Adoption Attitude, subject norm
Ping [15] SEM Switch Satisfaction, loyalty
Hartwick [16] TAM Adoption PEU, PU, attitude
Taylor [17] ECP Continuous usage Expect, confirmation
Venkatesh [18] TAM Adoption PEU, PU, efficiency
Parthasara [19] IS-PAM Continuous usage Expectation of existing Karahanna [8] IS-PAM Continuous usage Services, confirmation
Jones [20] SEM Switch Switchingcost, outcomes
Bhattacher [9] IS-PAM Continuous usage Satisfaction, repurchase
Kim [21] ECP Comparing RA of online banking
Gefen [22] TAM Adoption PEU, PU, trust
Hsu&Lu [23] TAM Adoption PEU, PU, flow
Premkum [24] ISPAM Continuous usage Continuous usage
Solomon [25] SEM Comparing RA, behavior
Wan [26] TRA Adoption Attitude, behavior
Lee [27] IDT,TRA Adoption, comparing RA, risk, compatibility
Chang [28] TTFTAM Adoption Task characteristics
between new and old services in their description of adoption. According to [11], users adopt a new service based on past experience using similar services. The adoption of a new one or retention of an old one are not completely distinct factors. Therefore, we suggest a new model which considers both. The decision process is revealed by examining the RA of both options [12], [13]. So, we review previous studies on technology adoption, continuous usage, IS satisfaction, and switching due to an alternative’s attractiveness.
III. Research Scope and Model
1. Research Scope: Mobile IPTVWhen a customer considers adopting a new technology, they evaluate the various alternatives of the new technology as shown in Fig. 1. After they compare alternatives, they choose. So, our research scope should explain this decision process. To achieve this end, our research requires the following criteria.
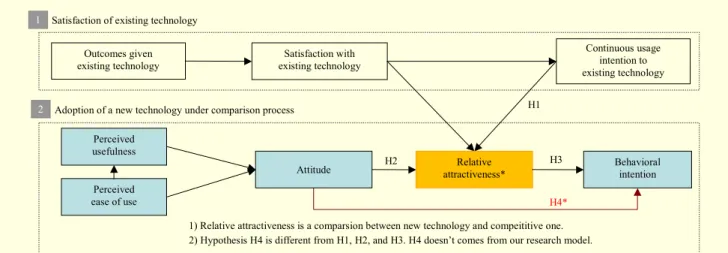
Fig. 2. User adoption model under a competitive market structure.
Outcomes given
existing technology existing technology Satisfaction with
Continuous usage intention to existing technology Satisfaction of existing technology
Adoption of a new technology under comparison process
1 2 Perceived usefulness Perceived ease of use
Attitude attractiveness* Relative Behavioral intention
1) Relative attractiveness is a comparsion between new technology and compeititive one. 2) Hypothesis H4 is different from H1, H2, and H3. H4 doesn’t comes from our research model.
H2
H1
H3
H4*
First, consumers must regard new and existing technologies as similar. They must also be included in one market. For the many competing services, the customer’s decision process will be useful. When technologies are part of a different market, customers need not hesitate about their choice of technology. Second, the new technology must successively enter a market. The newer technology is better than the older technology in the technical aspect. New technology gives users expanded functionality and a high quality service level, so we focus on the adoption of new technology. When the research scope meets these two requirements, we can verify our research model and the effect of the RA of the alternatives.
New TV media technology is a useful area to exemplify our requirements.1) First, it is included in the same mobile media
market. Second, the order of entering the market is time- dependent and the new technology will offer more utility than that offered by older types. For example, mobile and web TV are existing technologies. Mobile IPTV is a new one. There is great diversity in the contents and value added services in Mobile IPTV [29].
Also, TV media is a proper research area because it provides a popular service to customers. Technology related to TV media became popular because of its ease of use and universal utility as an information and entertainment provider for users. Because of this, respondents replied to our questionnaire accurately when we surveyed them on mobile media services.
In the following section, we analyze the user adoption of mobile IPTV in a mobile media market using the research model shown in Fig. 2. The empirical study gives two examples of a study of mobile IPTV adoption considering user
1) New TV media services are mobile TV, web TV, and mobile IPTV. In the past, TV only was aired. Now, TV is broadcast on the Internet or mobile network. Mobile TV is a service which allows cell phone owners to watch TV. In Korea, mobile TV is called as DMB. Web TV is supplied on Internet. Mobile IPTV is media service delivered through the mobile device via IP.
satisfaction regarding mobile and web TV. 2. Research Model
The basic idea of our research model as shown in Fig. 2 is that users compare the utility of alternatives, and we explain the entire process of user choice according to the model shown in Fig. 1. RA is a key factor between in a comparison of alternatives. Our research model has two parts. First, we analyze the adoption of a new technology with an attitude factor. Second, we analyze the intention to retain an existing technology with satisfaction and continuous usage intention factors. This shows the user comparison decision process. Finally, a user decides to choose a new technology or not according to the results of its RA [12], [13], [15], [20], [25], [30].
A framework of new technology adoption is based on TAM [22], [31], [32]. In this research, we insert the RA factor into a space between attitude and behavioral intention (BI). The idea used in designing our research model is that a customer’s real purchase action will be jointly affected by his/her attitude regarding new and existing technologies. According to the user decision step, the analyzed factors are presented in chronological order.2) One more theoretical approach is to
differentiate between attitude and BI. In previous studies of TAM, some results did not divide the effects of attitude and BI. Researchers thus deleted the BI factor. It’s called a simplified TAM [33]. This is also a limitation of TAM research. We expect that an RA factor will act as a parameter to clearly separate the two factors.
We analyze user satisfaction and continuous usage intention
2) The order of a decision process is as follows: i) consider the satisfaction for an existing technology, ii) consider the attitude toward a new technology, iii) compare the two technologies, and iv) decide whether or not to adopt the new one.
of an existing technology by using a modified ECP or IS-PAM [9], [22], [31].
IV. Research Hypotheses
Firstly, we frame three hypotheses (H1, H2, and H3) to solve our research model and add one hypothesis (H4) to compare with hypotheses which belong to the research model and original TAM as depicted in Fig. 2. Studies on user adoption have tended to investigate an individual’s decision to initially adopt a new technology. Less attention has been paid to a post adoption environment where individuals decide between continuing and discontinuing the used technology [9], [32]. Owing to the significant influence of continued usage on the long term viability of a technology, it is important to study the post adoption [8], [9], [24], [32]. According to [3], [10], [12], the outcomes and satisfaction directly affect a continuous usage intention of users. After we consider the relationships among outcomes, satisfaction, and continuous usage intention,3) we set
up a hypothesis H1:
H1. Continuous usage intention for existing technology
negatively affects RA.
H1 will be shown the effect of existing technology adoption and it will affect RA.
This paper assumes when choosing a new technology, the user compares the utility of the new technology with an existing one [4], [8], [13], [25]. The parameter factor is the RA, which indicates whether the new technology is better than the existing one. It has a close relation with satisfaction and continuous usage intention [30], [34]. Satisfaction of an existing technology affects the RA of a new one and has an indirect effect through continuous usage intention [20]. If a user can continue using an old technology, they don’t feel the attractiveness of a new one. Considering the influence of two factors, satisfaction and continuous usage intention, the factor of continuous usage intention is more deeply involved with RA [20]. According to studies on RA in the online banking and retail service, a continuous usage intention affects the RA of alternatives [22], [35]. By our assumption, if a new technology is more attractive, the RA positively affects the BI of the new one. When there is a useful and attractive alternative, a user stops paying for the existing one [13] and adopts a new one [15], [21], [27]. After we consider these relationships,4) we set
up hypothesis H2 and H3:
3) We will examine the satisfaction←outcomes, outcomes←continuous usage intention in model testing and show results in Table A4 in appendix.
4) In this step, we also examine the PU←PEU, A←PU, and A←PEU; only we don’t make hypotheses of these relationships in this paper. However, we will verify these relationships and show the testing results in Table A4 in appendix.
H2. Continuous usage intention for an existing technology
negatively affects RA.
H3. RA positively affects BI.
Our hypotheses will be direct indications of the comparison process between new and existing technology’s utilities. H1 is derived from attitudes towards new technology. H2 is derived from attitudes towards existing technology. H3 is a final decision to adopt a new one after considering two technologies. H4 is different from the others. H4 comes from original TAM, not our research model. We do another analysis to prove H4 by making another model which has perceived usefulness (PU), perceived ease of use (PEU), attitude, and BI constructs. It is used as a standard to compare the difference between TAM and our research model. H3 is the intention of buying new technology by considering another technology’s attractiveness. H4 is the independent effect of new technology’s adoption. Considering the difference effect between H3 and H4, it could mean the effect of RA.
H4. Attitude toward using new technology affects behavioral
intention in original TAM.
V. Results
1. Survey: Data Collection and Measurement
We want to obtain the different adoptive patterns5) of mobile
IPTV considering the competition between mobile and web TV. To verify the search model, we conducted an online survey (www. pollever.com) from the May 5 to June 15, 2007. There were a total of 1,069 respondents, consisting of potential mobile IPTV users who had experience using the Internet, NGN, DMB, and video-on-demand. Our survey had several questions that dealt with a comparison of technologies. Thus, we permitted the 1,069 potential users to duplicate their answers if they had experience using more than one technology. Finally, we obtained 677 users of mobile TV and 902 users of web TV. Table 2 explains the general profiles of the respondents. In the next analysis, we deal with sample data divided into two groups, users of mobile TV and web TV.
The research questionnaire had eight constructs: outcomes (5 questions), satisfaction (5 questions), continuous usage intention (3 questions), PU (6 questions), PEU (4 questions), attitude (6 questions), RA (5 questions), and BI (3 questions). The questionnaire used a seven-point Likert scale ranging from ‘disagree strongly’ (1 point) to ‘agree strongly’ (7 points). The
5) When we studied an adoption model of mobile IPTV, the adoptive patterns varied among different user experiences of services. Our previous study [36] shows there is a moderator effect to adopt mobile IPTV service. This effect is caused by different user experiences.
Table 2. Sample profile. Mobile TV Web TV Male 429 534 Gender Female 248 368 ~19 10 15 20 to 29 193 267 30 to 39 294 384 40 to 49 133 171 Age 50~ 47 65 Non-economic activity 133 213 Occupation Economic activity 544 705 ~ $3,200 537 740 Finance status (monthly) $3,200~ 140 162
questionnaire in Table A1 in appendix was developed to explore the relative importance of constructs based on a synthesis of previously published investigations, which were revised and extended as appropriate for the current topic. We showed a technology demonstration program before the questions were answered in order to help the respondents understand the new technology of mobile IPTV.
SPSS Windows 15.0 and AMOS 7.0 as a statistic package are used for analysis. We followed the two-stage methodology of [37], that is, we examined a measurement model to measure the convergent and discriminant validity in Tables A2 and A3 in the appendix, and we verified the structural model to analyze the strengths and directions of the hypotheses.
2. Analysis of Measurement Model
The authors in [38] suggest using both an exploratory factor analysis (EFA) and a confirmatory factor analysis (CFA) for assessing the construct validity. Cronbach’s alpha scores from the EFA analysis indicate that each construct has strong internal reliability. There are three criteria that verify the convergent validity using CFA [39]: standardized factor loading should significantly exceed 0.6, construct reliabilities should exceed 0.8, and average variance extracted (AVE) per construct should exceed the variance due to the measurement error of the construct [40]. All of the factors in our research results exceed 0.8 because at over 0.9, the AVE values are high. Another criteria used is a squared multiple correlation (SMC)>0.5 based on [41]. In the model, SMC values of most items exceed 0.5, and the highest value is 0.81. The two cases have a similar data
pattern. We eliminated two items of the questionnaire, PU1 and PU5, which were below 0.5. All values in the CFA of the measurement model exceed 0.5 and are significant at p=0.001. AVEs ranging from 0.90 to 0.97 are greater than the variance. Therefore, all conditions used to verify convergent validity are met. The discriminant analysis means the extent to which one concept and item’s indicators differ from another concept and item’s indicators [40]. To analyze the discriminant validity, the correlations between items in any constructs should be lower than the square root of the AVE [39]. All values of correlations are lower than the square root of the AVE, as our measurement model satisfies the construct validity. The analysis results of the measurement model are shown in Tables A2 and A3 in the appendix.
3. Analysis of Structural Model: Hypothesis Testing
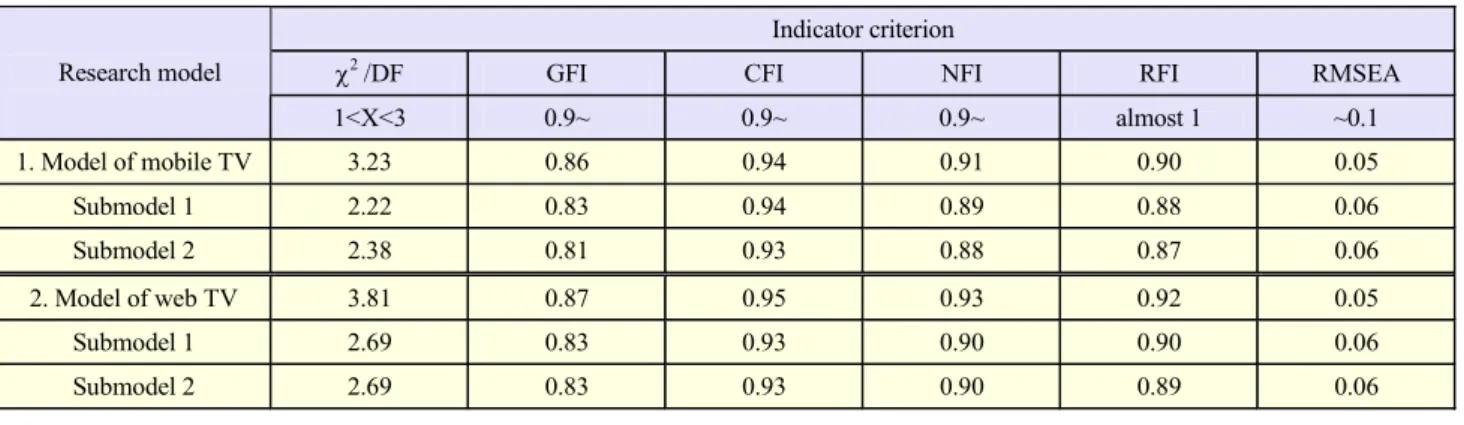
Before testing the hypotheses, we first prove the feasibility of our research model. A popular proof method in SEM analysis is to verify and compare submodels 1 and 2, which have the same hypothesis structure but with different samples. The data of the submodels are chosen randomly. After dividing the samples into two parts, we compare the analysis results of the submodels with one of the original models. If we obtain the same results, we can be convinced of the appropriateness of our research model. We have two original models. To verify the two research models, each original model has two submodels. In total, we examine the feasibility of six models, which are shown in Table 3. In this paper, the indicators of model fitness used are a lower ratio of chi-square to the degree-of-freedom (χ2/df),6) goodness-of-fit
index (GFI), comparative fit index (CFI), normed fit index (NFI), relative fit index (RFI), and root mean square error of approximation (RMSEA).
The six examined models have almost the same patterns of model fit. Most model fit indicators are appropriated to show a good model in CMIN/DF, CFI, NFI, RFI, and RMSEA. In the result, although a chi-square test in the original model is higher than the submodels due to its tendency to be sensitive to the sample size, all of the indicators are generally proper. When we decide to confirm the structural model in Fig. 2, various indicators are considered together. The values of the GFI indicator are around 0.8, which is under the criterion level of 0.9. However, a level of 0.8 is acceptable in social behavioral studies [42]. As a result, our research model and data analysis results explain mobile IPTV adoption and the effect of the RA factor. Second, we want to prove the validity of using the RA factor to explain the user decision process in Fig. 1.
6) It is an absolute criterion, which shows the proper relationship between model and data. Other criteria such as GFI, CFI, and NFI are relatively unimportant.
Table 3. Results of structural modeling analysis.
Indicator criterion
χ2 /DF GFI CFI NFI RFI RMSEA
Research model 1<X<3 0.9~ 0.9~ 0.9~ almost 1 ~0.1 1. Model of mobile TV 3.23 0.86 0.94 0.91 0.90 0.05 Submodel 1 2.22 0.83 0.94 0.89 0.88 0.06 Submodel 2 2.38 0.81 0.93 0.88 0.87 0.06 2. Model of web TV 3.81 0.87 0.95 0.93 0.92 0.05 Submodel 1 2.69 0.83 0.93 0.90 0.90 0.06 Submodel 2 2.69 0.83 0.93 0.90 0.89 0.06
Table 4. ANOVA test: models without or with RA factor.
Model R2 F change DF1 DF2 Sig. F
change Without RA 0.802 Mobile TV With RA 0.813 405.224 3 673 0.000 Without RA 0.809 Web TV With RA 0.823 566.434 3 898 0.000
The ANOVA method is used when comparing research models with and without an RA factor. There is a sound difference in the results of the ANOVA test.
The case of employing an RA factor has the higher explanation power because of raising the R2.
Based on the ANOVA test results for mobile TV, web TV and mobile IPTV, we conclude that RA is a proper measure factor for studying a new technology adoption.
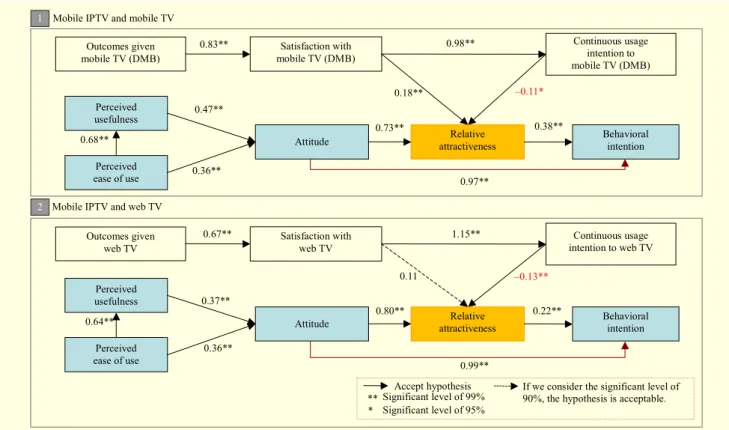
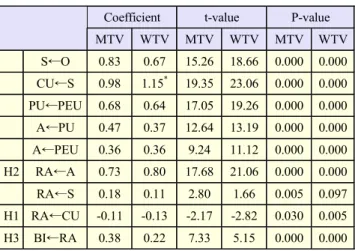
Now, we test our hypotheses using the suggested model and analyze the data according to an SEM approach. Figure 3 presents the results of the structural model. If we consider the significant level of 90%, all hypotheses are acceptable in the cases of mobile TV and web TV. Most hypotheses are accepted with significant levels of over 99%. Table 5 shows the coefficient and significance of all hypotheses in detail. The interesting element is H3. In the mobile and web TV cases, H3 is accepted. H3 means the BI considering the existing technology. According to H3 testing, there are three findings related with RA.
The first finding is the effect of RA. The continuous usage intention of existing technology affects RA. The higher the effect of continuous usage is, the lower the effect of RA. Before hypotheses testing, we expect mobile IPTV will compete with mobile and web TV because the services are in
same market. After testing, we confirm that users have the intention to transit mobile and web TV to mobile IPTV. The one reason we infer this is based on the service similarity of mobile TV, web TV, and mobile IPTV. These are based on TV content. Users definitely know that new technology is better than existing technologies. Thus, users who have experience with mobile and web TV can easily adopt the new better service of mobile IPTV. When we compare between H3 (BI←RA) and H4 (BI←A), the phenomenon is explained clearly. H4 is an independent effect of the adoption of a new technology. H3 is the intention of buying a new technology when considering the other technology’s attractiveness. The difference between H3 and H4 would equal the effect of RA. The coefficients of H4 in mobile TV and web TV cases are very similar. However, the coefficients of H3 are significantly different. After comparing existing technologies, users changed their attitude. If researchers study mobile IPTV adoption with the original TAM, they will probably obtain the result of an aggressively positive user adoption pattern. They don’t know the gap between the research in TAM and a real market.7) Most
likely, their estimation of TAM will be too high. This point is our contribution to user adoption studies. We find a way to correct exaggerated effects that are occasionally found in previous TAM studies.
The second finding is the RA factor’s role as a mediator between attitude and BI. In prior studies, there is a problem in not definitely classifying attitude and BI because of the similarity between the two factors. Researchers chose one of two factors and made the research model called simplified TAM. However, if the RA factor is employed as a mediator, the problem is solved. The two factors retain their respective meanings due to the employment of RA in the research model.
7) ‘Research’ is the study of the effect of new technology adoption. ‘Real market’ means users choose a new technology through comparing alternatives. The gap is explained in the difference between H3 and H4 in mobile and web TV cases.
Fig. 3. Results of comparison of mobile IPTV with mobile and web TV.
Outcomes given
mobile TV (DMB) mobile TV (DMB) Satisfaction with
Continuous usage intention to mobile TV (DMB) 0.83** 0.98** Perceived usefulness Perceived ease of use
Attitude attractiveness Relative Behavioral intention 0.47**
0.36**
0.68** 0.73**
–0.11*
0.38**
Mobile IPTV and web TV
2
Mobile IPTV and mobile TV
1
Accept hypothesis ** Significant level of 99% Outcomes given
web TV Satisfaction with web TV
Continuous usage intention to web TV 0.67** 1.15** Perceived usefulness Perceived ease of use
Attitude attractiveness Relative Behavioral intention 0.37** 0.36** 0.64** 0.80** –0.13** 0.22** * Significant level of 95% 0.18** 0.11 0.97** 0.99**
If we consider the significant level of 90%, the hypothesis is acceptable.
Table 5. Results of hypothesis testing.
Coefficient t-value P-value
MTV WTV MTV WTV MTV WTV H1 RA←CU –0.11 –0.13 –2.17 –2.82 0.030 0.005
H2 RA←A 0.73 0.80 17.68 21.06 0.000 0.000
H3 BI←RA 0.38 0.22 7.33 5.15 0.000 0.000
H4 A←PU 0.97 0.99 26.54 19.19 0.000 0.000
The third finding is that market researchers need to analyze a market competitive structure through studying the relation with a substitute. Most methodologies are based on time series market data. For this reason, it will be impossible to foresee a market structure for new services. However, our research model shows that it can define the competitive relationship of new technologies without market data.
From managerial findings, we can state that mobile and web TV users will transfer to mobile IPTV. The reason for this is that mobile IPTV will be in an absolutely superior state than mobile and web TV in technical and content aspects [43]. In other words, the existing TV services do not provide abundant utility to users. For example, mobile IPTV has an interactive attribute and various data services, but mobile TV has only TV
programming content. Web TV does not have mobility. Furthermore, it has limited content and lower-quality service. If service providers of mobile and web TV want to defend the market size, they must make market strategies to differentiate them selves from mobile IPTV.
VI. Conclusion
Most technology adoption research lacks proper models to explain the relation between new and existing technologies, because they verify the factors of technical attributes. Although the relation among competitive technologies is a very important factor to decide whether to adopt a new technology, it has been neglected in studying a technology adoption model. In this paper, we created a research model including a user comparison decision-process with an RA factor and obtained new findings through our empirical study to solve our research questions.
We hope that future research will be used to show that these implications are genuinely meaningful in a real market when comparing the results of our research model and customer choice probability of new and existing technologies. If this study succeeds, our research model will be verified as a useful methodology to explain a new technology adoption under a competitive market environment.
VII. Appendix
Table A1. Questionnaire items.
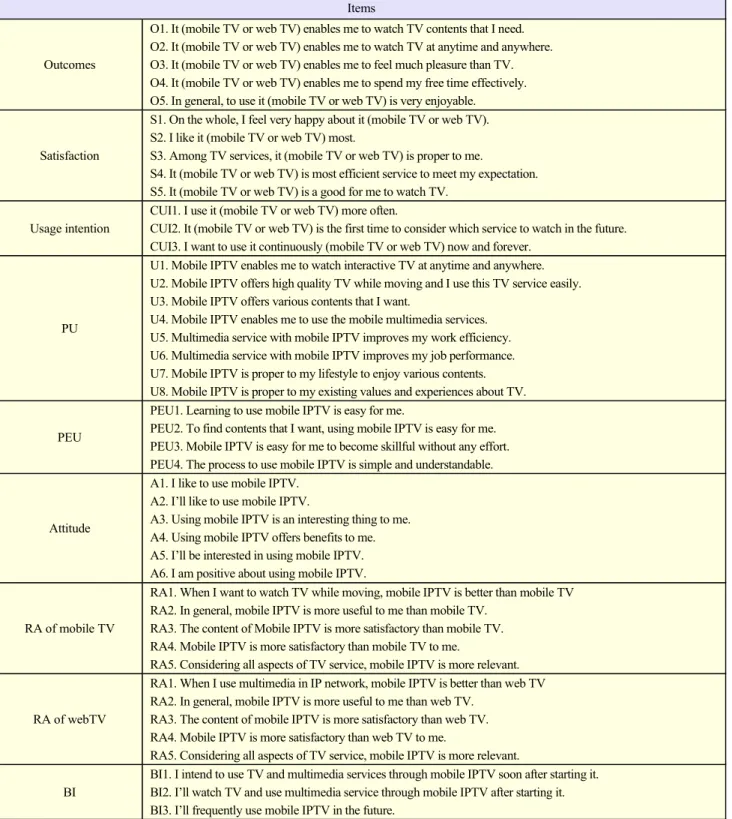
Items
Outcomes
O1. It (mobile TV or web TV) enables me to watch TV contents that I need. O2. It (mobile TV or web TV) enables me to watch TV at anytime and anywhere. O3. It (mobile TV or web TV) enables me to feel much pleasure than TV. O4. It (mobile TV or web TV) enables me to spend my free time effectively. O5. In general, to use it (mobile TV or web TV) is very enjoyable.
Satisfaction
S1. On the whole, I feel very happy about it (mobile TV or web TV). S2. I like it (mobile TV or web TV) most.
S3. Among TV services, it (mobile TV or web TV) is proper to me.
S4. It (mobile TV or web TV) is most efficient service to meet my expectation. S5. It (mobile TV or web TV) is a good for me to watch TV.
Usage intention
CUI1. I use it (mobile TV or web TV) more often.
CUI2. It (mobile TV or web TV) is the first time to consider which service to watch in the future. CUI3. I want to use it continuously (mobile TV or web TV) now and forever.
PU
U1. Mobile IPTV enables me to watch interactive TV at anytime and anywhere. U2. Mobile IPTV offers high quality TV while moving and I use this TV service easily. U3. Mobile IPTV offers various contents that I want.
U4. Mobile IPTV enables me to use the mobile multimedia services. U5. Multimedia service with mobile IPTV improves my work efficiency. U6. Multimedia service with mobile IPTV improves my job performance. U7. Mobile IPTV is proper to my lifestyle to enjoy various contents. U8. Mobile IPTV is proper to my existing values and experiences about TV. PEU
PEU1. Learning to use mobile IPTV is easy for me.
PEU2. To find contents that I want, using mobile IPTV is easy for me. PEU3. Mobile IPTV is easy for me to become skillful without any effort. PEU4. The process to use mobile IPTV is simple and understandable.
Attitude
A1. I like to use mobile IPTV. A2. I’ll like to use mobile IPTV.
A3. Using mobile IPTV is an interesting thing to me. A4. Using mobile IPTV offers benefits to me. A5. I’ll be interested in using mobile IPTV. A6. I am positive about using mobile IPTV.
RA of mobile TV
RA1. When I want to watch TV while moving, mobile IPTV is better than mobile TV RA2. In general, mobile IPTV is more useful to me than mobile TV.
RA3. The content of Mobile IPTV is more satisfactory than mobile TV. RA4. Mobile IPTV is more satisfactory than mobile TV to me.
RA5. Considering all aspects of TV service, mobile IPTV is more relevant.
RA of webTV
RA1. When I use multimedia in IP network, mobile IPTV is better than web TV RA2. In general, mobile IPTV is more useful to me than web TV.
RA3. The content of mobile IPTV is more satisfactory than web TV. RA4. Mobile IPTV is more satisfactory than web TV to me.
RA5. Considering all aspects of TV service, mobile IPTV is more relevant. BI
BI1. I intend to use TV and multimedia services through mobile IPTV soon after starting it. BI2. I’ll watch TV and use multimedia service through mobile IPTV after starting it. BI3. I’ll frequently use mobile IPTV in the future.
References
[1] S.W. Kang, S.S. Cho, and H.Y. Lie, “The Economic Value of
Next-Generation Converged Communications and Broadcasting Services,” ETRI J., vol. 27, no. 6, Dec. 2005, pp. 759-767. [2] V. Venkatesh and F.D. Davis, “A Theoretical Extension of the
Table A2. Construct reliability and convergent validity.
Loading t-value Cronbach’s
alpha AVE MTV WTV MTV WTV MTV WTV MTV WTV Out- comes O1 O2 O3 O4 O5 0.708 0.680 0.762 0.806 0.823 0.816 0.854 0.784 0.759 0.772 - 16.55 18.46 19.44 19.83 - 29.62 26.34 25.25 25.79 0.87 090 0.923 0.954 Satis. S1 S2 S3 S4 S5 0.759 0.802 0.847 0.835 0.823 0.750 0.792 0.839 0.877 0.869 - 21.62 23.00 22.64 22.26 - 24.43 26.09 27.40 27.12 0.91 0.91 0.942 0.947 RA RA1 RA2 RA3 RA4 RA5 0.785 0.852 0.886 0.876 0.858 0.819 0.865 0.900 0.890 0.796 - 24.93 26.29 25.89 25.17 - 31.83 33.91 33.30 33.21 0.93 0.94 0.965 0.974 PU U2 U3 U4 U6 U7 U8 0.803 0.814 0.817 0.729 0.826 0.850 0.796 0.834 0.820 0.731 0.840 0.862 - 24.12 24.26 20.83 24.61 25.63 - 28.45 27.81 23.92 28.73 29.78 0.92 0.92 0.948 0.954 PEU PEU1 PEU2 PEU3 PEU4 0.849 0.891 0.884 0.838 0.872 0.904 0.893 0.854 - 30.18 29.75 27.24 - 38.39 37.43 34.36 0.92 0.93 0.964 0.974 Att. A1 A2 A3 A4 A5 A6 0.847 0.894 0.849 0.777 0.853 0.843 0.863 0.898 0.846 0.789 0.852 0.857 - 31.16 28.38 24.57 28.61 28.02 - 37.76 33.68 29.84 34.15 34.54 0.94 0.94 0.957 0.966
Technology Acceptance Model: Four Longitudinal Field Studies,” Management Science, vol. 46, no. 2, Feb. 2000, pp. 186-204. [3] E.M. Rogers, Diffusion of Innovations, 4th ed., Free Press, New
York, 1995.
[4] S.M. Besen and J. Farrell, “Choosing How to Compete: Strategies & Tactics in Standardization,” J. Economic Perspectives, vol. 8, no. 2, 1994, pp. 117-131.
[5] J. Farrell and G. Saloner, “Standardization, Compatibility, and Innovation,” Rand J. Economics, vol. 16, no. 1, 1985, pp. 70-83. [6] M. Fishbein, I. Ajzen, Belief, Intention and Behavior: An
Introduction to Theory and Research, Addison Wesley, 1975. [7] F.D. Davis, “Perceived Usefulness Perceived Ease of Use, and
User Acceptance of Information Technology,” MIS Quarterly, vol. 13, no. 3, Sept. 1989, pp. 319-340.
Table A3. Discriminant validity.
Mobile TV (DMB) case
Outcomes Satis. RA PU PEU Att.
Outcomes 0.960 Satisfaction 0.766 0.970 RA 0.471 0.444 0.982 PU 0.642 0.565 0.743 0.974 PEU 0.412 0.413 0.581 0.655 0.984 Attitude 0.569 0.537 0.809 0.784 0.632 0.978 Web TV case
Outcomes Satis. RA PU PEU Att.
Outcomes 0.976 Satisfaction 0.720 0.973 RA 0.271 0.348 0.987 PU 0.555 0.580 0.679 0.977 PEU 0.482 0.427 0.484 0.628 0.987 Attitude 0.402 0.466 0.807 0.768 0.581 0.983
Table A4. Results of hypothesis testing.
Coefficient t-value P-value
MTV WTV MTV WTV MTV WTV S←O 0.83 0.67 15.26 18.66 0.000 0.000 CU←S 0.98 1.15* 19.35 23.06 0.000 0.000 PU←PEU 0.68 0.64 17.05 19.26 0.000 0.000 A←PU 0.47 0.37 12.64 13.19 0.000 0.000 A←PEU 0.36 0.36 9.24 11.12 0.000 0.000 H2 RA←A 0.73 0.80 17.68 21.06 0.000 0.000 RA←S 0.18 0.11 2.80 1.66 0.005 0.097 H1 RA←CU -0.11 -0.13 -2.17 -2.82 0.030 0.005 H3 BI←RA 0.38 0.22 7.33 5.15 0.000 0.000
*If the factors are correlated (oblique), the factor loadings are regression coefficients and not correlations and as such they can be larger than one in magnitude. This can indeed happen also for any factor loading or structural coefficient in any SEM model. A standardized coefficient of 1.04, 1.40, or even 2.80 does not necessarily imply that something is wrong, although it might suggest that there is a high degree of multicollinearity in the data. In a sample academic test, when the correlation value was 0.999, the coefficient was 22.089. (How Large Can a Standardized Coefficient Be? By Karl G Jöreskog. www.ssicentral.com)
[8] E. Karahanna, D.W. Straub, and N.L. Chervany, “Information Technology Adoption Across Time: A Cross-Sectional
Comparison of Pre-Adoption and Post-Adoption Beliefs,” MIS Quarterly, vol. 23, no. 2, Jun. 1999, pp. 183-213.
[9] A. Bhattacherjee, “Understanding Information Systems Continuance: An Expectation-Confirmation Model,” MIS Quarterly, vol. 25, no. 3, Sept. 2001, pp. 351-370.
Information System Characteristics and Perceived Usefulness on Post Adoption Usage of Information Systems,” Inf. & Management, vol. 45, no. 6, Sept. 2008, pp. 376-386.
[11] Reuben Hill, Family Development in Three Generations, Cambridge, MA: Schenkman, 1970
[12] J.C. Anderson and J.A. Narus, “A Model of the Distributor’s Perspective of Distributor-Manufacturer Working Relationships,” J. Marketing, vol. 48, Fall 1984, pp. 62-74.
[13] J.W. Thibaut and H. Kelly, The Social Psychology of Groups, New York/London/Sydney: John Wiley & Sons, Inc., 1959. [14]I. Ajzen, “The Theory of Planned Behavior,” Organizational
Behavior and Human Decision Processes, vol. 50, no. 2, Dec. 1991, pp. 179-211.
[15] R.A. Ping, “The Effects of Satisfaction and Structural Constraints on Retailer Exiting, Voice, Loyalty, Opportunism, and Neglect,” J. Retailing, vol. 69, no. 3, Fall 1993, pp. 320-352.
[16] J. Hartwick, and H. Barki, “Explaining the Role of User Participation in Information System Use,” Management Sci., vol. 40, no. 4, Apr. 1994, pp. 440-465.
[17]S. Taylor, and P.A. Todd, “Understanding Information Technology Usage: A Test of Competing Models,” Inf. Syst. Research, vol. 6, no. 2, June 1995, pp. 144-176
[18]A. Venkatesh, “Computers and Other Interactive Technologies for the Home,” Commun. ACM, vol. 39, no. 12, Dec. 1996, pp. 47-54.
[19]M. Parthasarathy and A. Bhattacherjee, “Understanding Post-Adoption Behavior in the Context of Online Services,” Inf. Syst. Research, vol. 9, no. 4, Dec. 1998, pp. 362-379.
[20] M.A. Jones, D.L. Mothersbaugh, and S.E. Beatty, “Why Customers Stay: Measuring the Underlying Dimensions of Services Switching Costs and Managing Their Differential Strategic Outcomes,” J. Business Research, vol. 55, no. 6, Jun. 2002, pp. 441-450.
[21] S.H. Kim and S.H. Oh, “Study on the Affecting Factors of Continuous Usage Intention–Customer Value, Satisfaction, Switching Cost, Alternatives’ Attractiveness,” Marketing Research in Korea, vol. 17, no. 2, 2002, pp. 25-55.
[22] D.E. Gefen, E. Karahanna, D.W. Straub, “Trust and TAM in Online Shopping: An Integrated Model,” MIS Quarterly, vol. 27, no. 1, Mar. 2003, pp. 51-90.
[23]C.L. Hsu and H.P. Lu, “Why Do People Play On-line Games? An Extended TAM with Social Influences and Flow Experience,” Inf. & Management, vol. 41, no. 7, Sept. 2004, pp. 853-868.
[24] A. Bhattacherjee and G. Premkumar, “Understanding Changes in Belief and Attitude Toward Information Technology Usage: A Theoretical Model and Longitudinal Test,” MIS Quarterly, vol. 28, no. 2, 2004, pp. 229-254.
[25] M.R. Solomon, Customer Behavior: Buying, Having, and Being, Pearson Education International, 6th ed., 2004.
[26] W.W.N. Wan et al., “Customers’ Adoption of Banking Channels in
Hong Kong,” Int. J. Bank Marketing, vol. 23, no. 3, 2005, pp. 255-272.
[27] Y.J. LEE and C.L LEE, “Research on the Switching Cost and Result Variables–Mediator Effect of Service Usage Rate,” Marketing Research in Korea, vol. 20, no. 3, 2005, pp. 1-28. [28] H.H. Chang, “Intelligent Agent’s Technology Characteristics
Applied to Online Auctions’ Task: A Combined Model of TTF and TAM,” Technovation, vol. 28, no. 9, Sept. 2008, pp. 564-577. [29] N N.E. Park, “IPTV Technology Development and Standards,”
TTA J., no. 122, Mar.-Apr. 2009, pp. 36-39 (in Korean).
[30] G.L. Frazier, “Interorganizational Exchange Behavior in Marketing Channels: A Broadened Perspective,” J. Marketing, vol. 47, Fall 1983, pp. 68-78.
[31] F.D. Davis, “User Acceptance of Information Technology: System Characteristics, User Perceptions and Behavioral Impacts,” Int. J Man-Machine Study, vol. 38, no. 3, Mar. 1993, pp. 475-487.
[32] S. Taylor and P. Todd, “Assessing IT Usage: The Role of Prior Experience,” MIS Quarterly, vol. 19, no. 4, Dec. 1995, pp. 561-570.
[33] I.S. Ha, Y.S. Yoon, and M.K. Choi, “Determinants of Adoption of Mobile Games under Mobile Broadband Wireless Access Environment,” Inf. & Management, vol. 44, no. 3, Apr. 2007, pp. 276-286.
[34] H.K. Kim and N.M. Moon, The Strategy and Technology of T-Commerce, Sigma Insight, 2002 (in Korean).
[35] J.J. Cronin and S.A. Taylor “Measuring Service Quality: A Reexamination and Extension,” J. Marketing, vol. 56, Jul. 1992, pp. 55-68.
[36] Y.H. Shin, H.R. Jeon, and M.K. Choi, “Analysis on the Mobile IPTV Adoption and Moderator Effect Using Extended TAM Model,” 4th Int. Conf. NCM, 2008, pp. 220-225.
[37] J.C. Anderson and D.W. Gerbing, Structural Equation Modeling in Practice: A Review and Recommended Two Step Approach, Psychol Bull, 1988.
[38] R. Agarwal and J. Prasad, “A Conceptual and Operational Definition of Personal Innovativeness in the Domain of Information Technology,” Inf. Syst. Research, vol. 9, no. 2, 1998, pp. 204-215.
[39] C. Fornell and D.F. Larcker, “Evaluating Structural Equation Models with Unobservable Variables and Measurement Error,” J. Market Research, vol. 18, no. 1, 1981, pp. 39-50.
[40] R.P. Bagozzi and Y. Yi, “On the Evaluation of Structural Equation Models,” J. Academy Marketing Science, vol. 16, no. 1, 1988, pp. 74-94.
[41] M. K. Chang and W. Cheung, “Determinant of the Intention to Use Internet/WWW at Work: A Confirmatory Study,” Inf. & Management, vol. 39, no. 1, 2001, pp. 1-14.
[42] W.W. Chin, “Issues and Opinion on Structural Equation Modeling,” MIS Quarterly, vol. 22, no. 1, 1998, pp. 7-16.
[43] S.H. Park, S.H. Jeong, and C.J. Hwang, “Mobile IPTV Expanding the Value of IPTV,” 7th Int. Conf. Netw., 2008, pp. 296-301.
Hyori Jeon received her BBA and BEc from Handong University in 1999, her MS in IT business administration from KAIST in 2001, and her PhD in management science from KAIST in 2011. Since 2009, she has worked at ETRI as a member of the research staff. Her major research interests include IT marketing, R&D management, market entering strategy of new technology, and business models of new multimedia services, such as mobile IPTV.
Yonghee Shin received his BBA from Sogang University in 1999 and his MS in IT business administration from KAIST in 2001. Since 2001, he has worked at ETRI as a member of the research staff. His major research interests include IT policy and strategy, IT marketing, management of technology, and new media business models.
Munkee Choi received his BS in applied mathematics from Seoul National University in 1974, his MS in industrial engineering from KAIST in 1978, and his PhD in operations research from North Carolina State University in 1989. He has worked at ETRI for 21 years as a member of the research staff and for 3 years as president. Currently, he is a professor of the Management Science Department at Korea Advanced Institute of Science and Technology. His major research interests include network business, R&D management and its commercialization, IPTV & smart TV business modeling, and new media business.
Jae Jeung Rho received his BE from Seoul National University in 1983, his MS in mechanical engineering from Texas A&M University in 1988, and his PhD in industrial engineering from Houston University in 1994. Upon graduation, he joined Kyungsung University in Busan, Korea, as a faculty member in 1994. He then moved to Information and Communications University in 2000, and joined Korea Advanced Institute of Science and Technology in 2009. His major research interests include supply chain management, RFID business model development, and ICT implementation for developing countries. Currently he is a director of the Global IT Technology Program.
Myung Seuk Kim received her BBA and MS in business administration from Hyosung Woman’s University in 1984 and 1986, respectively. She received her PhD in business administration from Chungnam National University in 2004. From 2004, she worked as a post-doctoral researcher at ETRI, where since 2010 she has been a visiting researcher. Her major research interests include service management, technology commercialization, and management of technology.