A DOCTORAL DISSERTATION
Anti-Cancer and Anti-Inflammatory
Effects of Eutigosides from
Eurya emarginata
Department of Biology
Graduate School Cheju National University
우묵사스레피의 eutigosides에 의한
항암 및 항염증 효과
지도교수 김 세 재박 수 영
이 논문을 이학 박사학위 논문으로 제출함
2003년 12월박수영의 이학 박사학위 논문을 인준함
제주대학교 대학원
2003년 12월Anti-Cancer and Anti-Inflammatory
Effects of Eutigosides from
Eurya emarginata
Soo Young Park
(Supervised by Professor Se Jae Kim)
A Dissertation Submitted in Partial Fulfillment of the Requirements for the Degree of
DOCTOR OF PHILOSOPHY
CONTENTS
CONTENTS ...ⅰ LIST OF SCHEMES ...ⅵ LIST OF FIGURES ...ⅶ LIST OF TABLES ...ⅺ OVERALL BACKGROUNDS ...1 PART ONE ...3 PART TWO ...59PART ONE
ABSTRACT ...4
INTRODUCTION ...6
MATERIALS AND METHODS ...10
1. Purification of biologically active components from E. emarginata 1-1. Preparation of extracts from leaves of E. emarginata ...10
1-2. Characterization procedures ...10
2. Analysis of cytotoxicity or apoptotic events 2-1. Cell cultures ...11
2-2. Cytotoxicity tests ...11
2-3. Cell surface antigen analysis ...13
2-4. DNA fragmentation analysis ...13
2-5. Microscopic observation ...14
2-6. Cell cycle phase distribution analysis ...14
2-7. RNA extraction ...14
2-8. RT-PCR analysis ...15
RESULTS ...20
1. Purification of biologically active components from E. emarginata 1-1. Extraction and Fractionation of E. emarginata leaves ...20
1-2. Isolation of the eutigoside B and C ...22
2. Analysis of cytotoxic- or apoptotic events 2-1. Effects of the extracts of E. emarginata on the growth of tumor cells ...28
2-2. Cell surface antigen analysis ...30
2-3. Effects of the EtOAc subfraction of E. emarginata on the growth of HL-60 cells ...30
2-4. Induction of apoptosis by E. emarginata in HL-60 cells ...30
2-5. Expressions of c-Myc by the EtOAc fraction in HL-60 cells ...36
2-6. Expressions of Bcl-2 and Bax by the eutigoside C in HL-60 cells ...36
2-7. Release of mitochondrial cytochrome c into cytosol in HL-60 cells ...37
2-8. Degradation of PARP, an endogenous substrate of caspase-3 in HL-60 cells ...37
3. Cell cycle regulation by the eutigoside C in HL-60 cells 3-1. Inhibition of cell growth by eutigoside C in HL-60 cells ...45
3-2. Cell growth arrest induced by the eutigoside C from E. emarginata ...45
PART TWO
ABSTRACT ...60
INTRODUCTION ...62
MATERIALS AND METHODS ...64
1. DPPH radical-scavenging activity ...64
2. Cell culture ...65
3. Pro-inflarmmatory cytokines production in vitro ...65
4. RNA extraction ...66
5. RT-PCR analysis ...66
6. Western blot analysis ...68
7. Nitrite assay ...69
RESULTS ...70
1. Isolation of eutigosides from E. emarginata leaves and measurement of DPPH radical-scavenging activity ...70
2. The effect of E. emarginata on LPS-induced IL-1β, IL-6, and TNF-α secretion in RAW264.7 ...71
5. Inhibition of LPS-mediated COX-2 induction in RAW264.7 ...81
6. Inhibition of LPS-mediated NO production in RAW264.7 ...81
DISCUSSION ...88
LITERATURE CITED ...93
LIST OF SCHEMES
Scheme 1. Systematic purification using the solvent partitioning and silica gel chromatography from Eurya emarginata ...21
Scheme 2. Isolation procedure of eutigoside B and eutigoside C from Eurya
LIST OF FIGURES
Figure 1. The structure of isolated compound Ⅰ (Quercitrin) from EtOAc subfraction 4 ...23
Figure 2. The structure of isolated compound Ⅱ (Cornoside) from EtOAc subfraction 5-4-5-T4-H1 ...23
Figure 3. The structure of isolated compound Ⅲ and Ⅳ (Eutigosides) from EtOAc subfraction 5-4-5-3 ...23
Figure 4. The 1H-NMR and 13C-NMR spectrum of eutigoside B from Eurya
emarginata. ...26
Figure 5. The 1H-NMR and 13C-NMR spectrum of eutigoside C from Eurya
emarginata ...27
Figure 6. Cell surface antigen analysis in HL-60 cells ...31
Figure 7. Inhibitory effect of Eurya emarginata on the growth of HL-60 cells ...32
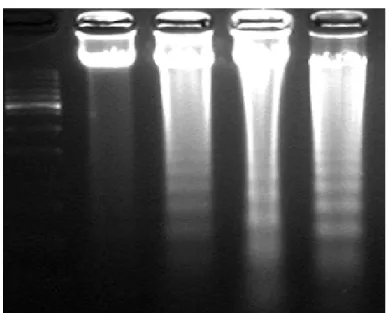
Figure 8. DNA fragmentation by the components of Eurya emarginata in HL-60 cells ...33
flow cytometric analysis (left panel) and the fluorescence micrographs (right panel) of cells with highly condensed nuclei stained with 4.6-diamidino-2-phenyl-indole (DAPI) ...34
Figure 10. The degree of apoptosis is represented as the DNA content measured by flow cytometric analysis (left panel) and the fluorescence micrographs (right panel) of cells with highly condensed nuclei stained with 4.6-diamidino-2-phenyl-indole (DAPI) ...35
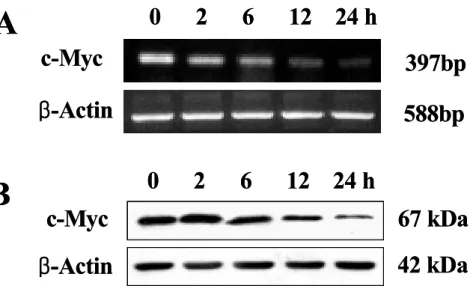
Figure 11. Expression of c-Myc and β-actin in HL-60 cells by a treatment with the EtOAc fraction ... 39
Figure 12. Expression of Bcl-2 and Bax in HL-60 cells by a treatment with the eutigoside C ...40
Figure 13. Expression of cytochrome-c in the HL-60 cells after a treatment with eutigoside C ...41
Figure 14. Immunoblot analysis of caspase-9 and caspase-3 in the HL-60 cells by a treatment with eutigoside C ...42
Figure 15. Immunoblot analysis of PARP in the HL-60 cells after a treatment with eutigoside C ...43
Figure 17. Effect of eutigoside C on the growth of HL-60 cells ...47
Figure 18. Effects of eutigoside C on the levels of cyclins E, cycline D1, cdk 2 and cdk 4 in HL-60 cells ...48
Figure 19. Effects of eutigoside C on the levels of p21WAF1/CIP1 and p27KIP1 in HL-60 cells ...49
Figure 20. Effect of eutigoside C on the levels of pRB and p21WAF1/CIP1 proteins in HL-60 cells ...50
Figure 21. Inhibitory effects of the several extracts of Eurya emarginata on the mRNA expression of pro-inflammatory cytokines in activated macrophages ...73
Figure 22. Inhibitory effects of eutigosides on pro-inflammatory cytokine mRNA expression in activated macrophages ...74
Figure 23. Inhibitory effects of eutigosides on anti-inflammatory cytokine mRNA expression in activated macrophages ...75
Figure 24. Inhibitory effects of eutigosides on TNF-α production in RAW 264.7 cells ...77
Figure 25. Inhibitory effects of eutigosides on IL-6 production in RAW 264.7 cells ...78
Figure 26. Inhibitory effects of the solvent fractions of E. emarginata on iNOS protein expression in activated macrophages ...79
Figure 27. Inhibitory effects of eutigosides on iNOS protein expression in activated macrophages ...80
Figure 28. Inhibitory effects of the solvent fractions of E. emarginata on COX-2 protein expression in activated macrophages ...83
Figure 29. Inhibitory effects of eutigosides on COX-2 protein expression in activated macrophages ...84
Figure 30. Inhibitory effects of components of E. emarginata on nitrite accumulation in RAW264.7 macrophages ...85
Figure 31. Inhibitory effects of eutigoside B on nitrite accumulation in RAW264.7 macrophages ...86
Figure 32. Inhibitory effects of eutigoside C on nitrite accumulation in RAW264.7 macrophages ...87
LIST OF TABLES
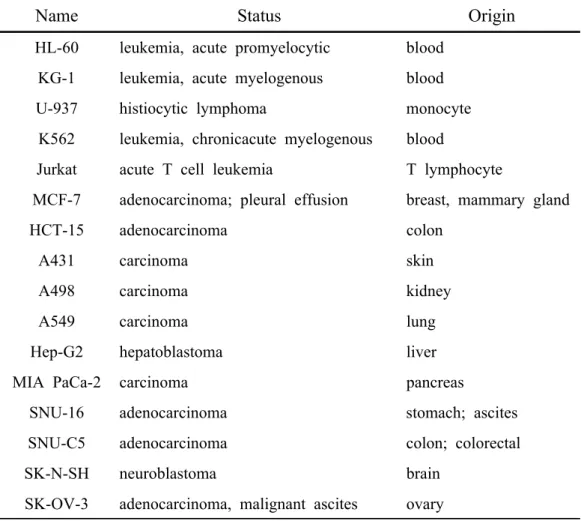
Table 1. Human cancer cell lines used in this study ...12
Table 2. Normal human cells used in this study ...12
Table 3. The sequences of primers used in RT-PCR analysis and the sizes of RT-PCR products ...18
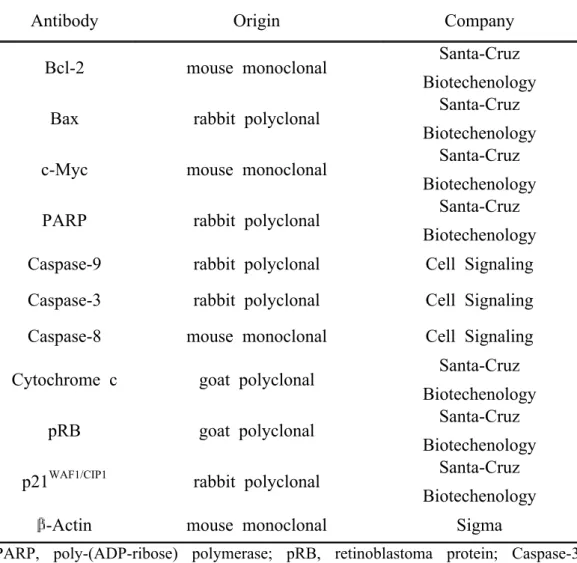
Table 4. Antibodies used in Western blot analysis ...19
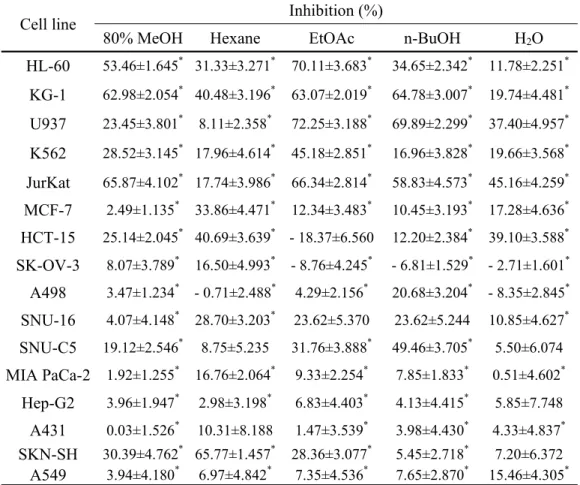
Table 5. Inhibitory effects of the several extracts from Eurya emarginata on the growth of tumor cells ...29
Table 6. The sequences of primers used in RT-PCR analysis and the sizes of RT-PCR products ...67
Table 7. Comparison DPPH radical-savenging activities of several extracts of
OVERALL BACKGROUNDS
The incidence of cancer has been rapidly increased and it is one of the main causes of death. Recent advances of chemotherapy have contributed to improve life quality and prolong the life span of cancer patients.
The major chemotherapy agents contain alkylating agents, antimetabolites, plant alkaloids, antitumor antibiotics, and steroid hormones (Kaufmann and Earnshaw, 2000). But cancer chemotherapy has a limitation because most of anticancer agents don't have the discrimination between normal cells and cancer cells (Sporn, 1994; Greenwald et al., 1990). The chemotherapy leads to death of normal cells as well as cancer cells with lots of side effects (Wattenberg, 1996; Greenwald et al., 1990; Boone, 1990). To overcome the limitation of chemotherapy, it has been tried to isolate new anticancer compounds from natural products that were used in the folk for a long time. Extracts of the natural plants are important sources for development of new drug. However, these extracts suffer from a lack of reproducible bioactivity and chemical composition caused by the highly inducible, variable, and transitory nature of plant secondary metabolism (Poulev et al., 2003). Recently a large number of new anticancer agents, which target one or more of the extracellular, transmembrane, or intracellular (but extranuclear) processes involved in the malignant transformation of cells or carcinogenesis have been developed from natural resources (Pezzuto, 1997; Wattenberg, 1996; Sporn, 1994). The crude extracts of plants grown in Jeju were screened for
and Kang, 2000).
Eurya emarginata (Thunb.) Makino (Theaceae) is a dioecious,
insect-pollinated tree, which combines both sexual reproduction and colonial spread. The distribution is restricted in coastal areas from southern China, southern Korea, to central and southern Japan (Chung and Epperson, 2000). The leaves of Eurya are used in the traditional medicine with the treatment of ulcers or diuretic in the coastal areas of Jeju Island. Nevertheless, there are few reports on the biological activity and constituents of E. emarginata. Therefore, the present study investigated the anticancer effects and action mechanism of the extract from the leaves of E. emarginata to identify constituents of its leaves with anti-cancer activity. And, the components which displayed anti-cancer activity were isolated from the leaves of E. emarginata. In addition, in order to identify whether the isolated components have chemopreventive effect, we examined the anti-oxidative and anti-inflammatory activities.
Part Ⅰ
Anti-cancer effects of eutigosides in human leukemia
HL-60 cells
ABSTRACT
The present study investigated the anticancer effects and action mechanism of eutigosides from the leaves of E. emarginata. The crude extract of E. emarginata markedly inhibited the growth of leukemia cells such as HL-60. When HL-60 cells were treated with the ethyl acetate fraction, several apoptotic events like as DNA fragmentation, morphologic changes and increase of the population of sub-G1 hypodiploid cells were observed. The growth inhibitory effect of E.
emarginata seems to be a result from the induction of apoptosis. Moreover, the
ethyl acetate fraction markedly reduced c-Myc expression in a time-dependent manner. The eutigoside C showing the cytotoxic effect was isolated from the leaves of E. emarginata. Furthermore, when the HL-60 cells were treated with eutigoside C, the Bcl-2 expression decreased in a time-dependent manner, whereas the expression of Bax was increased in a time-dependent manner compared to the control, and the release of cytochrome c from mitochondria into the cytosol was also observed. In addition, the expression of the active forms of caspase 9 and 3 were increased and the cleavage of Poly(ADP-ribose) polymerase, a vital substrate of effector caspase, was observed. The results indicate that the eutigoside C from E. emarginata induce apoptosis of HL-60 cells via the down-regulation of Bcl-2 expression and activation of caspases.
This study also investigated the mechanism by which the eutigoside C of E.
emarginata induces cell growth arrest in human leukemia HL-60 cells. The data
showed that the eutigoside C lead to the decrease of cyclin D1/E and the induction of Cdk inhibitor p21WAF1/CIP1. In addition, the eutigoside C inhibited Cdk activity, and this inhibition was associated with the induction of Cdk
inhibitor p21WAF1/CIP1 and its binding to the Cdk, similar to the induction of
p21WAF1/CIP1 by certain anticancer drugs. These findings suggest that the down
regulation of cyclin D1/E and the induction of p21WAF1/CIP1 play a key role in the negative regulation of cell cycle progression by the eutigoside C from E.
emarginata in the HL-60, human leukemia cells.
Key word: Eurya emarginata, Eutigoside C, HL-60, Apoptosis, Bcl-2, Bax,
INTRODUCTION
Cancer is a disease, which can be characterized by the reduction or loss of effective controlling to maintain cellular organization in tissues. Cancer cells display temporally unrestricted growth preference over their normal counterparts (Clark, 1991). The basic features of cancer cells can be summarized as (a) uncontrolled cell proliferation, (b) lack of cellular differentiation features, (c) the ability to metastasize (Buick and Pollak, 1984).
Chemotherapy, or the use of chemical agents to destroy cancer cells, is a mainstay in the treatment of malignancies. The possible role in treating illness was discovered when the bone marrow suppressive effect of nitrogen mustard was noted in the early 1900's. Since that time, the search for drugs with anticancer activity has continued, and the goal of treatment with chemotherapy has evolved from relief of symptoms to cure. A major advantage of chemotherapy is its ability to treat widespread or metastatic cancer, whereas surgery and radiation therapies are limited to treating cancers that are confined to specific areas (Wattenberg, 1996; Mesner et al., 1997; Kaufmann and Earnshaw, 2000).
Previous studies have demonstrated that a wide range of anticancer agents, including chemotherapeutic agents, hormones, and various biologicals, induce apoptosis in malignant cells in vitro (Arends and Wyllie, 1991; Mesner et al., 1997) It is important to emphasize that this treatment-induced apoptosis is not merely a phenomenon in tissue cultures. Serial examination of peripheral blood mononuclear cells from acute leukemia patients undergoing induction therapy has demonstrated that various agents, including cytarabine, mitoxantrone, etoposide,
paclitaxel, and topotecan, cause a marked increase in the number of apoptotic blasts (Li et al., 1994). Characteristic apoptotic changes have also been described in solid tumors after treatment of mice with various cytotoxic drugs, including cytarabine, 5-fluorouracil (5FU), fludarabine, doxorubicin, cyclophosphamide, cisplatin, etoposide, dactinomycin, and camptothecin (Mesner
et al., 1997; Li et al., 1994). Although the occurrence of apoptosis after
treatment of solid tumors is not as well documented in the clinical setting, this might reflect the difficulty in securing sequential biopsies at appropriate times after therapy. Unfortunately, the appropriate timing for such biopsies, even if they were feasible, is not clear, for different agents induce apoptosis with different kinetics even in leukemia cells (Li et al., 1994; Kaufmann, 1989). On the other hand, the possibility that other cell death processes also play a major role in the regression of solid tumors after drug treatment (Houghton, 1999) cannot be completely ruled out at the present time. If the assertion that anticancer drugs kill target cells by inducing apoptosis is correct, some potentially important implications immediately follow. Because apoptosis is a regulated process (Earnshaw et al., 1999), biochemical alterations that make cells more or less susceptible to apoptosis might affect their sensitivity to a wide range of unrelated antineoplastic agents. In other words, changes that decrease the ability to activate the apoptotic machinery might play a role in resistance to a wide variety of drugs (Kaufmann and Earnshaw, 2000).
Apoptosis, a programmed cell death (Wyllie et al., 1980; White, 1996), also plays an essential role as a protective mechanism against
apoptosis thus is a highly desirable mode as a chemotherapeutic as well as a chemopreventive strategy for cancer control. Indeed, many chemopreventive agents act through the induction of apoptosis as a mechanism to suppress carcinogenesis (Kelloff et al., 1996; Taraphdar et
al., 2001). Apoptosis is known as an important biologic mechanism that
contributes to the maintenance of the integrity of multicellular organisms. It is induced by a wide variety of cellular stresses such as DNA damage, UV radiation, ionizing radiation and oxidative stress (Nagata, 1997), and is morphologically distinct from necrosis in many of its characteristic changes as follows; DNA fragmentation, chromatin condensation, cytoplasmic membrane blebbing, and cell shrinkage. Antitumor agents also induce apoptosis in some cancer cells both in vitro and in vivo, indicating that apoptosis plays a very important role in cancer chemotherapy (Kaufmann, 1989; Meyn et al., 1995). In the present study, the crude extracts of plants grown in Jeju Island were screened for cytotoxic effect and the methanol extracts were prepared and used for the evaluation of growth inhibitory activity. As results, it was found that the extract of the leaves from E. emarginata markedly inhibited the growth of human leukemia HL-60 cells (Park and Kang, 2000).
Eurya emarginata (Thunb.) Makino (Theaceae) is a dioecious,
insect-pollinated tree, which combines both sexual reproduction and colonial spread. The distribution is restricted in coastal areas from southern China, southern Korea, to central and southern Japan (Chung and Epperson, 2000). The present study investigated the constituents of the leaves of E.
emarginata, grown in Jeju Island, Korea. The leaves of Eurya are used in
ulcers or diuretic. Nevertheless, there are few reports on the biological activity and constituents of E. emarginata. With these facts as backgrounds, the present study investigated the anticancer effects and action mechanism of the extract from the leaves of E. emarginata to identify constituents of its leaves with anti-cancer activity. And, the components which displayed anti-cancer activity were isolated from the leaves of E. emarginata.
MATERIALS AND METHODS
1. Purification of biologically active components from E. emarginata
1-1. Preparation of extracts from leaves of E. emarginata
The leaves from Eurya emarginata (Thunb.) Makino were collected in May, 2000 at Cheju National University, Jeju Island, Korea. The leaves were cleaned, dried at room temperature for 2 weeks and ground into a fine powder. The dried leaves were extracted with the 80% methanol (MeOH) after standing a week at room temperature and then concentrated under a vacuum. The resulting MeOH extract was suspended in water (1L), and successively partitioned with hexane (1L × 3), ethylacetate (EtOAc; 1L × 3), and n-butanol (BuOH; 1L × 3), to give hexane, EtOAc,
n-BuOH and H2O layer, respectively. Each partition layer was evaporated, and
freeze-dried (Scheme 1).
1-2. Characterization procedures
1H- and 13C-NMR spectra were determined on a JEOL JNM-LA 400 (FT NMR system, Nuclear Magnetic Resonance, Japan) spectrometer. TLC (Thin layer chromatography) was carried out on Merck precoated silica gel 60 F254 plates and normal-phase column chromatography was carried out on
Kieselgel 60 (230-400 mesh ASTM, Merck, Germany) silica gels. Reverse-phase column chromatography was carried out with Silica gel 100 C18-Reversed phase (3×15, Silica gel 100 C18-Reversed phase, Merck, Germany). C18 HPLC (μBondapak C18, 7.8×300㎜ column, Merck; Waters
2487, Waters) was used for HPLC analysis.
2. Analysis of cytotoxic- or apoptotic events
2-1. Cell cultures
The anticancer assay was performed using sixteen different human cancer and two different normal cell lines, which were obtained from the KCLB (Korean Cell Line Bank). The cells were maintained at 37℃ in a humidified atmosphere with 5% CO2 in RPMI 1640 medium or DMEM
medium supplemented with 10% fetal bovine serum and penicillin/streptomycin (100 U/㎖ and 100 ㎍/㎖, respectively; GIBCO Inc, NY, USA). The exponentially growing cells were used throughout the experiments (Table 1 and Table 2).
2-2. Cytotoxicity tests
The effect of the solvents extracts on the growth of various cancer cells was determined by measuring the metabolic activity using a 3-[4,5-dimethylthiazol-2-yl]-2,5-diphenyltetrazolium bromide (MTT) assay (Carmichael et al., 1987). The MTT assays were performed as follows: The cancer cells (1.0∼3.0×10⁵cells/㎖) were treated for 4 days with 100 ㎍/㎖ of extracts in 96-microwell plates. After incubation, 0.1 ㎎ (50 ㎕ of a 2 ㎎/㎖ solution) of MTT (Sigma, MO, USA) was added to each well and cells were then incubated at 37℃ for 4 h. The plates were centrifuged at
Name Status Origin
CCD-25Lu normal, fibroblast lung
HEL-299 normal, fibroblast lung
Name Status Origin
HL-60 leukemia, acute promyelocytic blood KG-1 leukemia, acute myelogenous blood
U-937 histiocytic lymphoma monocyte
K562 leukemia, chronicacute myelogenous blood
Jurkat acute T cell leukemia T lymphocyte
MCF-7 adenocarcinoma; pleural effusion breast, mammary gland
HCT-15 adenocarcinoma colon
A431 carcinoma skin
A498 carcinoma kidney
A549 carcinoma lung
Hep-G2 hepatoblastoma liver
MIA PaCa-2 carcinoma pancreas
SNU-16 adenocarcinoma stomach; ascites
SNU-C5 adenocarcinoma colon; colorectal
SK-N-SH neuroblastoma brain
SK-OV-3 adenocarcinoma, malignant ascites ovary
Table 1. Human cancer cell lines used in this study
well to dissolve the formazan crystals. The plates were read immediately at 540 nm on a microplate reader (Amersham Pharmacia Biotech, UK, USA). The results are represented as the percentage inhibition that produced reduction of absorbance of each group compared to the untreated controls from triplicated experiments.
2-3. Cell surface antigen analysis
The HL-60 cells (3.0 × 10⁵cells/㎖) were incubated with the extracts from E.
emarginata (100 ㎍/㎖) for 6 days, the cells were harvested and examined for
induction of differentiation by analysis of cell surface antigen using fluorescence-activated cell sorter (FACS). For analysis of cell surface antigens, cells were stained by direct immunofluorescent staining using fluoerescein-isothiocyanate (FITC) conjugated mouse antihuman CD 66b or CD 14, and R-phycoerythrin (PE) conjugated mouse antihuman CD 33. Control studies were performed with a non-binding control mouse Ig G1 isotype antibodies. Flow cytometric ananlysis was performed with EPICS-XL FACScan flow cytometer (Coulter, Miami, FL, USA).
2-4. DNA fragmentation analysis
The HL-60 cells (3.0×10⁵cells/㎖) were treated with 100 ㎍/㎖ of extracts for 24 h. For the DNA fragmentation assay, the cells were collected by centrifugation and DNA was extracted with Wizard Genomic DNA purification kit (Promega, WI, USA). The DNA fragmentation pattern
2-5. Microscopic observation
In order to examine the morphological changes, HL-60 cells (3.0×10⁵cells/㎖) were treated with 100 ㎍/㎖ of extracts for 24 h and then harvested. The cells were fixed in 4% paraformaldehyde and incubated in 1 ㎖ of a staining solution containing 2.5 ㎍/㎖ of 4.6-diamidino-2-phenyl-indole (DAPI; Sigma, MO, USA) in the dark place for 30 min. After washing with PBS, 10 ㎕ of stained cells were mounted on a slide glass. The nuclei were observed under a fluorescence microscope (BX-50, Olympus, Japan).
2-6. Cell cycle phase distribution analysis
For the flow cytometric analysis to determine cell cycle phase distribution, 3.0×10⁵ cells per sample were incubated with components from
E. emarginata at the indicated times. After cells were washed twice with
phosphate-buffered saline (PBS) and fixed in 70% ethanol for 30 min at 4℃. The cells were then rinsed with PBS and incubated in 50 ㎍/㎖ of a propidium iodide (PI; Sigma, MO, USA) solution and 50 ㎍/㎖ of RNase A in the dark for 30 min at 37℃. Flow cytometry analysis was performed using an EPICS-XL FACScan flow cytometer (Coulter, Miami, FL, USA).
2-7. RNA extraction
The total RNA was extracted from cells with the Tri-Reagent (MRC, OH, USA) method following the manufacturer's instructions. The RNA extraction was carried out in an RNase-free environment. The RNA was quantified by reading the absorbance at 260 nm according to the methods
described by Sambrook et al. (1989).
2-8. RT-PCR analysis
The reverse transcription of 1 ㎍ RNA was carried out using M-MuLV reverse transcriptase (Promega, WI, USA), oligo (dT) 18 primer, dNTP (0.5 μM) and 1 U RNase inhibitor. After incubation at 70℃ for 5 min, 37℃ for 5 min, 37℃ for 60 min, and M-MuLV reverse transcriptase was inactivated by heating at 70℃ for 10 min. The polymerase chain reaction (PCR) was performed in a reaction buffer [cDNA, 1.25 U Taq DNA polymerase (Promega, WI, USA), 50 μM 3' and 5' each primer and 200 mM dNTP in 200 mM Tris-HCl buffer, pH 8.4, containing 500 mM KCl and 1-4 mM MgCl2]. The PCR was performed with a DNA gene cycler
(BIO-RAD, HC, USA), and the amplication was followed by 35 cycles of 94℃ for 45 sec (denaturing), 55-65℃ for 45 sec (annealing) and 72℃ for 1 min (primer extension). The PCR products were electrophoresed on a 1.5% agarose gel. The nucleotide sequence of each primers and the size of product were shown in Table 3.
2-9. Subcellular fractionation
The procedure for the preparation of Mitochondria (MT) and Cytosolic fractions was carried out as described before with minor modfications (Hai et al., 2000). Briefly, the cells were washed twice with cold-PBS and lysed in buffer A [20 mM HEPES (pH 8.0), 10 mM KCl, 1.5 mM MgCl2, 1 mM
mM benzamidine, and 0.2 mM sodium orthovanadate] for 30 min on ice at a concentration of 1.0×10⁷cells/㎖. The cell lysates were subjected to homogenization using an ultraschallprozessor (UP-50H; Gmbh, Germany). The cell homogenates were centrifuged twice at 600×g for 5 min at 4°C. The cell pellets were discarded, and the supernatant was again centrifuged at 17,000×g for 30 min at 4°C. The obtained supernatant was further centrifuged at 70,000×g for 1 h at 4°C. Finally, the cytosol fraction was obtained from the supernatant. The pellet from the 17,000×g centrifugation was resuspended in buffer A and recentrifuged at 17,000×g for 30 min at 4°C. The resultant supernatant was discarded, and the pellet containing the mitochondria (MT) fraction was lysed for the preparation of protein extracts by suspending the MT pellets in buffer B [10 mM Tris-HCl (pH 7.4), 150 mM NaCl, 5 mM EDTA, 0.5% Triton X-100, 10 μg/㎖ aprotinin, 1 mM phenylmethylsulfonyl fluoride, and 1 mM sodium orthovanadate] for 30 min on ice. The lysate was centrifuged at 4°C for 30 min at 17,000×g, and the supernatant was labeled as the MT protein extract. Protein concentrations in the cytosol fractions and MT fractions were determined using Bradford method (Bradford, 1976), and aliquots were stored at -70°C.
2-10. Western blot analysis
After treatment, the cells were collected and washed twice with cold-phosphate-buffered saline (PBS). The cells were lysed in a lysis buffer 〔50 mM Tris-HCl (pH 7.5), 150 mM NaCl, 1% Nonidet P-40, 2 mM EDTA, 1 mM EGTA, 1 mM NaVO3, 10 mM NaF, 1 mM dithiothreitol, 1
mM phenylmethylsulfonyl fluoride, 25 ㎍/㎖ aprotinin, 25 ㎍/㎖ leupepti n〕and kept on ice for 30 min. The cell lysates were centrifuged at 12,000×g at 4℃ for 20 min and the supernatants were then stored at -70 ℃ until used. The protein concentration was measured by the Bradford method (Bradford, 1976). Aliquots of the lysates (30-50 ㎍ of protein) were separated on a 8-12% SDS-polyacrylamide gel and transferred onto a polyvinylidene fluoride (PVDF) membrane (BIO-RAD, HC, USA) with a glycine transfer buffer [192 mM glycine, 25 mM Tris-HCl (pH 8.8), 20% MeOH (v/v)]. After blocking the nonspecific site with 5% nonfat dried milk, the membrane was then incubated with human specific primary anti-body at 4℃ overnight. The membrane was further incubated for 30 min with a secondary peroxidase-conjugated goat IgG (1:5000, Santa-Cruz, CA, USA). The immunoactive proteins were detected using an enhanced chemiluminescence (ECL) Western blotting detection kit (Amersharm-pharmacia Biotech., NY, USA). The antibodies used in Western blot analysis were shown in Table 4.
Gene (type) Primer sequences Fragment size(bp) Bcl-2 F 5'-TGCACCTGACGCCCTTCAC-3 292 R 5'-AGACAGCCAGGAGAAATCAAACAG-3 Bax F 5'-ACCAAGAAGCTGAGCGAGTGT-3 364 R 5'-ACAAAGATGGTCACGGTCTGCC-3 c-Myc F 5'-TCTGGATCACCTTCTGCTGG-3' 397 R 5'-GCTCCTCTGCTTGGACGGAC-3 Cyclin D1 F 5'-ACCTGGATGCTGGAGGTCTG-3' 402 R 5'-GAACTTCACATCTGTGGCACA-3' Cyclin E F 5'-GGAAGGCAAACGTGACCGTT-3' 638 R 5'-GGGACTTAAACGCCACTTAA-3' CDK2 F 5'-CATGGAGAACTTCCAAAAG-3' 901 R 5'-CTATCAGAGTCGAAGATGGGG-3' CDK4 F 5'-ATGGCTGCCACTCGATATGA-3' 912 R 5'-CTCTGGGTTGCCTTCGTCCT-3' p21WAF1/CIP1 F 5'-ATGTCAGAACCGGCTGGGGA-3' 496 R 5'-TTAGGGCTTCCTCTTGGAGA-3' p27KIP1 F 5'-ATGTCAAACGTGCGAGTGTCTAACG-3' 597 R 5'-TTACGTTTGACGTCTTCTGAGGCCA-3' β-Actin F 5'-ATGGGTCAGAAGGATTCCTAT-3' 588 R 5'-CAGCTCGTAGCTCTTCTCC-3'
Table 3. The sequences of primers used in RT-PCR analysis and the sizes of RT-PCR products
Antibody Origin Company Bcl-2 mouse monoclonal Santa-Cruz
Biotechenology Bax rabbit polyclonal Santa-Cruz
Biotechenology c-Myc mouse monoclonal Santa-Cruz
Biotechenology PARP rabbit polyclonal Santa-Cruz
Biotechenology Caspase-9 rabbit polyclonal Cell Signaling Caspase-3 rabbit polyclonal Cell Signaling Caspase-8 mouse monoclonal Cell Signaling Cytochrome c goat polyclonal Santa-Cruz
Biotechenology pRB goat polyclonal Santa-Cruz
Biotechenology
p21WAF1/CIP1 rabbit polyclonal Santa-Cruz
Biotechenology β-Actin mouse monoclonal Sigma
Table 4. Antibodies used in Western blot analysis
PARP, poly-(ADP-ribose) polymerase; pRB, retinoblastoma protein; Caspase-3, cystein protease-3 (also designated CPP32); Caspase-9, cystein protease-9 (also designated ICE-LAP6); Caspase-8, cystein protease-8 (also designated pro-MACHα 1, FLICE or Mch5).
RESULTS
1. Purification of biologically active components from E. emarginata
1-1. Extraction and Fractionation of E. emarginata leaves
The leaves of Eurya emarginata was collected in the campus of Cheju National University, and air-dried in the dark place. The dried leaves (175.8 g) were extracted using the 80% aqueous methanol (1L × 3) after standing a week at room temperature. The liquid layer was by filtrated, and the solvent was evaporated under reduced pressure to give the crude extract (58.21 g). After water (1L) was added to the extract, the aqueous layer was successively partitioned into hexane, ethyl acetate and n-butanol (Scheme 1). The EtOAc (9.976 g) fraction was chromatographed over a normal-phase column and eluted with EtOAc/MeOH (10/1) to obatin 8 fractions (fr.1~fr.8). A portion of fraction 4 (1.36 g) was purified by a reverse-phase column chromatography with 20∼100% MeOH and normal-phase column chromatography with CHCl3/MeOH/H2O (7.5/2.5/0.3) to
obtain compound Ⅰ (Quercitrin, Figure 1).
A portion of fraction 5 (3.595 g) was purified by a reverse-phase column chromatography with 20∼100% MeOH to obtain 5 subfractions (fr.5-1~fr.5-5). A portion of subfraction 5-4 (2.525 g) was purified by normal-phase column chromatography with CHCl3/MeOH/H2O (7.5/2.5/0.3) to obtain 7 subfractions
(fr.5-4-1~fr.5-4-7). A portion of subfraction 5-4-4 (143.9 mg) was purified by Prep TLC with CHCl3/MeOH/H2O (7.5/2.5/0.3) to obtain 5 Prep TLC
subfractions (fr. T1~fr. T5). Prep TLC 5 subfractions fr. T4 (79.6 mg) was purified by HPLC with the 70% MeOH to obtain 2 subfractions (fr. T4-H1 and
Compound Ⅱ
Dried Eurya emarginata powder (175.8g) 1) Extraction with 80%MeOH 2) stirring for 24h at room temperature 3) vacuumfiltration
80% MeOHExt. (58.210g)
Suspension with water (1L) Hexane (1L×3) EtOAc (1L×3) n-Butanol (1L×3) Hexane fr. (518mg) EtOAc fr. (9.976g) n-BuOHfr. (8.090g) H2O (8.759g)
1) dissolved in EtOAc 2) normal-phase column chromato
graphy(5×22, Kieselgel 60) with EtOAc/MeOH(10/1)
fr.8(1.479g) fr.1(37mg) fr.2(274mg) fr.3(275mg) fr.4(1.36g) fr.5(3.595g) fr.6(2.431g) fr.7(367mg)
fr. 5-1
Reverse-phase column chromatography
(3×15, Silica gel 100 C18-Reversed phase) with 20∼100%MeOH fr. 5-2 fr. 5-3 fr. 5-4(2.5251g)
Normal-phase column chromatography with CHCl3/MeOH/H2O (7.5/2.5/0.3)
fr.5-4-1 fr.5-4-2 fr.5-4-3 fr.5-4-4(143.9mg) fr.5-4-5(316.2mg) fr.5-4-6 fr.5-4-7 20%MeOH 40%MeOH 60%MeOH 80%MeOH 100%MeOH
fr. 5-5
fr. 5-4-5-1
(2.7mg) fr. 5-4-5-2(12.1mg)
fr. 5-4-5-3 (21.5mg)
Normal-phase column chromatography with CHCl3/MeOH/H2O (8/2/0.1) fr. 5-4-5-4 (53.7mg) Compound Ⅲ, Ⅳ fr. T1 (21.2mg) (5.5mg)fr. T2 (2.8mg)fr. T3 fr. T4 (79.6mg) Prep TLC with CHCl3/MeOH/H2O (7.5/2.5/0.3)
fr.T4-H1 (26.5mg) fr. T5 (6.6mg) fr.T4-H2 (0.5mg) HPLC (μBondapak C18, 7.8×300㎜ column) with 70%MeOH
Compound Ⅰ
fr. 5-4-5-5 (53.7mg)
20%MeOH 40%MeOH 60%MeOH 80%MeOH 100%MeOH fr.1 (793.1mg) fr.2 (75.9mg) fr.3 (71.2mg) fr.4 (23.6mg) fr.5 (128.5mg)
Reverse-phase column chromatography (3×15, Silica gel 100 C18-Reversed phase) with 20∼100 %MeOH
Compound Ⅱ
Dried Eurya emarginata powder (175.8g) 1) Extraction with 80%MeOH 2) stirring for 24h at room temperature 3) vacuumfiltration
80% MeOHExt. (58.210g)
Suspension with water (1L) Hexane (1L×3) EtOAc (1L×3) n-Butanol (1L×3) Hexane fr. (518mg) EtOAc fr. (9.976g) n-BuOHfr. (8.090g) H2O (8.759g)
1) dissolved in EtOAc 2) normal-phase column chromato
graphy(5×22, Kieselgel 60) with EtOAc/MeOH(10/1)
fr.8(1.479g) fr.1(37mg) fr.2(274mg) fr.3(275mg) fr.4(1.36g) fr.5(3.595g) fr.6(2.431g) fr.7(367mg)
fr. 5-1
Reverse-phase column chromatography
(3×15, Silica gel 100 C18-Reversed phase) with 20∼100%MeOH fr. 5-2 fr. 5-3 fr. 5-4(2.5251g)
Normal-phase column chromatography with CHCl3/MeOH/H2O (7.5/2.5/0.3)
fr.5-4-1 fr.5-4-2 fr.5-4-3 fr.5-4-4(143.9mg) fr.5-4-5(316.2mg) fr.5-4-6 fr.5-4-7 20%MeOH 40%MeOH 60%MeOH 80%MeOH 100%MeOH
fr. 5-5
fr. 5-4-5-1
(2.7mg) fr. 5-4-5-2(12.1mg)
fr. 5-4-5-3 (21.5mg)
Normal-phase column chromatography with CHCl3/MeOH/H2O (8/2/0.1) fr. 5-4-5-4 (53.7mg) Compound Ⅲ, Ⅳ fr. T1 (21.2mg) (5.5mg)fr. T2 (2.8mg)fr. T3 fr. T4 (79.6mg) Prep TLC with CHCl3/MeOH/H2O (7.5/2.5/0.3)
fr.T4-H1 (26.5mg) fr. T5 (6.6mg) fr.T4-H2 (0.5mg) HPLC (μBondapak C18, 7.8×300㎜ column) with 70%MeOH
Compound Ⅰ
fr. 5-4-5-5 (53.7mg)
20%MeOH 40%MeOH 60%MeOH 80%MeOH 100%MeOH fr.1 (793.1mg) fr.2 (75.9mg) fr.3 (71.2mg) fr.4 (23.6mg) fr.5 (128.5mg)
Reverse-phase column chromatography (3×15, Silica gel 100 C18-Reversed phase) with 20∼100 %MeOH
Scheme 1. Systematic purification using the solvent partitioning and silica gel chromatography from Eurya emarginata.
fr. T4-H2). Further, a subfraction T4-H1 was purified to obtain compound Ⅱ (Cornoside, Figure 2). A subfraction 5-4-5 (316.2 mg) was purified by a normal-phase column chromatography with CHCl3/MeOH/H2O (8/2/0.1) to
obtain 5 subfractions (fr.5-4-5-1~fr.5-4-5-5). A subfraction 5-4-5-3 (21.5 mg) was further purified to compound Ⅲ and Ⅳ (Eutigoside B and C, Figure 3).
1-2. Isolation of the eutigoside B and C
The leaves of Eurya emarginata was collected in the campus of Cheju National University, and air-dried in the dark place. The dried leaves (150 g) were extracted using 80% aqueous methanol (1L × 3) after standing a week at room temperature. The liquid layer was filtrated, and the solvent was evaporated under reduced pressure to give the crude extract (48.8 g). After water (1L) was added to the extract, the aqueous layer was successively partitioned into hexane, ethyl acetate and n-butanol. A part (1.5 g) of the ethyl acetate fraction (7.7 g) was purified through reversed phase SiO2 column using gradient elution of aqueous
methanol (20% to 100%) to give five fractions (fr.1-5). The polar fraction 1 (603 mg) was subjected to Sephadex LH-20 column chromatography using CH2Cl2/acetone/methanol (3/2/0 to 1/4/0 to 2/7/1) to give 32 fractions. The
fraction 26 (13 mg) was further purified by C18 HPLC to give eutigoside C (5.3 mg). The fraction 30 (30 mg) was also purified by C18 HPLC to give the eutigoside B (3.8 mg). The polar fraction 32 (300 mg) was purified by SiO2 CC to
H O O H O H H H O H H H O O H O O R 1 2 3 4 5 6 7 8 1' 2' 3' 4' 5' 6' 1'' 2'' 3'' 4'' 5'' 6'' 7'' 8'' 9'' O H O O H O H H H O H H H O O H O O R 1 2 3 4 5 6 7 8 1' 2' 3' 4' 5' 6' 1'' 2'' 3'' 4'' 5'' 6'' 7'' 8'' 9'' O R = H Eutigoside C R = OH Eutigoside B R = H Eutigoside C R = OH Eutigoside B
Figure 1. The structure of isolated compound Ⅰ(Quercitrin) from EtOAc subfraction 4.
Figure 2. The structure of isolated compound Ⅱ (Cornoside) from EtOAc subfraction 5-4-5-T4-H1.
Eutigoside B (Figure 4) - 1H NMR (400 MHz, methanol-d4) d 7.63 (1H, d, 16.0, H7''), 7.47 (2H, d, 8.6, H2'', H6''), 6.97 (2H, m, H2, H6), 6.81 (2H, br d, 8.6, H3'', H5''), 6.35 (1H, d, 16.0, H8''), 6.07 (2H, d, 10.0, H3, H5), 4.48 (1H, dd, 12.0, 2.2, H6'), 4.29 (1H, dd, 12.0, 6.0, H6'), 4.24 (1H, d, 7.8, H1'), 3.92 (1H, dt, 11.9, 6.1, H8), 3.64 (1H, dt, 11.9, 6.1, H8), 3.49 (1H, dd, 9.0, 6.0, H5'), 3.31-3.39 (2H, m, H3', H4'), 3.16 (1H, dd, 9.0, 7.8, H2'), 2.04 (2H, t, 6.1, H7). 13C NMR (methanol-d4) d 187.8 (C4), 169.1 (C9''), 161.4 (C4''), 154.4 (C2), 154.3 (C6), 146.8 (C7''), 131.2 (C2'', C6''), 128.0 (C3), 127.9 (C5), 116.9 (C3'', C5''), 115.0 (C8''), 104.4 (C1'), 77.9 (C3'), 75.5 (C5'), 75.0 (C2'), 71.8 (C4'), 69.2 (C1), 65.9 (C8), 74.6 (C6'), 41.0 (C7) ; Consistent with C23H26O10.
Eutigoside C (Figure 5) - 1H NMR (400 MHz, methanol-d4) d 7.71 (1H, d, 16.0, H8''), 7.62 (2H, m, H2'' and H6''), 7.40 (3H, m, H3'', H4'', H5''), 6.97 (2H, m, H2, H6), 6.56 (1H, d, 16.0, H8''), 6.06 (2H, br d, 10.4, H3, H5), 4.50 (1H, dd, 11.8, 2.0, H6'), 4.32 (1H, dd, 11.8, 2.0, H6'), 4.25 (1H, d, 7.8, H1'), 3.92 (1H, dt, 10.2, 6.5, H8), 3.65 (1H, dt, 10.2, 6.5, H8), 3.51 (1H, dd, 9.0, 6.0, H5'), 3.34 (2H, m, H3', H4'), 3.16 (1H, dd, 9.0, 7.8, H2'), 2.04 (2H, t, 6.5). 13C NMR (methanol-d4) d 187.8 (C4), 168.5 (C9''), 154.4 (C2), 154.3 (C6), 146.5 (C7''), 135.7 (C1''), 131.6 (C4''), 130.1 (C2'', C6''), 129.3 (C3'', C5''), 128.0 (C3), 127.9 (C5), 118.7 (C8''), 104.4 (C1'), 77.9 (C3'), 75.4 (C2'), 75.0 (C5'), 71.7 (C4'), 69.2 (C1), 65.9 (C8), 64.8 (C6''), 41.0 (C7) ; Consistent with C23H26O9.
Dried Eurya emarginata powder (150g) 1) Extraction with 80% MeOH 2) stirring for 24h at room temperature 3) vacuum filtration
80% MeOH Ext. (48.8g)
Suspension with water (1L) Hexane (1L×3) EtOAc (1L×3) n-Butanol (1L×3)
Hexane fr. (320mg) EtOAc fr. (7,665mg) n-BuOH fr. (12,105mg) H2O (15,400mg)
1) dissolved in EtOAc
2) Reverse-phase column chromatography
(3×15, Silica gel 100 C18-Reversed phase) with 20∼100% MeOH
fr. 1 (603mg)
fr. 2 fr. 3 fr. 4
20%MeOH 40%MeOH 60%MeOH 80%MeOH 100%MeOH fr. 5 fr.1-1 fr.1-2 fr.1-26 (13mg) fr.1-30 (30mg) fr.1-31 fr.1-32 (300mg) Sephadex LH-20 column chromatography
(CH2Cl2/acetone/MeOH = 3/2/0 to 1/4/0 to 2/7/1)
RP HPLC RP HPLC SiO2column
Eutigoside B Eutigoside C Quercitrin Dried Eurya emarginata powder (150g)
1) Extraction with 80% MeOH 2) stirring for 24h at room temperature 3) vacuum filtration
80% MeOH Ext. (48.8g)
Suspension with water (1L) Hexane (1L×3) EtOAc (1L×3) n-Butanol (1L×3)
Hexane fr. (320mg) EtOAc fr. (7,665mg) n-BuOH fr. (12,105mg) H2O (15,400mg)
1) dissolved in EtOAc
2) Reverse-phase column chromatography
(3×15, Silica gel 100 C18-Reversed phase) with 20∼100% MeOH
fr. 1 (603mg)
fr. 2 fr. 3 fr. 4
20%MeOH 40%MeOH 60%MeOH 80%MeOH 100%MeOH fr. 5 fr.1-1 fr.1-2 fr.1-26 (13mg) fr.1-30 (30mg) fr.1-31 fr.1-32 (300mg) Sephadex LH-20 column chromatography
(CH2Cl2/acetone/MeOH = 3/2/0 to 1/4/0 to 2/7/1)
RP HPLC RP HPLC SiO2column
Eutigoside B Eutigoside C Quercitrin
Scheme 2. Isolation procedure of eutigoside B and eutigoside C from Eurya
Figure 4. The 1H-NMR and 13C-NMR spectrum of eutigoside B from Eurya
Figure 5. The 1H-NMR and 13C-NMR spectrum of eutigoside C from Eurya
2. Analysis of cytotoxic- or apoptotic events
2-1. Effects of the extracts of E. emarginata on the growth of tumor cells
The effects of extracts from E. emarginata on the growth of tumor cells were assessed using a MTT assay. Briefly, tumor cells were cultured for 4 days in a medium containing 100 ㎍/㎖ of the MeOH extract, the hexane fraction, the EtOAc fraction, the BuOH fraction or the H2O fraction. The MTT result showed
(Table 5) that the EtOAc fraction markedly inhibited the growth of leukemia cells including HL-60 (acute promyelocytic leukemia cells), KG-1 (acute myelogenous leukemia cells), U937 (histiocytic lymphoma cells), K562 (chronic myelogenous leukemia cells) and Jurkat (acute T cell leukemia cells) by 70, 63, 72, 45 and 66%, respectively. However, the extract or solvent fractions only marginally inhibited the growth of A549 (lung carcinoma cells), SNU-C5 (colon cancer cells), HCT-15 (colon cancer cells), SNU-16 (stomach cancer cells), MCF-7 (breast cancer cells), SK-OV-3(ovary cancer cells), A498 (kidney cancer cells), MIA PaCa-2 (pancreas cancer cells), Hep-G2 (hepatoblastoma cells), SK-N-SH (neuroblastonema cells), and A431 (epidermoid carcinoma cells). In the following experiments, HL-60 cells were used to investigate the action mechanism of the components of E. emarginata, because the EtOAc fraction of
E. emarginata was found to be the most cytotoxic against the HL-60 cells among
Table 5. Inhibitory effects of the several extracts from Eurya emarginata on the growth of tumor cells
Cell line Inhibition (%)
80% MeOH Hexane EtOAc n-BuOH H2O
HL-60 53.46±1.645* 31.33±3.271* 70.11±3.683* 34.65±2.342* 11.78±2.251* KG-1 62.98±2.054* 40.48±3.196* 63.07±2.019* 64.78±3.007* 19.74±4.481* U937 23.45±3.801* 8.11±2.358* 72.25±3.188* 69.89±2.299* 37.40±4.957* K562 28.52±3.145* 17.96±4.614* 45.18±2.851* 16.96±3.828* 19.66±3.568* JurKat 65.87±4.102* 17.74±3.986* 66.34±2.814* 58.83±4.573* 45.16±4.259* MCF-7 2.49±1.135* 33.86±4.471* 12.34±3.483* 10.45±3.193* 17.28±4.636* HCT-15 25.14±2.045* 40.69±3.639* - 18.37±6.560 12.20±2.384* 39.10±3.588* SK-OV-3 8.07±3.789* 16.50±4.993* - 8.76±4.245* - 6.81±1.529* - 2.71±1.601* A498 3.47±1.234* - 0.71±2.488* 4.29±2.156* 20.68±3.204* - 8.35±2.845* SNU-16 4.07±4.148* 28.70±3.203* 23.62±5.370 23.62±5.244 10.85±4.627* SNU-C5 19.12±2.546* 8.75±5.235 31.76±3.888* 49.46±3.705* 5.50±6.074 MIA PaCa-2 1.92±1.255* 16.76±2.064* 9.33±2.254* 7.85±1.833* 0.51±4.602* Hep-G2 3.96±1.947* 2.98±3.198* 6.83±4.403* 4.13±4.415* 5.85±7.748 A431 0.03±1.526* 10.31±8.188 1.47±3.539* 3.98±4.430* 4.33±4.837* SKN-SH 30.39±4.762* 65.77±1.457* 28.36±3.077* 5.45±2.718* 7.20±6.372 A549 3.94±4.180* 6.97±4.842* 7.35±4.536* 7.65±2.870* 15.46±4.305*
The cancer cells (1.0∼3.0×10⁵cells/㎖) were treated for 4 days with 100 ㎍/㎖ of the extracts in
96-microwell plates. After incubation, 3-(4,5-dimehtylthiazol)-2,5-diphenyltetrazolium bromide (MTT) was added and incubation was continued for further 4 hours. The formazan salt formed was dissolved in dimethylsulfoxide, and quantified using a microplate reader at 540 nm. The mean absorbance value for each extract was calculated. Results are expressed as the percentage inhibition that produced a reduction in the absorbance in extract-treated cells compared to the untreated controls. All the experiments were performed in triplicate. The data is presented as a mean ±SD. *P< 0.05 compared to the control.
2-2. Cell surface antigen analysis
The present study examined the differentiation induction of HL-60 cells by observing change of the expression of cell surface antigen. When HL-60 cells were treated with 100 ㎍/㎖ of the crude extraction, the ability of HL-60 cells to express CD 66b or CD 14 antigens was unchanged when compared with the control (Figure 6). The result indicates that the HL-60 cells are not differentiated to mature granulocytes or monocytes by E. emarginata.
2-3. Effects of the EtOAc subfraction of E. emarginata on the growth of HL-60 cells
The effects of components from E. emarginata on the growth of HL-60 cells were assessed using the MTT assay. Briefly, the HL-60 cells were cultured for 4 days in a medium containing 100 ㎍/㎖ of the components from E. emarginata. As shown in Figure 7, the eutigoside C of its leaves markedly inhibited the growth of HL-60 cells.
2-4. Induction of apoptosis by E. emarginata in HL-60 cells
The degree of the chromosomal DNA fragmentation was determined to assess the onset of apoptosis of HL-60 cells by the extracts of E. emarginata. When the HL-60 cells was treated with 100 ㎍/㎖ of the MeOH extract or EtOAc fraction, and 100 ㎍/㎖ of the eutigoside C for 24 h, internucleosomal cleavage of genomic DNA resulting in DNA ladder was observed (Figure 8). When the HL-60 cells were stained with the DNA-specific fluorochrome, propidium iodide, the EtOAc fraction or eutigoside C was found to increase the proportion of sub-G1 hypodiploid cells (Figure 9 and Figure 10).
A
B
CONTROL
TREATED
A
B
CONTROL
TREATED
Figure 6. Cell surface antigen analysis in HL-60 cells.
The cells were treated for 6 days with the 80% MeOH extract of Eurya marginata (100 ㎍/㎖) and expressions of CD 66b (A) and CD 14 (B) antigens were analyzed by FACS.
Gro
w
th Inhibiti
on(%
)
0
20
40
60
80
80%MeOH EtOAC fr. EF 5-4-5-3 Eutigoside- B Eutigoside-C
*
*
*
*
Gro
w
th Inhibiti
on(%
)
0
20
40
60
80
80%MeOH EtOAC fr. EF 5-4-5-3 Eutigoside- B Eutigoside-C
*
*
*
*
Figure 7. Inhibitory effects of Eurya emarginata on the growth of HL-60 cells. The HL-60 cells were treated for 4 days with 100 ㎍/㎖ of components of
Marker CON MeOH EtOAc Euti-C
Marker CON MeOH EtOAc Euti-C
Figure 8. DNA fragmentation by the components of Eurya emarginata in HL-60 cells. The DNA was isolated and subjected to 1.5% agarose gel
electrophoresis and visualized with ethidium bromide staining. The HL-60 cells (3.0×10⁶cells/㎖) were treated with several extracts (100㎍/㎖) for 24 hours. Lane M: DNA marker, Lane 1: Control, Lane 2: 80% MeOH extract, Lane 3: EtOAc fraction, Lane 4: Eutigoside C.
A
B
Apoptotic G0+G1 S phase G2+MCON (× 200)
EtOAc (× 200)
A
B
Apoptotic G0+G1 S phase G2+MA
B
Apoptotic G0+G1 S phase G2+MCON (× 200)
EtOAc (× 200)
Figure 9. The degree of apoptosis is represented as the DNA content measured by flow cytometric analysis (left panel) and the fluorescence micrographs (right panel) of cells with highly condensed nuclei stained with
4.6-diamidino-2-phenyl-indole (DAPI). The HL-60 cells (3.0×10⁵cells/㎖) were
treated without (A) or with EtOAc fraction (100 ㎍/㎖) of Eurya emarginata (B) for 24 hours.
A
B
Apoptotic G0+G1 S phase G2+MCON(× 400)
Eutigoside C(× 400)
A
B
Apoptotic G0+G1 S phase G2+MA
B
Apoptotic G0+G1 S phase G2+MCON(× 400)
Eutigoside C(× 400)
Figure 10. The degree of apoptosis is represented as the DNA content measured by flow cytometric analysis (left panel) and the fluorescence micrographs (right panel) of cells with highly condensed nuclei stained with
4.6-diamidino-2-phenyl-indole (DAPI). The cells (3.0×10⁵cells/㎖) were treated
These results showed that the EtOAc fraction or eutigoside C induces the apoptosis of HL-60 cells, and were supported by the increase in the number morphologic changes (Figure 9 and Figure 10) (cell shrinking, the condensation of chromatin, and the membranous apoptotic bodies), which are characteristic of apoptosis.
2-5. Expressions of c-Myc by the EtOAc fraction in HL-60 cells
This study examined the ability of E. emarginata to affect the expression of c-Myc using RT-PCR analysis and Western blot analysis. The treatment of the HL-60 cells with 100 ㎍/㎖ of the EtOAc fraction resulted in the decrease of c-Myc mRNA expression as well as c-Myc protein in a time-dependent manner (Figure 11-A and Figure 11-B).
2-6. Expressions of Bcl-2 and Bax by the eutigoside C in HL-60 cells
In order to understand the induction mechanism of apoptosis by the EtOAc fraction of E. emarginata, the present study examined expression levels of Bcl-2 family using RT-PCR analysis and Western blot analysis. The eutigoside C showing the cytotoxic effect was isolated from the leaves of E.
emarginata. Bcl-2, an anti-apoptotic protein, forms homo- or hetero-dimer with
the pro-apoptotic protein (i.e., Bax) of Bcl-2 family within the cell and their ratio eventually determines whether the cell takes into the apoptotic pathway. Bcl-2 is known to suppress the apoptosis by controlling the membrane potential of mitochondria and/or preventing calcium depletion of endoplasmic reticulum (Distelhorst et al., 1996; Shimizu et al., 1996). As shown in Figure 12-A and Figure 12-B, the eutigoside C induced the decrease of Bcl-2 level in a
time-dependent manner. Interestingly, however, the Bax level was increased in a time-dependent manner in HL-60 cells with eutigoside C.
2-7. Release of mitochondrial cytochrome c into cytosol in HL-60 cells
This study examined the release of cytochrome c from mitochondria into the cytosol in HL-60 cells using Western blot analysis. It has been reported that the release of cytochrome c from mitochondria to cytosol is a key step to the activation of caspase 9 (Li et al., 1997; Srinivasula et al., 1998). As shown in Figure 13, the treatment with eutigoside C at 100 ㎍/㎖ induced the release of cytochrome c from mitochondria into the cytosol fraction on HL-60 cells in a time-dependent manner.
2-8. Degradation of PARP, an endogenous substrate of caspase-3 in HL-60 cells
From the results showing apoptotic-events by eutigoside C (100 ㎍/㎖), it was determined whether caspases were stimulated. Time-dependent processing of caspase-3 or 9 was shown Figure 14. In untreated HL-60 cells, caspase-3 was present primarily as its intact 32 kDa proform. Induction of apoptosis by the eutigoside C resulted in the appearance of two fragments of 19 kDa and 17 kDa. Also, caspase-9 of 46 kDa was also cleaved into fragments of 37 kDa and 35 kDa in a time-dependent manner. However, caspase-8 was not detected after 100 ㎍/㎖ with the eutigoside C (not shown).
analyzed. As shown in Figure 15, PARP cleavage was detected after 6 h treatment with eutigoside C (100 ㎍/㎖), and increased in a time-dependent manner. As shown in Figure 16, PARP cleavage was markedly increased at concentration higher than 75 ㎍/㎖ of eutigoside C, paralleled with an increase of caspase-3 activity.
These results suggest the involvement of caspase-3 in the onset of apoptosis by the eutigoside C.
c-Myc
β
-Actin
0 2 6 12 24 h
397bp
588bp
A
B
β
-Actin
42 kDa
c-Myc
67 kDa
0 2 6 12 24 h
c-Myc
β
-Actin
0 2 6 12 24 h
397bp
588bp
A
B
β
-Actin
42 kDa
c-Myc
67 kDa
0 2 6 12 24 h
Figure 11. Expression of c-Myc and β-actin in HL-60 cells by a treatment
with the EtOAc fraction. The cells (3.0×10⁵cells/㎖) were treated with EtOAc
fraction (100 ㎍/㎖) of Eurya emarginata. (A) Reverse transcription polymerase chain reaction (RT-PCR) analysis of c-Myc performed after synthesizing the cDNA as described in the ꡒmaterials and methodsꡓ. (B) Western blot analysis of c-Myc using its antibody (67 kDa).
β
-Actin
Bcl-2
Bax
0 3 6 12 24 h
292bp
364bp
588bp
Bcl-2
Bax
26 kDa
21 kDa
0 1 3 6 12 24 h
β
-Actin
42 kDa
A
B
β
-Actin
Bcl-2
Bax
0 3 6 12 24 h
292bp
364bp
588bp
Bcl-2
Bax
26 kDa
21 kDa
0 1 3 6 12 24 h
β
-Actin
42 kDa
A
B
Figure 12. Expression of Bcl-2 and Bax in HL-60 cells by a treatment with
the eutigoside C. The cells (3.0×10⁵cells/㎖) were treated with eutigoside C (100
㎍/㎖) of Eurya emarginata. (A) Reverse transcription polymerase chain reaction (RT-PCR) analysis of Bcl-2 and Bax were performed after synthesizing the cDNA as described in the ꡒmaterials and methodsꡓ. (B) Western blot analysis of Bcl-2 or Bax using the antibodies against Bcl-2 recognized a protein at 26 kDa and a 21 kDa protein for Bax.
0 0.5 1 3 6 12 24 h
Cyt. c
Cyt. c
MT fr.
Cytosol fr.
0 0.5 1 3 6 12 24 h
Cyt. c
Cyt. c
MT fr.
Cytosol fr.
Figure 13. Expression of cytochrome-c in the HL-60 cells by a treatment
with eutigoside C. The cells (3.0×10⁵cells/㎖) were treated with the eutigoside C
(100 ㎍/㎖) of Eurya emarginata. Western blot analysis of cytochrome-c using its antibody (11 kDa).
35 kDa
37 kDa
19 kDa
17 kDa
Caspase-9
Caspase-3
β
-Actin
0 0.5 1 3 6 12 24h
42 KDa
35 kDa
37 kDa
19 kDa
17 kDa
Caspase-9
Caspase-3
β
-Actin
0 0.5 1 3 6 12 24h
42 KDa
Figure 14. Immunoblot analysis of caspase-9 and caspase-3 in the HL-60
cells by a treatment with eutigoside C. The cells (3.0×10⁵cells/㎖) were treated
85 kDa
116 kDa
PARP
β
-Actin
0 0.5 1 3 6 12 24h
42 KDa
85 kDa
116 kDa
PARP
β
-Actin
0 0.5 1 3 6 12 24h
42 KDa
Figure 15. Immunoblot analysis of PARP in the HL-60 cells by a treatment
with eutigoside C. The cells (3.0×10⁵cells/㎖) were treated with the eutigoside C
85 kDa
116 kDa
19 kDa
17 KDa
PARP
Caspase-3
β
-Actin
CTL 50 75 100 200
Eutigoside C (㎍/㎖)
42 KDa
85 kDa
116 kDa
19 kDa
17 KDa
PARP
Caspase-3
β
-Actin
CTL 50 75 100 200
Eutigoside C (㎍/㎖)
42 KDa
Figure 16. Immunoblot analysis of PARP and caspase-3 in the HL-60 cells by a treatment with different concentrations of eutigoside C.
3. Cell cycle regulation by the eutigoside C in HL-60 cells
3-1. Inhibition of cell growth by eutigoside C in HL-60 cells
The effects of eutigoside C from E. emarginata on the growth of HL-60 cells were assessed using the MTT assay. This result that markedly inhibited the growth of HL-60 cells in a dose-dependent manner (Figure 17). The IC50
values were found to be 70.66 ㎍/㎖ in acute promyelocytic leukemia HL-60 cells.
3-2. Cell growth arrest induced by the eutigoside C from E.
emarginata
Since the eutigoside C of E. emarginata at 75 ㎍/㎖ induced growth arrest, it was examined whether the expression of mRNA or protein related with growth arrest might be changed with eutigoside C treatment. The G1/S transition is regulated by D-type cyclins that bind to and activate Cdk4 and Cdk6 and cyclin E, which activate Cdk2. It was investigated whether eutigoside C affected the expression of these G1-related genes. The HL-60 cells were treated with the eutigoside C at 75 ㎍/㎖ for the times indicated and the RT-PCR analysis was performed (Figure 18). The expression of Cdk4 was markedly diminished in a time-dependent manner when treated with eutigoside C at 75 ㎍/㎖, while mRNA expression of cyclin D1 was decreased only after 48 h (components of the cyclin-Cdk complex that are active in early G1 phase). In addition, the expression of cyclin E was relatively unaffected by eutigoside C under the same
time-dependent manner when treated with eutigoside C at 75 ㎍/㎖ (components of the cyclin-Cdk complex that are active in late G1 phase).
As shown in Figure 18∼20, the eutigoside C from E. emarginata markedly increased the level of p21CIP1/WAF1 and dramatically inhibited Cdk2 activity. Moreover, the p27KIP1 mRNA level was markedly increased in a time-dependent manner by eutigoside C treatment. This data suggested a possible binding between Cdk2 and CDK inhibitor protein, p21CIP1/WAF1. The association of
21CIP1/WAF1 and Cdk2 by the eutigoside C treatment suggests that the eutigoside
C from E. emarginata treatment-induced p21CIP1/WAF1 blocks Cdk2 activity by direct binding of p21CIP1/WAF1 to Cdk2.
pRB acts as a potent inhibitor of cell growth and is thought to play a crucial role in the decision-making at the G1/S restriction point (Sherr and Roberts, 1995; Weinberg, 1995). The functional activation of pRB depends on its phophorylation status. In cells treated with the eutigoside C, the amount of pRB was markedly diminished in a time-dependent manner after 48 h treatment with eutigoside C at 75 ㎍/㎖ (Figure 20). These results suggest that induction of p21CIP1/WAF1 and down regulation of cyclin D1 may cause hypophosphorylation of pRB after the eutigoside C treatment.
0
20
40
60
80
10
30
50
100
*Grow
th Inhibition(
%
)
* * *Eutigoside C (㎍/㎖)
0
20
40
60
80
10
30
50
100
*Grow
th Inhibition(
%
)
* * *Eutigoside C (㎍/㎖)
Figure 17. Effect of eutigoside C on the growth of HL-60 cells.
638bp
402bp
901bp
912bp
Cyclin E
Cyclin D1
Cdk 2
Cdk 4
0 6 12 24 48h
M
β
-Actin
588bp
638bp
402bp
901bp
912bp
Cyclin E
Cyclin D1
Cdk 2
Cdk 4
0 6 12 24 48h
M
β
-Actin
588bp
Figure 18. Effects of eutigoside C on the levels of cyclins E, cycline D1, cdk 2 and cdk 4 in HL-60 cells. Reverse transcription polymerase chain reaction
(RT-PCR) analysis of cyclins or cdks performed after synthesizing cDNA as described in the ꡒmaterials and methodsꡓ. The cells were incubated with the eutigoside C at the indicated times, total RNA was extracted for RT-PCR analysis.
p21
WAF1/CIP1p27
KIP1496bp
597bp
β
-Actin
588bp
0 6 12 24 48h
M
p21
WAF1/CIP1p27
KIP1496bp
597bp
β
-Actin
588bp
0 6 12 24 48h
M
Figure 19. Effects of eutigoside C on the levels of p21WAF1/CIP1 and p27KIP1 in
HL-60 cells. RT-PCR analysis wasperformed as described in the ꡒmaterials and
methodsꡓ. The cells were incubated with the eutigoside C at the indicated times, total RNA was extracted for RT-PCR analysis.
p21
WAF1/CIP1β
-Actin
0 3 6 12 24 48h
20 kDa
42 KDa
pRB
110 kDa
p21
WAF1/CIP1β
-Actin
0 3 6 12 24 48h
20 kDa
42 KDa
pRB
110 kDa
Figure 20. Effects of eutigoside C on pRB and p21WAF1/CIP1 proteins in HL-60
cells. pRB and p21WAF1/CIP1 was detected by Western blot analysis using anti-pRB
and anti-p21WAF1/CIP1 antibody in cell lysates from untreated cells (0 h) and in cells 3, 6, 12, 24 and 48 hours after treatment with 75 ㎍/㎖ of the eutigoside C.
DISCUSSION
Eurya emarginata (Thunb.) Makino (Theaceae) is a dioecious,
insect-pollinated tree, which combines both sexual reproduction and colonial spread. The distribution is restricted in coastal areas from southern China, southern Korea, to central and southern Japan (Chung and Epperson, 2000). At first, the present study characterized the constituents of the leaves of
E. emarginata, grown in Jeju Island, Korea. The leaves of Eurya have been
used as traditional medicine with the aim of treatment of ulcers or diuretic in the coastal areas of Jeju Island. Four components were isolated (quercitrin, cornoside, eutigoside B and eutigoside C) from the fresh leaves of this plant (Scheme 1~2, Figure 1, Figure 2 and Figure 3). Morita et al. (1974) reported the presence of quercitrin in E. emarginata, however, three other constituents (cornoside, eutigoside B and eutigoside C) have known to exist in other species not in E. emarginata (Jensen et al., 1973, Kahn et
al., 1992). Previous studies suggested that flavonoids including quercitrin
might have several biological activities like as anticancer, antioxidative and anti-inflammation. The cornoside has a novel chemical structure as constituents of higher plants, reported from many species of Cornus (Jensen et al., 1973). Otherwise, the eutigoside B and C are very rare compounds only described from Eurya tigang (Theaceae) (Khan et al., 1992). Furthermore, the biological function of cornoside, eutigoside B and C has been not defined yet. In the present study, eutigosides from E.