Received: April 1, 2020 Revised: May 26, 2020 Accepted: June 11, 2020
OPEN ACCESS
HORTICULTURAL SCIENCE and TECHNOLOGY 38(5):583-594, 2020
URL: http://www.hst-j.org pISSN : 1226-8763 eISSN : 2465-8588
This is an Open Access article distributed under the terms of the Creative Commons Attribution Non-Commercial License which permits unrestricted non-commercial use, distribution, and reproduction in any medium, provided the original work is properly cited.
Copyrightⓒ2020 Korean Society for Horticultural Science.
This work was supported by Korea Institute of Planning and Evaluation for Technology in Food, Agriculture, Forestry (IPET) through Agri-Bio Industry Technology Development Program, funded by Ministry of Agriculture, Food and Rural Affairs (MAFRA) (315020-5).
Drought Tolerance of ‘Fuji’ Apple Trees Grafted onto G, CG, or M Series Rootstocks: Growth and Physiology
Byeong-Ho Choi 1 , Narayan Bhusal 1 , Woo-Tae Jeong 1 , In-Hee Park 2 , Su-Gon Han 2 , and Tae-Myung Yoon 1,2*
1
Department of Horticultural Science, Kyungpook National University, Daegu 41566, Korea
2
Apple Research Institute, Kyungpook National University, Daegu 41566, Korea
*Corresponding author: [email protected]
Abstract
In this study, we assessed the drought tolerance of 1-year-old apple (Malus domestica Borkh.) trees exposed to extreme water stress, focusing on growth and physiological responses. After grafting
‘Fuji’ variety onto M26 and M9 rootstocks or Cornell-Geneva rootstocks (G11, G202, G214, G935, CG4814, and CG5087), the grafted plants were planted in 17-L pots and managed in a greenhouse.
After irrigation was stopped, soil water potential dropped to about –700 hPa in 12 days. The leaf water potential and tree vertical growth rate of drought-stressed trees decreased dramatically, and the decreased growth rate of the G202, G935, and M26 trees, which generally produced a large leaf area, was considerable. Trunk cross-sectional area and leaf area of all trees under drought stress were reduced by almost 50% or more than 60%, respectively. Drought-stressed trees were subjected to control-level irrigation during the recovery of about 11 days, but their leaf water potential still did not fully recover to the control level. Photosynthesis-related parameters also showed a substantial decrease as the soil water potential changed, but the difference among trees was not n oticeable.
Fine root (<2 mm diameter) dry weight showed the greatest decrease in the CG5087 tree, whereas the G935 tree was insensitive. The root:shoot biomass ratio of the CG5087 and M26 trees was 0.24 and 0.23, respectively, and 0.38 for the G214 and CG4814 trees. The CG5087 tree was the most sensitive to drought stress, whereas drought tolerance was higher in the G202, G214, and G935 trees than in the M26 tree, which had a comparable drought tolerance to the G11, CG4814, and M9 trees.
Additional key words: apple rootstock, dry matter, photosynthesis, water deficit, water potential
Introduction
The provision of adequate irrigation according to the growth stage of fruit trees is critical for obtaining quality fruit. Water stress, especially during the early stage of growth, affects the cell division of shoots and fruit, so the failure to provide proper irrigation to fruit trees during the early growing season can negatively affect productivity, as well as vegetative growth (Cui et al., 2009;
Girona et al., 2010; Beyá-Marshall et al., 2018). Severe spring droughts, which have become a
prevalent phenomenon in Korea, are hindering the proper response to periodic irrigation and causing depletion of water resources for irrigation in the early stage of apple (Malus domestica) tree growth. Moreover, the frequency and intensity of drought in spring, due to climate change, is not easily predictable. Thus, drought-tolerant apple rootstocks (Li et al., 2002) may have advantages for fruit production, even in areas with insufficient irrigation water or low precipitation.
Plants adapt to soil water deficit in several ways during the dry period. A well-developed, deep-penetrating root system is one of the effective strategies for plants to withstand drought (Comas et al., 2013). If the water available to the plant is restricted, the root:shoot ratio in the dry matter partitioning increases, reducing the demand for transpiration per unit root length because roots are less sensitive to growth inhibition compared with shoots (Wu and Cosgrove, 2000). Apple trees are relatively drought tolerant, but stomatal closure occurs when the leaf water potential falls below ‑ 2.0 MPa (Atkinson et al., 2000). Although the closing of the stomata can prevent water loss by transpiration, it also decreases the rate of photosynthesis, which, in turn, reduces the production of dry matter, such as leaves, shoots, and roots (Fernandez et al., 1997; Šircelj et al., 2007).
Despite an incomplete understanding of the mechanisms that confer drought tolerance to rootstocks, the capacity of rootstocks for drought tolerance may alter the behavior of grafted scions (Bauerle et al., 2011; Serra et al., 2014). The contribution of rootstocks to water stress tolerance depends on several factors, one of which is vigor (Corso and Bonghi, 2014). Vigorous rootstocks increase the allocation of assimilates to the roots, which increases the surface of the root system that can come into contact with the soil, thereby increasing the ability to explore for moisture (Bauerle et al., 2011).
According to Psarras and Merwin (2000), the root:shoot ratio contributed more decisively to the drought tolerance of the apple trees relative to rootstock vigor.
Specific elite Cornell-Geneva apple rootstocks show high resistance to fire blight, good tolerance to apple replant disease, and outperform M26, M9, and other existing standard rootstocks not only for productivity but also for cold temperature tolerance (Robinson et al., 2006; Auvil et al., 2011). The purpose of this study was to assess the drought tolerance of 1-year-old ‘Fuji’ apple trees grafted on several promising Cornell-Geneva rootstocks and the most common dwarfing rootstocks, M26 and M9, in terms of vegetative growth and physiology.
Materials and Methods Plant Materials
This study was carried out in a non-heated greenhouse with automatic ventilation and shading control in the experimental fields of Kyungpook National University, Gun-Wi, Korea (36°06'48.3"N, 128°38'35.8"E). Six types of the apple (Malus domestica) G and CG rootstock series from Cornell University, and the apple rootstocks M26 and M9, which are widely used in Korea, were investigated. The ‘Fuji’ variety was grafted as a scion onto 1-year-old G11, G202, G214, G935, CG4814, CG5087, M26, and M9 rootstocks. On March 5, 2017, the grafted trees were planted in 17-L pots (one tree per pot) filled with a soil mix of sand:horticultural growing media (72% coco peat, 8.5% peat moss, 6% vermiculite, 9.5%
perlite):compost at a ratio of 5:3:2 (v/v/v). From 2 months after planting to the end of the experiment, the entire pot was
wrapped in black, non-woven fabric to prevent excessive temperature increases in the rhizosphere and to retain soil
moisture.
Irrigation Regimes
Water was sufficiently supplied to all grafted trees once or twice daily until treatment initiation, depending on the growing season and meteorological conditions, by drip irrigation with pressure compensating nozzles. The water management regime was changed after June 23, on the 111th day after planting. In the drought stress (DS) treatment, the water supply was ceased completely from June 24 until July 5, when the soil water potential (Ѱ
soil) fell below ‑ 695 hPa, followed by re-irrigation for 1 week. The second DS treatment was then induced by stopping irrigation again for 17 days from July 12 to July 28. Afterward, DS was discontinued, and from July 29 to August 8, trees under DS were irrigated in the same way as those under the control (CT) treatment. Meanwhile, trees under the well-irrigated CT condition were subjected to sufficient irrigation (2.0 L per day) throughout the experiment.
The experimental design comprised a randomized block for each of five blocks (CT vs. DS), and there was a single tree of the same rootstock in one of the blocks. Foliar fertilization was applied as 0.3% urea on May 2, and each pot was fertilized with 20 g of compound fertilizer (N:P:K = 21:17:17) on May 13.
Measurements
During the experiment, Ѱ
soilwas measured using a hand-made tensiometer that allowed automatic data recording (Thalheimer, 2013), and the moisture level in the soil was recorded every 3 h during the treatment. The leaf water status was measured using a pressure chamber (Model 3005, Soil Moisture Equipment Corp., Goleta, CA, USA) three times;
before the DS initiation (June 23), on the 17th day after re-irrigation of DS trees (July 28), and on the 11th day after the cessation of DS (August 8). The predawn leaf water potential (Ѱ
pd) was measured in one leaf per replication between 04:00 and 06:00 h, and the midday leaf water potential (Ѱ
md) was measured in the same way and on the same day between 12:00 and 14:00 h. These leaves used for Ѱ
leafmeasurement were reflected in the leaf area and leaf dry weight data.
The amount of evapotranspiration per day per tree between July 5 and July 11 was measured using a digital SVI-50C weighing scale (Acculab, Edgewood, NY, USA). The measurements were made twice daily at 05:00 and 20:00 h by weighing each pot, and the weight difference was estimated as the amount of evapotranspiration per day.
Net photosynthetic rate (P
n), stomatal conductance (G
s), and transpiration rate (E) were measured between 11:00 and 15:00 h at approximately 1-week intervals during the treatment using a portable gas exchange system (LCI Portable Photosynthesis System, ADC BioScientific Ltd., Hoddesdon, UK) on 1 ‑ 2 mature leaves per replication. The photosynthetic photon flux density was fixed at 1,500 µmol·m
-2·s
-1with a halogen lamp for photosynthesis measurements. Water-use efficiency (WUE) was calculated as P
n/ E.
Tree height was recorded at approximately 1-week intervals from June 16 to the end of the experiment. The scion
diameter was measured twice using a digital Vernier caliper (CD-20CPX, Mitutoyo, Kawasaki, Japan) in the lattice
direction, 5 cm above the graft union, after which the trunk cross-sectional area (TCA) was obtained. The relative growth
rate (RGR) of ‘Fuji’ trees subjected to DS was calculated by dividing the weekly tree vertical growth under DS by the
weekly tree vertical growth under the CT condition. On August 9, at the end of the 11-day recovery period, the area of
each leaf attached to the tree was determined using a portable leaf area meter (LI-3000, with conveyor belt assembly,
Li-Cor, Inc., Lincoln, NE, USA) before investigating various parts of the plants using destructive methods. Afterward, all
trees (both DS and CT) were separated into shoot, leaf, coarse root (>2 mm diameter), and fine root (<2 mm diameter)
categories. Samples were then dried at 72°C for 72 h to obtain the dry weight of each sample.
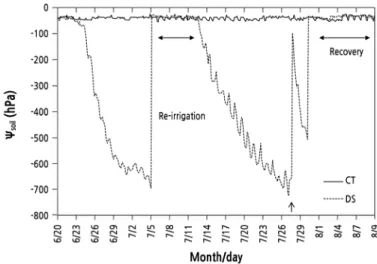
Fig. 1. Change in soil water potential (Ѱ
soil) during the control (CT) and drought stress (DS) treatments. Vertical arrow indicates the point of water replenishment when the water in the tensiometer tube was drained completely.
Data were analyzed by one- or two-way analysis of variance (ANOVA) using SAS 9.4 software (SAS Institute, Inc., Cary, NC, USA). Significant differences among the rootstocks were evaluated by Duncan’s multiple range test at p <
0.05.
Results
Soil Water Potential (Ѱ soil ) and Evapotranspiration
During the treatment, the Ѱ
soilof the CT trees was generally maintained at ‑ 30 to ‑ 55 hPa (Fig. 1) . When the Ѱ
soilunder DS fell below about ‑ 700 hPa, the tensiometer’s measurement range was exceeded, so the water in the tensiometer tube was replenished again. Re-irrigation was performed for 1 week from July 5, when the Ѱ
soilfell below ‑ 695 hPa in the DS treatment. Then, stress resumed from July 12 to July 28. From July 29 to August 8, at the end of the experiment, DS maintained the Ѱ
soilbetween ‑ 30 and ‑ 47 hPa.
In the CT condition, the evapotranspiration volume was generally higher in the G202, G935, and M26 trees, and lower in the CG4814 tree relative to the other trees during the re-irrigation, although slight differences were found depending on the date (Fig. 2) . In the DS treatment, there was no noticeable difference between rootstock types during re-irrigation, despite lower evapotranspiration in the G935 tree (388, 351, and 200 g) than in the other trees (ranges: 431 ‑ 462, 366 ‑ 396, and 218 ‑ 232 g) on July 5, 6, and 8, respectively.
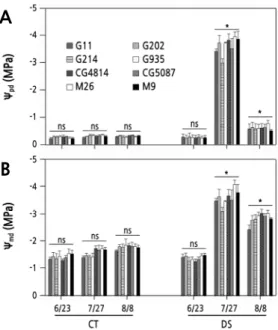
Leaf Water Potential
On June 23, before initiation of DS, the Ѱ
pdof 1-year-old ‘Fuji’ apple trees was ‑ 0.26 to ‑ 0.34 MPa in CT and DS conditions, regardless of the rootstock types, and the Ѱ
mdwas ‑ 1.25 to ‑ 1.55 MPa (Fig. 3) . On July 27, the Ѱ
pdwas ‑ 0.30 to ‑ 0.40 MPa in the CT. In the DS treatment, all trees were in severe water deficit status throughout the day, with Ѱ
pdof
‑ 2.95 MPa for G214 and ‑ 3.90 MPa for M26. The Ѱ
mdrange of the CT trees was ‑ 1.35 to ‑ 1.75 MPa, but in the DS
treatment, the Ѱ
mdfor G214 was ‑ 3.08 MPa, and for M26 the Ѱ
mddecreased to ‑ 4.01 MPa. On August 8, the 11th day
Fig. 2. Changes in evapotranspiration in ‘Fuji’ tree pots for 1 week during re-irrigation in the control (CT) and drought stress (DS) treatments. Vapor pressure deficit (VPD) between 05:00 and 20:00 h on the day indicated. Vertical bars represent the mean ± standard error. * and ** significant at p < 0.05 and 0.01, respectively, ns: not significant.
A
B
Fig. 3. Changes in predawn (A) and midday (B) leaf water potential of 1-year-old ‘Fuji’ apple trees grafted on various rootstocks during the control (CT) and drought stress (DS) treatments on June 23 (before drought), July 27 (17th day after re-irrigation), and August 8 (11th day after the restart of irrigation in the same manner as the CT). Vertical bars represent the mean ± standard error. * significant at p < 0.05, ns: not significant.
since irrigation of the DS treatment was resumed in the same manner as in the CT, the Ѱ
pdof the DS trees was ‑ 0.55 MPa
for M9 and ‑ 0.80 MPa for M26, which was still lower than ‑ 0.31 to ‑ 0.38 MPa in the CT. The Ѱ
mdrange was ‑ 1.64
to ‑ 1.85 MPa in the CT. In the DS treatment, the Ѱ
mdwas ‑ 2.42 MPa for G11 and ‑ 3.01 MPa for M26 and CG4814,
indicating a slight recovery tendency, but it was still markedly lower than in the CT.
Fig. 4. Changes in photosynthetic rate (P
n) (A1, A2), stomatal conductance (G
s) (B1, B2), transpiration (E ) (C1, C2), and water-use efficiency (WUE) (D1, D2) of ‘Fuji’ apple trees grafted on various rootstocks during the control (CT) and drought stress (DS) treatments. Vapor pressure deficit (VPD) between 11:00 and 15:00 h on the day indicated. Vertical bars represent the mean ± standard error. * significant at p < 0.05, ns: not significant.
Leaf Gas Exchange and Water-Use Efficiency (WUE)
During the treatment, P
n, G
s, and E showed a similar pattern in both CT and DS conditions. CT trees had a P
nrange of
9.0 to 14.7 µmol·m
-2·s
-1for the entire period, with no noticeable difference among the rootstock types (Fig. 4) . On June
23, before stress was initiated, the P
nrange of DS trees was 12.0 to 12.8 µmol·m
-2·s
-1, but on June 29, six days after the
cessation of water supply, the P
nfor G11 and M9 was 5.1 and 5.0 µmol·m
-2·s
-1, respectively, and dropped to 3.6
µmol·m
-2·s
-1for G935 and M26 trees. The P
nof DS trees recovered to the CT level on July 6, on the 2nd day since
re-irrigation. On July 27, when the stress was at its peak, the G
swas 0.003 to 0.015 mol·H
2O·m
-2·s
-1, and P
nwas very low,
at 1.0 to 2.0 µmol·m
-2·s
-1. On August 8, the 11th day after the stress ended and sufficient watering began, the P
nof DS
trees was highest in G11 (5.4 µmol·m
-2·s
-1) and lowest in CG5087 (3.5 µmol·m
-2·s
-1), but the differences between trees
were not substantial. Under water-constrained environments, WUE variations tended to improve as stress increased
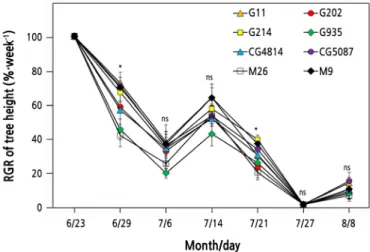
Fig. 5. Changes in the relative growth rate of tree height (RGR of tree height = weekly growth in drought stress / weekly growth in the control treatment) of ‘Fuji’ apple trees subjected to drought stress. Vertical bars represent the mean ± standard error. * significant at p < 0.05, ns: not significant.
(Fig. 4) . The maximum WUE in DS trees was observed on July 27, with 3.8 µmol
-1·mol
-1for M9 and G935, and 2.9 µmol
-1·mol
-1for G11 and G202.
Vegetative Growth and Dry Matter
Lack of soil moisture immediately affected the growth rate of tree height (Fig. 5) . On June 29, six days after the water supply was restricted, M26 and G935 showed the largest vertical growth reductions, with RGR values of 40.8% and 44.4%, respectively. The vertical growth of all DS trees resumed after re-irrigation began on July 5, but after July 12, because of the suspension of irrigation, the vertical growth of all DS trees reduced again. Under DS, the RGR of G214 was 38.4% on July 21, and the RGR of M26 was only 18.9%. On July 27, when the stress almost reached its peak, all trees stopped growing, and from July 29, tree growth tended to recover slightly after irrigation commenced.
The amount of vertical growth of CT trees during the 45-day treatment did not correspond to known rootstock vigor (Table 1) . The G935 tree grew 81 cm, but M26, known as a semi-dwarfing rootstock, was the smallest at 73 cm. In DS, however, the vertical growth of G935 was 18.6 cm, showing a greater growth reduction compared with the other trees.
G202 and M26 produced shoot dry weights of 44.5 and 43.5 g in the CT, respectively, but M9 was 31.7 g. The extent of reduction in shoot dry weight of DS trees ranged from 45% to 49%, and the difference between rootstock types was not large. The reduction rate of leaf dry weight in DS trees was similar to that of shoot dry weight. In DS trees, leaf area was highest for the G202 (2497 cm
2) and M26 trees (2528 cm
2), which produced the highest shoot dry weight, and smallest for the CG4814 tree (2186 cm
2) (Table 1) . Overall, the greater reduction rate of leaf area in DS trees compared with the leaf dry weight might be explained by the exclusion of leaves less than about 2 cm
2that were difficult to measure (Table 1) .
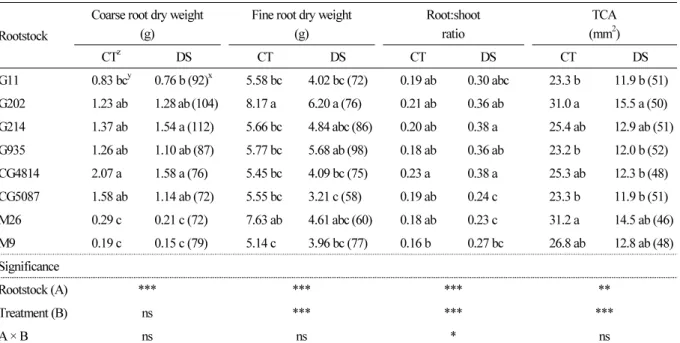
The coarse root dry matter production of each tree during the entire experiment, approximately 5 months, differed
between several rootstock types in both CT and DS conditions (Table 2) . The difference in coarse root development
between trees of G or CG and M series appeared to be a result of the rootstocks’ characteristics. In the CT, the coarse root
dry weight was 2.07 g for the CG4814 tree, but only 0.19 g for the M9 tree. This trend was similar in the DS treatment,
with a higher coarse dry weight recorded for the CG4814 tree (1.58 g) than the M9 tree (0.15 g). The G202 and M26 trees
Table 1. Amount of vertical growth from June 23 to August 8, 2017, and shoot dry weight, leaf dry weight, and leaf area at the end of the experiment
Rootstock
Amount of vertical growth (cm)
Shoot dry weight (g)
Leaf dry weight (g)
Leaf area (cm
2)
CT
zD S CT D S CT D S CT D S
G11 75.6 abc
y27.6 ab (37)
x34.9 bc 15.9 bc (46) 37.1 ab 17.3 ab (47) 6353 ab 2369 ab (37) G202 74.4 abc 20.4 abc (27) 44.5 a 20.8 a (47) 43.4 a 18.4 ab (42) 6982 a 2497 ab (36) G214 80.2 ab 28.8 a (36) 37.5 abc 16.9 bc (45) 36.7 ab 16.7 bc (46) 6331 ab 2304 ab (36) G935 81.0 a 18.6 c (23) 39.2 abc 18.3 ab (47) 40.2 ab 17.8 ab (44) 6627 ab 2402 ab (36) CG4814 73.4 bc 24.0 abc (33) 33.0 c 15.0 c (45) 34.6 b 14.9 c (43) 6045 b 2186 b (36) CG5087 76.8 abc 27.0 abc (35) 38.4 abc 18.0 ab (47) 36.3 ab 17.2 ab (47) 6241 ab 2353 ab (38)
M26 73.0 c 18.7 bc (26) 43.5 ab 20.8 a (48) 43.4 a 19.3 a (44) 6867 a 2528 a (37)
M9 75.2 abc 27.2 abc (36) 31.7 c 15.5 bc (49) 34.5 b 16.4 bc (48) 6038 b 2324 ab (38) Significance
Rootstock (A) * *** * **
Treatment (B) *** *** *** ***
A × B ns ns ns ns
z
CT (control treatment), DS (drought stress).
y
Means in a column followed by the same letters are not significantly different at p < 0.05 by Duncan’s multiple range test.
x
( ): Percentage compared with the CT.
ns,*,**,***
Not significant or significant at p < 0.05, 0.01, and 0.001, respectively.
Table 2. Coarse (>2 mm diameter) and fine (< 2 mm diameter) root dry matter, root:shoot ratio (root/shoot biomass) at the end of the experiment, and increase in trunk cross-sectional area (TCA) of the scion from June 23 to August 8, 2017 Rootstock
Coarse root dry weight (g)
Fine root dry weight (g)
Root:shoot ratio
TCA (mm
2)
CT
zD S CT D S CT D S CT D S
G11 0.83 bc
y0.76 b (92)
x5.58 bc 4.02 bc (72) 0.19 ab 0.30 abc 23.3 b 11.9 b (51)
G202 1.23 ab 1.28 ab (104) 8.17 a 6.20 a (76) 0.21 ab 0.36 ab 31.0 a 15.5 a (50)
G214 1.37 ab 1.54 a (112) 5.66 bc 4.84 abc (86) 0.20 ab 0.38 a 25.4 ab 12.9 ab (51)
G935 1.26 ab 1.10 ab (87) 5.77 bc 5.68 ab (98) 0.18 ab 0.36 ab 23.2 b 12.0 b (52)
CG4814 2.07 a 1.58 a (76) 5.45 bc 4.09 bc (75) 0.23 a 0.38 a 25.3 ab 12.3 b (48)
CG5087 1.58 ab 1.14 ab (72) 5.55 bc 3.21 c (58) 0.19 ab 0.24 c 23.3 b 11.9 b (51)
M26 0.29 c 0.21 c (72) 7.63 ab 4.61 abc (60) 0.18 ab 0.23 c 31.2 a 14.5 ab (46)
M9 0.19 c 0.15 c (79) 5.14 c 3.96 bc (77) 0.16 b 0.27 bc 26.8 ab 12.8 ab (48)
Significance
Rootstock (A) *** *** *** **
Treatment (B) ns *** *** ***
A × B ns ns * ns
z
CT (control treatment), DS (drought stress).
y
Means in a column followed by the same letters are not significantly different at p < 0.05 by Duncan’s multiple range test.
x
( ): Percentage compared with the CT.
ns,*,**,***