Kor. J. Hort. Sci. Technol. 28(5):850-856, 2010
Hypoglycemic Effects of Fruits and Vegetables in Hyperglycemic Rats for Prevention of Type-2 Diabetes
Nazneen Shaik Survay
1†, EunYoung Ko
2, Chandrama Prakash Upadhyay
2, Jang Mi
2†, Se Won Park
2*, DongHa Lee
3, Yi-Sook Jung
3, Do-Young Yoon
1, and SaeJin Hong
41Department of Bioscience and Biotechnology, BMIC, Konkuk University, Seoul 143-701, Korea
2Department of Molecular Biochemistry, Konkuk University, Seoul 143-701, Korea
3Department of Physiology, Ajou University, Suwon 443-721, Korea
4Department of Plant Science, Kangneung National University, Kangneung 210-702, Korea
Abstract. An in vivo oral glucose tolerance test (OGTT) was performed on hyperglycemic male Sprague-Dawley
rats to assess the effect of fruits and vegetables (1 g・kg
-1body weight) on blood glucose levels (ΔBGLs) at different time intervals of 0, 5, 15, 30, 60, 90 and 120 min. The areas under glucose curve (ΔAUCs) were calculated at 120 min of OGTT by trapezoid method. Total phenolic content (TPC) and anti-oxidant activity (AOA) of fruits and vegetables were assayed in vitro by Folin Ciocalteu and DPPH (2, 2-diphenyl-1- picrylhydrazyl) methods, respectively. At the end of the experiment the correlations among the parameters TPC, AOA and ΔAUC was estimated by Pearson’s correlations. Among fruit crops, tangerine, plum, grape and pear and among vegetables, blue leaf mustard, cabbage, chicory, broccoli and others exhibited significant hypoglycemic effects by reducing ΔBGLs with significant ΔAUC. The effective ΔAUC ranged from 5548.2
± 462.1 to 3823.3 ± 282.0 mg-min・dL
-1. The TPC and AOA ranged from 0.063 ± 0.00 to 0.913 ± 0.14 mg・g
-1GAE and 01.05 ± 0.08 to 75.46 ± 0.06%, respectively. Overall, six fruits and fifteen vegetables exhibited higher TPC and one fruit and four vegetables exhibited higher AOA. There was a better correlation among TPC, AOA and ΔAUC of fruits and TPC & AOA of vegetables. We report that hypoglycemically significant fruits and vegetables investigated in this study have pharmacological importance which reduced ΔBGLs through insulin like activity and AOA in prevention of type-2 diabetes.
Additional key words: anti-oxidant activity, fruits/vegetables, hypoglycemic activity, insulin agents, type-2
diabetes
*Corresponding author: [email protected]
†These authors contributed equally to this work.
※ Received 15 March 2010; Accepted 10 June 2010. This study was supported by the project (PJ006520) entitled “Development of new products for expanding new market in horticultural crop’s exportation” by Specific Joint Agricultural Research-promoting Projects, RDA, Republic of Korea.
Introduction
Diabetes mellitus or type-2 diabetes is a group of meta- bolic disorders characterized by hyperglycemia (Prince and Kamlakkannan, 2006). The metabolic disorders include altera- tions in the carbohydrate, fat and protein metabolism asso- ciated with absolute or relative deficiencies in insulin secretion and/or insulin action (Kuroe et al., 2003). Diabetes can be associated with serious complications and remains one of the most significant causes of morbidity and mortality in the world and its global impact is likely to accelerate over the coming decades (Pfeiffer, 2003). However, during the last two decades diet therapy has become an important aspect
of controlling type-2 diabetes (Marles and Farnsworth, 1994).
Diabetes and associated complications result in disability,
reduced life expectancy; genetic susceptibility to type-2 diabetes
coupled with lifestyle changes is considered as a major factor
for the growing incidence of diabetes in Asian countries
(King et al., 1998). Many in vivo and in vitro properties
such as blood glucose tolerance (Chaturvedi et al., 2004)
insulin tolerance, and anti-oxidant activities (Espin et al.,
2000) of the dietary materials were studied. These studies
demonstrated that dietary herbal extracts might have some
direct effects on increased tissue utilization of glucose by
inhibiting hepatic gluconeogenesis or by the absorption of
glucose into the muscles and adipose tissues (Hartman,
Table 1. The glucose area under curve, total phenolic contents and anti-oxidant activities of fruit crops.
Fruit crop
(Scientific name) Common name ΔAUCz
(mg-min・dL-1)
TPCy (GAE, mg・g-1)
AOAx (%)
Control 7405.5 ± 355.4
Citrus reticulate Tangerine 4242.5 ± 568.4** 0.123 ± 0.00** 05.33 ± 0.05***
Prunus Americana Plum 4611.5 ± 897.7** 0.221 ± 0.01** 06.45 ± 0.05***
Vitis vinifera Grape 4961.7 ± 383.4* 0.072 ± 0.00** 01.05 ± 0.08***
Pyrus communis Pear 5080.0 ± 367.8* 0.131 ± 0.01** 09.20 ± 0.03***
Diospyros kaki Sweet persimmon 5625.0 ± 183.5NS 0.091 ± 0.00** 09.15 ± 0.13***
Malus domestica Apple 5649.4 ± 124.8NS 0.169 ± 0.01** 12.66 ± 0.04***
Rubus thyrsoideus European blackberry 6340.0 ± 1302.7NS 0.702 ± 0.05** 75.46 ± 0.06***
Ananas comosus Pineapple 6367.5 ± 980.5NS 0.321 ± 0.01** 27.65 ± 0.27***
Prunus armeniaca L. Apricot 7164.2 ± 800.8NS 0.603 ± 0.03** 17.04 ± 0.01***
Prunus persica L. Peach 7684.2 ± 173.0NS 0.171 ± 0.00** 13.02 ± 0.06***
zΔAUC (area under curve) of blood glucose levels at 120 min of OGTT in 12-h fasted rats treated with different fruit samples (g・kg-1 body weight). AUC is calculated by trapezoid method. Values are means ± S.E.M, (n = 21 for control; n = 9 for treated samples).
yTPC (Total phenolic content) of the fruit samples estimated by Folin-Ciocalteu method. Values are means ± SE (n = 3).
xAOA% (anti-oxidant activity) of the fruit samples determined by DPPH free radical scavenging method. Values are means ± S.E.M (n=3).
NS, *, **, *** Non significant or significant at P ≤ 0.05 or 0.01 or 0.001, respectively.
2008). Few intervention studies have similarly shown that dietary supplements of fruit and vegetable origins significantly reduced blood glucose levels, especially in human subjects (Liu et al., 2004).
Consumption of fruits and vegetables decreases the incidence of type-2 diabetes by providing health benefits besides fulfilling physiological needs. Hence, fruits and vegetables have been referred as functional foods. The protective action of these food crops has been attributed to the presence of anti-oxidants such as polyphenols (Anderson et al., 2004). The anti-oxidant activities of these bioactive compounds are attributed to the flavonoid ring which plays a principal role in terms of their pharmacological effects and are also considered as the most important aspects for treatment of type 2-diabetes (Lu et al., 2007). In addition, two classic large-scale clinical studies, the Diabetes Placebo and Complications Trial (DCCT) and the UK Prospective Diabetes Study (UKPDS) have demonstrated that intensive blood-glucose placebo policies can decrease the frequency of complications associated with type-2 diabetes (King et al., 1998).
In spite of published reports on fruits, vegetables and their effect on glucose metabolism (Chaturvedi et al., 2004; Valiathan, 1998) only some of the crops have attained medicinal sig- nificance. However, most of these hypoglycemic studies relied on the effect of solitary botanical extracts. According to our knowledge there are only a few reports on the effect of phenolic compounds present in edible fruit and vegetable crops on blood glucose tolerance in maintaining type-2 diabetes.
To address the above issues we investigated the possible effect of fruits and vegetables on blood glucose levels and glucose area under curve in hyperglycemic rats (in vivo) and the total phenolic content and anti-oxidant activities in vitro.
Materials and Methods
Animals and diets
The present study was performed in accordance with the approved animal protocols and guidelines established by the Ethics Review Committee for Animal Experiments, School of Medicine, Ajou University, Suwon, South Korea. More than 120 male Sprague-Dawley (SD) rats of 5-7 week old and body weight (b. wt.) of 250-280 g were selected for all the experiments. Animals were purchased from Samtako, Osan, Korea. For this study rats were divided into three different groups based on the type of dietary extract administered i.e.
a group for fruits and vegetables, including 21 rats for control group. For acclimatization, the rats were housed three per cage and maintained at temperature of 25 ± 2℃, under a 12/12-h alternate light and dark cycles with 60% relative humidity. Animals were fed pellet diet (standard rat chow) and water ad libitum.
Preparation of fruit and vegetable extracts
Selected fruits (ten) and vegetables (twenty) were purchased
fresh from two different local markets, E-mart and Hanaro
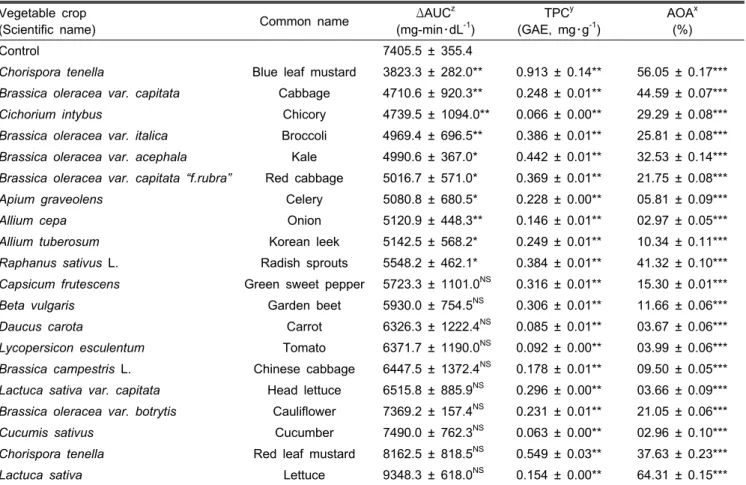
Table 2. The glucose area under curve, total phenolic contents and anti-oxidant activities and vegetable crops.
Vegetable crop
(Scientific name) Common name ΔAUCz
(mg-min・dL-1)
TPCy (GAE, mg・g-1)
AOAx (%)
Control 7405.5 ± 355.4
Chorispora tenella Blue leaf mustard 3823.3 ± 282.0** 0.913 ± 0.14** 56.05 ± 0.17***
Brassica oleracea var. capitata Cabbage 4710.6 ± 920.3** 0.248 ± 0.01** 44.59 ± 0.07***
Cichorium intybus Chicory 4739.5 ± 1094.0** 0.066 ± 0.00** 29.29 ± 0.08***
Brassica oleracea var. italica Broccoli 4969.4 ± 696.5** 0.386 ± 0.01** 25.81 ± 0.08***
Brassica oleracea var. acephala Kale 4990.6 ± 367.0* 0.442 ± 0.01** 32.53 ± 0.14***
Brassica oleracea var. capitata “f.rubra” Red cabbage 5016.7 ± 571.0* 0.369 ± 0.01** 21.75 ± 0.08***
Apium graveolens Celery 5080.8 ± 680.5* 0.228 ± 0.00** 05.81 ± 0.09***
Allium cepa Onion 5120.9 ± 448.3** 0.146 ± 0.01** 02.97 ± 0.05***
Allium tuberosum Korean leek 5142.5 ± 568.2* 0.249 ± 0.01** 10.34 ± 0.11***
Raphanus sativus L. Radish sprouts 5548.2 ± 462.1* 0.384 ± 0.01** 41.32 ± 0.10***
Capsicum frutescens Green sweet pepper 5723.3 ± 1101.0NS 0.316 ± 0.01** 15.30 ± 0.01***
Beta vulgaris Garden beet 5930.0 ± 754.5NS 0.306 ± 0.01** 11.66 ± 0.06***
Daucus carota Carrot 6326.3 ± 1222.4NS 0.085 ± 0.01** 03.67 ± 0.06***
Lycopersicon esculentum Tomato 6371.7 ± 1190.0NS 0.092 ± 0.00** 03.99 ± 0.06***
Brassica campestris L. Chinese cabbage 6447.5 ± 1372.4NS 0.178 ± 0.01** 09.50 ± 0.05***
Lactuca sativa var. capitata Head lettuce 6515.8 ± 885.9NS 0.296 ± 0.00** 03.66 ± 0.09***
Brassica oleracea var. botrytis Cauliflower 7369.2 ± 157.4NS 0.231 ± 0.01** 21.05 ± 0.06***
Cucumis sativus Cucumber 7490.0 ± 762.3NS 0.063 ± 0.00** 02.96 ± 0.10***
Chorispora tenella Red leaf mustard 8162.5 ± 818.5NS 0.549 ± 0.03** 37.63 ± 0.23***
Lactuca sativa Lettuce 9348.3 ± 618.0NS 0.154 ± 0.00** 64.31 ± 0.15***
zΔAUC (area under curve) of blood glucose levels at 120 min of OGTT in 12-h fasted rats treated with different vegetable samples (g・kg-1 body weight). AUC is calculated by trapezoid method. Values are means ± S.E.M, (n = 21 for control; n = 9 for treated samples).
yTPC (total phenolic content) of the vegetable samples estimated by Folin-Ciocalteu method. Values are means ± S.E.M (n = 3).
xAOA% (anti-oxidant activity) of the vegetable samples determined by DPPH free radical scavenging method. Values are means
± S.E.M (n = 3).
NS, *, **, *** Non significant or significant at P ≤ 0.05 or 0.01 or 0.001, respectively.
Club Market (Seoul, Korea). The list of the crops is as mentioned in Tables 1 and 2 with their scientific names along with their corresponding common names. The edible portions of each crop were extracted following a published protocol with little modifications (Lee et al., 2003). Briefly, 100 g of each fresh sample was homogenized by using a food processor and extracted with HPLC grade methanol by stirring for 2-h on a magnetic stirrer. After incubation for 22-h the homogenates were filtered and the filtrates were concentrated to 100 mL by using a vacuum rotary evaporator (Eyela, Tokyo, Japan). This concentrate was further vacuum dried in a speed vacuum (Biotron Inc., Seoul, Korea), and then weighed.
Analysis of blood glucose levels and area under glucose curve
An in vivo oral glucose tolerance test (OGTT) was per- formed after the rats were fasted for 12-h in order to deter- mine the hypoglycemic activities of fruit and vegetable extracts.
At the beginning of the experiment, the glucose tolerance (GT) of rats was evaluated by oral administration (p.o.) of 50% dextrose 30 min prior to OGTT. Only saline solution was administered p.o to the control group of rats. The other two groups of rats were administered with individual extracts of fruits and vegetables dissolved in saline solution. The blood glucose levels (ΔBGLs, mg/dL) were determined at different time intervals of 0, 5, 15, 30, 60, 90 and 120 min after administration of extracts using an Accu-check sensor glucometer, Roche Diagnostics Corporation, USA. The areas under glucose curve, ΔAUC (mg-min・dL
-1) was calculated subsequently for all the treatment samples at 120 min of OGTT experiment.
Estimation of total phenolic content
To estimate the total phenolic content (TPC) of fruits and
vegetables (dried extracts dissolved in 1 mL of 80% v/v
methanol) a Folin Ciocalteu (FC) reagent method (Sadasivam
Fig. 1. Effect of the dietary fruits on delta blood glucose levels (ΔBGL) in hyperglycemic rats during OGTT. Data are means
± S.E.M, (n=21 for placebo; n=9 for treated samples). The anti-hyperglycemic activities during OGTT are significantly higher with fruit crops as compared to the placebo. *, **, ***
significant at P ≤ 0.05 or 0.01 or 0.001, respectively.
and Manikan, 1992) was followed with little modifications.
FC reagent, Na
2CO
3and gallic acid were purchased from Sigma (Seoul, Korea). To 0.4 mL of each of methanolic infusions of fruit and vegetable extracts and/or solvent blank an equal ratio of water and FC reagent (1:1 v/v) was added and kept for incubation at 27℃ for 5 min. To the above reaction mixture, 0.4 mL of 10% aqueous Na
2CO
3solution was added and incubated for 1-h at room temperature. The absorbance of the reaction mixture was measured at 640 nm in a UV-spectrophotometer (Shimadzu-1201, Shimadzu Corp., Tokyo, Japan). Standard curve was obtained by using gallic acid at a concentration range of 1 to 10 mg/mL. Using this linear curve, TPC was calculated and expressed as gallic acid equivalents (GAE, mg・g
-1).
Determination of anti-oxidant activities
In order to determine the anti-oxidant activity (AOA) of fruit and vegetable extracts, a well known DPPH (2, 2-diphenyl- 1-picrylhydrazyl) free radical scavenging method (Blois, 1958) was followed by calibrating the standard solution to linearize the reaction. The working DPPH stock solution of 0.1 mM was prepared in 80% methanol. The extracts were dissolved in 80% methanol (v/v) and to 0.4 mL of this methanolic infusion, 3 mL of DPPH solution was added and incubated in dark for 10 min at room temperature. After the reaction reaches a plateau the absorbance (A) was measured at wave length 517 nm and the AOA was calculated by using the following formula:
Anti-oxidant activity, AOA (%) = [Aplacebo – Asample]/[Aplacebo] × 100
Statistical analysis
The results were presented as means ± SE. Statistical method used to analyze the data was unpaired Student’s t-test (two-tailed) by using MS-Excel Software program. Probability
P values ≤ 0.05 or 0.01 or 0.001 were considered to besignificant. The ΔAUCs were calculated using trapezoid method (Allison et al., 1995) which has been identified as a more reliable and sensitive measure of glucose tolerance.
The correlations of TPC, AOA and ΔAUC parameters were estimated by Pearson’s correlation method (Lu et al., 2007).
Results
Hypoglycemic effects of fruit and vegetable extracts among hyperglycemic rats
The ΔBGLs of the hyperglycemic male SD rats treated with fruit extracts during 0 to 120 min of OGTT are as shown in Fig. 1. Among ten fruit extracts tested, the highly hypoglycemic tangerine significantly reduced ΔBGL upto
14.01% (P ≤ 0.01) at 0 min, followed by plum 28.56%
(P ≤ 0.001) at 30 min, grape 32.8% (P ≤ 0.05) at 5 min and pear upto 28.11% (P ≤ 0.01) at 30 min of OGTT, compared to control at that corresponding time. Overall, the glucose level at 120 min of OGTT remained stable when compared to the initial baseline in the hyperglycemic rats treated with the above fruit extracts. The ΔAUC among rats treated with these fruit crops were as summarized in Table 1. The ΔAUCs were arranged in decreasing order along the tabular column and it ranged from 5080.0 ± 367.8 to 4242.5
± 568.4 mg-min・dL
-1. Tangerine, plum, grape and pear exhi- bited significantly higher ΔAUC compared to control (7405.5
± 355.4 mg-min・dL
-1). The other fruit extracts could not exhibit significant hypoglycemic activities.
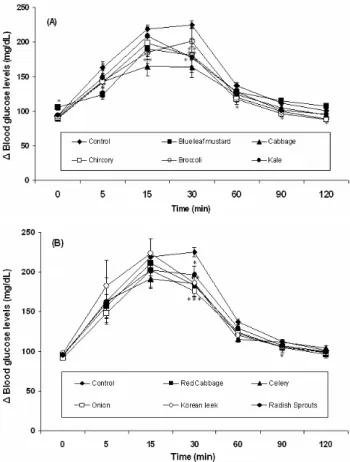
The ΔBGLs of vegetable extracts during 0 to 120 min of OGTT were as shown in Fig. 2 (A) and (B). Among all the vegetable extracts tested the highly hypoglycemic blue leaf mustard significantly reduced ΔBGLs upto 14.70 (P ≤ 0.05) at 30 min, followed by cabbage upto 27.1% (P ≤ 0.001), chicory 20.0% (P ≤ 0.01), broccoli at 15 min (15.51%, P ≤ 0.05), kale 26.6% (P ≤ 0.01), red cabbage 23.0%, (P ≤ 0.05), celery 17.8% (P ≤ 0.05), onion 21.8%
(P ≤ 0.001), Korean leek (17.4%, P ≤ 0.05) and radish
sprouts upto 12.5% (P ≤ 0.01) at 30 min of OGTT, com-
pared to control at that corresponding time. Overall, the
glucose level at 120 min of OGTT remained stable when
compared to the initial baseline in the hyperglycemic rats
treated with the above vegetable extracts. The ΔAUC of
vegetables tested were as summarized in Table 2 and it
ranged from 5548.2 ± 462.1 to 3823.3 ± 282.0 mg-min・dL
-1.
Among twenty vegetable crops tested, blue leaf mustard,
cabbage, chicory, broccoli, kale and some of the crops
Fig. 2. (A) and (B) Effect of the dietary vegetables on delta blood glucose levels (ΔBGL) in hyperglycemic rats during OGTT. Data are means ± S.E.M, (n=21 for placebo; n=9 for treated samples). The hypoglycemic activities during OGTT are significantly higher with vegetable crops as compared to the placebo. *, **, *** significant at P ≤ 0.05 or 0.01 or 0.001, respectively.
exhibited significantly higher ΔAUC compared to control (7405.5 ± 355.4 mg-min・dL
-1). The other vegetable extracts could not exhibit significant hypoglycemic activities. Further, no significant change in the body weight was observed among hyperglycemic rats before and after treatment with crop extracts (data not shown).
Total phenolic content of fruits and vegetables The TPC of fruits and vegetables are summarized in Table 1 and 2. The TPC values ranged from 0.072 ± 0.00 to 0.702
± 0.05 and 0.063 ± 0.00 to 0.913 ± 0.14 mg・g
-1GAE among fruits and vegetables, respectively. Among the fruit crops, the highest TPC was found in European blackberry, apricot, pineapple, plum, peach, and apple (Table 1). Among vege- tables the highest TPC was found in blue leaf mustard, red leaf mustard, kale, broccoli, radish sprouts and others (Table 2). Overall, six fruits and fifteen vegetables exhibited higher TPC (> 0.15 mg・g
-1GAE) in this study.
Anti-oxidant activities of fruits and vegetables The anti-oxidant activities (AOA) of fruits and vegetables are summarized in Table 1 and 2. The AOA fruits ranged between 01.05 ± 0.08 to 75.46 ± 0.06 and among vegetables the AOA ranged from 2.97 ± 0.05 to 64.31 ± 0.15%. Among fruit crops, the highest AOA was found in European black- berry (Table 1), whereas, among vegetables, the highest AOA was found in blue leaf mustard, lettuce, cabbage, and radish sprouts (Table 2). Overall, one fruit and four vegetables investigated in the present study exhibited higher AOA (>
40%).
Correlations
Among the Pearson correlations between TPC & AOA, AOA & ΔAUC and TPC & ΔAUC of fruits and vegetables, a strong and profound correlation was found between TPC
& AOA. The effective correlation of these parameters among fruits was in the order TPC & AOA (R
2= 0.8118) > TPC
& ΔAUC (R
2= 0.5129) > AOA & ΔAUC (R
2= 0.3803).
The AOA & ΔAUC and TPC & ΔAUC exhibited negative correlation among vegetable crops.
Discussion
From our results it was evident that fruits and vegetables showed improvement in the glucose curve among rats by significantly reducing ΔBGLs with significant glucose ΔAUC compared with that without the extracts (Chaturvedi et al., 2004). This work exploits the findings of previous reports which utilizes the information contained in a 2-h OGTT to estimate insulin sensitivity (Mari et al., 2001; Stumvoll et al., 2000) and β-cell function (Jayaprakasam et al., 2005).
Hence these findings suggest that hypoglycemic effects of significant fruit and vegetable extracts may be due to their inducing nature on pancreatic β-cells for insulin secretion, or the phenolic compounds such as flavanols, flavones and anthocyanins present in these crops may themselves be acting as insulin like molecules or insulin secretagogues (Jayaprakasam et al., 2005). This concept indicates the structure activity relationship of the plant bioactives in maintaining glucose levels normal. During our study most of the extracts efficiently reduced ΔBGLs at 30 to 60 min of OGTT, and it was well known that the insulin molecules have major activity during 30 to 60 min after its secretion from β-cells of islets of langerhans (Yamazaki et al., 2007). The function of insulin is being clear i. e. to maintain blood glucose levels either by suppression of glucose output from liver or by the stimulation of glucose uptake and its metabolism (Ross et al., 2004).
Thus the enhanced transportation of glucose due to potentiation
by insulin brings the elevated glucose level back to normal.
In addition to insulin like activity, the phenolic compounds of these fruits and vegetables were also found to protect from type-2 diabetes induced oxidative damage. These protective actions of fruits and vegetables have been attributed to their anti-oxidant activity after their consumption through diet (Rizvi et al., 2005) even if their bioavailability is at micromolar range. This can lead to a concept of potential anti-oxidant activity through exogenous supplementation of natural anti-oxidants or phytoceuticals. Thus our study suggested AOA of polyphenols as also a possible mechanism of action in managing type-2 diabetes (Jayaprakasam et al., 2005).
The present study is the first comprehensive report on correlations of TPC, AOA with ΔAUC. There was a strong and positive correlation between the parameters supporting their mechanism of action.
Our findings are futher supported by previous reports which states that many new bioactive compounds, especially polyphenols isolated from plants found to exhibit hypogly- cemic effects against type-2 diabetes equal to or better than known oral hypoglycemic agents such as daonil, tolbutamide and chlorpropamide (Allison et al., 1995). These anti-diabetic drugs adversely affect the ability of β-cells to secrete insulin and cause weight gain (Pfeiffer, 2003). Hence, there is a role for dietary constituents that can regulate blood glucose levels or induce insulin production by pancreatic β-cells.
The polyphenolics are also well known as potential free radical scavengers as reported in previous findings and states that the serum antioxidant capacity was increased by the consumption of strawberries, cherries, and red wine (Tsuda et al., 2003). Our study did not focus on the triglycerides and cholesterol levels as there was no significant change in the body weight of rats. From our findings we report that consumption of fruits and vegetables high in phenolic content decreases blood glucose levels through insulin like activity and oxidize free radicals rise during type-2 diabetes.
Since mammals lack the ability to generate phenolic compounds (except oestrogens), this deficiency may be substituted for, in part, by the consumption of fruits and vegetables (Spitller, 2000). Further the present study provides additional motivation among population for the proper consumption of fruits and vegetables in minimizing the incidence of type-2 diabetes.
As this study did not include the effect of plasma anti- oxidants levels, further investigations can be done to elucidate their function in augmentation of endogenous anti-oxidants levels in maintaining type-2 diabetes.
In conclusion during this study, fruits such as tangerine, plum, grape, pear and vegetables such as blue leaf mustard, cabbage, chicory, broccoli, kale, red cabbage, celery, onion, Korean leek and radish sprouts effectively reduced ΔBGL with significant ΔAUC in hyperglycemic rats. Some of these
hypoglycemic crops showed higher TPC and efficient AOA, thus acting as anti-oxidants through structure-activity relation- ship. There was a better correlation among TPC, AOA and Δ AUC of fruits and TPC & AOA of vegetables. Thus, it was proposed that the phenolics decreased the ΔBGL with significant ΔAUC. In addition, the ΔBGL of the rats were lower than that of the rats in control group, exhibiting insulin like activity. Therefore, exogenous supplementation of anti- oxidants induces the improvement of blood glucose curve bringing hyperglycemia in rats to normal and preventing type-2 diabetes.
Literature Cited
Allison, D.B., F. Paultre, C. Maggio, N. Mezzitis, and F.X.
Pi-Sunyer. 1995. The use of areas under curves in diabetes research. Diabetes Care 18:245-50.
Anderson, R.A., C.L. Broadhurst, M.M. Polansky, W.F. Schmidt, A. Khan, V.P. Flanagan, N.W. Schoene, and D.J. Graves.
2004. Isolation and characterization of polyphenol type-A polymers from cinnamon with insulin like biological activity.
J. Agric. Food. Chem. 52:65-70.
Blois, M.S. 1958. Antioxidant determination by the use of a stable free radical. Nature 181:1199-1202.
Chaturvedi, P., S. George, M. Milinganyo, and Y.B. Tripathi.
2004. Effect of Momordica charantia on lipid profile and oral glucose tolerance in diabetic rats. Phytother. Res. 18:
954-956.
Espin, J.C., C. Soler-Rivas, H.J. Wichers, and C. Garcia-Viguera.
2000. Anthocyanin based natural colorants: a new source of antiradical activity for food stuff. J. Agric. Food. Chem.
48:1588-1592.
Hartman, I. 2008. Insulin analogs: impact on treatment success, satisfaction, quality of life, and adherence. Clin. Med. Res.
6:54-67.
Jayaprakasam, B., S.K. Vareed, L.K. Olson, and G. Nair Mura- leedharan. 2005. Insulin secretion by bioactive anthocyanins and anthocyanidins present in fruits. J. Agric. Food. Chem.
53:28-31.
King, H., R.E. Aubert, and W.H. Herman. 1998. Global burden of diabetes, 1995-2025. Prevalence, numerical estimates, and protection. Diabetes Care 211:1414-1431.
Kuroe, A., M. Fukushima, M. Usami, M. Ikeda, Y. Nakai, A.
Taniguchi, T. Matsuura, H. Suzuki, T. Kurose, K. Yasuda, Y. Yamada, and Y. Seino. 2003. Impaired β-cell function and insulin sensitivity in Japanese subjects with normal glucose tolerance. Diabetes Res. Clin Pract. 59:71-77.
Lee, S.E., H.J. Hwang, J.-S. Ha, H.-S. Jeong, and J.H. Kim.
2003. Screening of medicinal plant extracts for antioxidant activity. Life. Sci. 73:167-169.
Liu, S., M. Serdula, S.-J. Janket, R.N. Cook, H.W. Sesso, W.C.
Willett, J.E. Manson, and J.E. Buring. 2004. A prospective study of fruit and vegetable intake and the risk of type 2 diabetes in women. Diabetes Care 27:2993-2996.
Lu, J., Y.–K. Chan, G.D. Gamble, S.D. Poppitt, A.A. Othman,
고혈압쥐의 과일과 야채의 섭취에 따른 저혈당 효과
쉐익나즈닌
1†ㆍ고은영
2ㆍ우파드하야
2ㆍ장 미
2†ㆍ박세원
2*ㆍ이동하
3ㆍ정이숙
3ㆍ윤도영
1ㆍ홍세진
41건국대학교 특성화학과, 1건국대학교 분자생명공학과, 2아주대학교 생리학교실, 4강릉대학교 식물생명과학과 (*교신저자)
초 록. 고혈당 쥐에 (Sprague-Dawley rat) 각종 야채와 과일을 섭취(1g/kg body weight) 한 후 oral glucose tolerance test(OGTT)을 실시하였다. 0분, 5분, 15분, 30분, 60분, 90분, 120분 후에 blood glucose levels(ΔBGLs)을 측정하였다. Under glucose curve(ΔAUCs)은 OGGT의 120분 후 계산하였으며 과일과 야채의 Total phenolic content(TPC)과 anti-oxidant activity (AOA)는 Folin Ciocalteu and DPPH(2, 2-diphenyl-1-picrylhydrazyl)을 통하여 특정하였다. 실험의 마지막은 Pearson’s correlations을 사용하여 TPC, AOA and ΔAUC 간의 상관관계를 분석하였으며 모든 통계수치는 unpaired Student’s t-test를 실시하였다. 과일중에서는 탠저린, 자두, 배가 저혈당 효과를 보였으며 야채중에서는 푸른잎 머스타드와 양배투, 치커리, 브로콜리가 감소된 ΔBGLs와 유효한 ΔAUC수치를 보여서 저혈당 효과에 효과적이었다. 효과적인 ΔAUC의 범위는 5548.2
± 462.1에서부터 3823.3 ± 282.0mg・min/dL이며, TPC와 AOA의 범위는 0.063 ± 0.00에서부터 0.913 ± 0.14mg/g GAE, 01.05 ± 0.08에서부터 75.46 ± 0.06%이다. 전체적으로 과일의 50%와 양체의 60-65%가 높은 TPC와 효과적인 AOA의
수치를 나타내었다 . 우리는 이번 연구를 통하여 저혈당 효과가 있어 제2형 당뇨를 예방할 수 있는 과일과 채소류를 선별할
수 있었다.
추가 주요어 : 항산화 활성, 과일/채소, 저혈당활성, 인슐린 효과, 제2형 당뇨
and G.J.S. Cooper. 2007. Triethylenetetramine and metabolites:Levels in relation to copper and zinc excretion in urine of healthy volunteers and type 2 diabetic patients. Drug. Metab.
Dispos. 35:221-227.
Mari, A., G. Pacini, E. Murphy, B. Ludvik, and J.J. Nolan. 2001.
A model-based method for assessing insulin sensitivity from oral glucose tolerance test. Diabetes Care 24:539-548.
Marles, R.J. and N.R. Farnsworth. 1994. Plants as sources of antidiabetic agents. Econ. Med. Plant. Res. 6:149-187.
Pfeiffer, A.F.H. 2003. Oral hypoglycemic agent: Sulfonylureas and meglitinides. In text book of type-2 diabetes. Goldstein B.J. and D. Müller-Wieland (eds.), Martin Dunitz Ltd., London, UK.
Prince, P.S.M. and N. Kamalakkannan. 2006. Rutin improves glucose homeostasis in streptozotocin diabetic tissues by altering glycolytic and glyconeogenic enzymes. J. Biochem.
Mol. Toxicol. 20:96-102.
Rizvi, S.I., M.A. Zaid, R. Anis, and N. Mishra. 2005. Protective role of tea catechins against oxidation-induced damage of type 2 diabetic erythrocytes. Clin. Exp. Pharmacol. Physiol.
32:70-75.
Ross, S.A., E.A. Gulve, and M. Wang. 2004. Chemistry and
biochemistry of diabetes. Chem. Rev. 104:1255-1282.
Sadasivam, S. and A. Manikan. 1992. In: Biochemical methods for Agricultural sciences. p.187, Wiley Eastern, New Delhi, India.
Spitller, G. 2000. Are lipid peroxidation processes induced by chances in the cell wall structure and how are those processes connected with disease. Med. Hypotheses. 60:69-83.
Stumvoll, M., A. Mitrakou, W. Pimenta, T. Jenssen, H. Yki- Järviven, T.W. VanHaeften, W. Renn, and J. Gerich. 2000.
Use of the oral glucose tolerance test to assess insulin release and insulin sensitivity. Diabetes Care 23:295-301.
Tsuda, T., F. Horio, K. Uchida, H. Aoki, and T. Osawa. 2003.
Dietary cyaniding 3-O-β D glucoside-rich purple corn color prevents obesity and ameliorates hyperglycemia in mice. J.
Nutr. 133:2125-2130.
Valiathan, M.S. 1998. Healing plants. Curr. Sci. 75:1122-1126.
Yamazaki, K., N. Yasuda, T. Inoue, E. Yamamoto, Y. Sugaya, T. Nagakur, M. Shinoda, R. Clark, T. Saeki, and I. Tanaka.
2007. Effects of the combination of a Dipeptidyl peptidase IV inhibitor and an insulin secretagogue on glucose and insulin levels in mice and rats. Pharmacol. Exp. Therap.
320:738-746.