421
흉부 CR 영상에서 선량이 화질에 미치는 영향에 대한 평가
강보선 건양대학교 방사선학과
Assessment of dose effects on image quality at chest computed radiography
Bosun Kang
Department of Radiological Science, College of Medical Science, Konyang University, Daejeon, Korea 712‐702
요약
본 연구는 CR영상에서 선량이 화질에 미치는 영향을 평가하기위해 수행되었다. 본 연구의 궁극적인 목적은 임상 흉 부진단에 필요한 영상화질을 얻을 수 있는 최적 선량을 찾는 것이다. 영상화질 평가를 위해서 다양한 선량에서의 MTF, NNPS, 그리고 NEQ를 측정하였으며, MTF 측정과 실험장치 구성은 International Electrotechnical Commission (IEC)에서 제시한 절차에 따라 수행하였다. 실험 결과를 통해 흉부진단의 경우 자동노출조절 (Automatic Exposure Control, AEC) 제어반에서 자동으로 설정해주는 선량의 절반 선량으로도 필요한 영상화질이 얻어짐을 알 수 있었다.
본 연구를 통해 AEC에서 제시하는 선량이 최적 선량이 아니며 화질평가를 통해서 얻어진 최적 선량을 사용하면 환자 의 피폭을 상당량 줄일 수 있음을 보였다.
중심단어 : CR, 흉부영상화질, 선량조절, 최적 선량, MTF, NPS, NEQ
Abstract
This research was accomplished to assess dose effects on image quality at computed radiography (CR). The ultimate target of the research was finding optimized exposure that provides necessary image quality for the clinical chest diagnosis. Modulation transfer function (MTF), normalized noise power spectrum (NNPS), and Noise equivalent quanta (NEQ) corresponding to the different doses were measured for the assessment of image quality. The preparation of “edge test device” used in MTF measurement and experimental geometry setup were followed by the recommendations of International Electrotechnical Commission (IEC). The experimental results show the necessary image quality can be achieved even at a half of the automatic exposure control (AEC) setting dose for chest diagnosis. It means that the patient exposure can be reduced dramatically by using optimized dose.
Key words: computed radiography (CR), chest image quality, dose control, optimized dose, modulation transfer function (MTF), noise power spectrum (NPS), noise equivalent quanta (NEQ)
Corresponding Author: 강보선
I. Introduction
Recently computed tomography (CT) is used in various radiological diagnoses especially for cancer of chest, abdomen, and head & neck. CT provides sectional sliced tomographic image and 3‐dimensional volumetric anatomy with high resolution, and it makes easy for radiologists to define a lesion. Nevertheless of the advantages of the CT, many of the chest diagnoses such as basic preoperative diagnostic procedures for tubercle diagnosis are still in reliance upon general radiography (GR). Film‐screen has been used rather than CR as an image receptor in GR for the past years, but computed radiography (CR) is substituting for film imaging system in recent years. The substitution was promoted by the improvement of CR resolution. The spatial resolution of CR image is primarily depends on the pixel size of the imaging plate and exposure condition, i.e. exposure energy and dose. The pixel size of the image plate (IP) for clinical CR system has been down to 0.1mm, and the necessary resolution for clinical chest diagnosis of pulmonary interlobular septal line, pneumothorax, and solitary pulmonary nodule is 0.2 mm. Hence it is regarded that the recent CR system is providing enough resolution for chest diagnosis though it resolves patient image less than film‐screen system does. Most of the film‐screen systems provide 8 lp/mm of spatial resolution which corresponds to 0.0625 mm. With the comparable image resolution, CR has additional advantages such as the large dynamic range, reduced repeat rates, low cost in long term carrying charge, a small data storage device instead of large film storage room, and compatibility to picture archiving and communication system (PACS).
When CR was introduced to the clinic it was announced that CR could reduce the patient dose with many other benefits mentioned above, but recent studies show that CR causes more exposure than traditional film
‐screen system.[1] Because of the large dynamic range of CR, overexposure increases signal to noise ratio (SNR)
which could result in the better image quality. Hence the radiological technician (RT) may tend to overexposure by increasing beam current during the clinical radiology for the better image. There is another cause for more patient dose in CR. It is the usage of the “automatic exposure controller (AEC)”. AEC automatically recommends programmed exposure conditions for a diagnosis, and sets beam current and tube voltage when a RT selects patient type and a diagnosis to be done. However if the tube system is not calibrated to the imaging receptor system, AEC cannot provide proper exposure (underexposure or overexposure).
Whatever the factor is, image quality for the using system need to be evaluated at various dose to determine optimum dose for a diagnosis and to reduce patient dose.
II. Matreials and Methods
1. Description of CR imaging system
CR imaging system is a type of digital imaging system which is mostly used in clinical diagnosis, and it has been evolve with integrated instant readout digital radiography system so called digital radiography (DR). CR is based on the use of photosensitive phosphors.[2] The barium fluorohalide family in powder form is deposited onto a substrate, and the substrate is fixed into the light‐tight enclosing called as imaging plate cassette or simply IP.
When the IP is exposed to X‐ray, the electrons of photosensitive phosphor are excited and eventually are trapped in the exciton energy levels (metastable traps) of activators to form a latent image on IP. These trapped electrons are optically stimulated and released from exciton levels. The optical stimulation triggered by the laser light, and the fluorescence light in an amount proportional to the original X‐ray irradiation is detected by the photomultiplier tube in the CR reading system. This triggering and emission process is called ‘photostimulated luminescence (PSL)’. The major CR system suppliers are Fuji, and Agfa. Agfa CR system was used in the
experiment.
2. Evaluation of imaging system
Quality evaluation in digital image means that the evaluation of the whole process including the quanta emission from source, the interaction between quanta and materials through the object, conversion from quanta to electrical signal at the sensor, and finally display on the monitor screen. The evaluation results are influenced by the system, mostly source quality and detector performance, and the human factors including physical experience and psychological and physiological conditions.
Contrast, resolving power, and noise are the major parameters which define the image quality, and SNR, NPS, and MTF are the measures in systemic evaluation concerning the relationships between the parameters. NEQ is the absolute measure of an image quality to the radiologist. MatLabTM was used to read CR image raw data, and calculate quality parameters.
3. Resolving power and modulation transfer function
Resolving power in digital image means that the minimum distance to be resolved in the image, or the special resolution in the unit of line pairs per millimeter (lp/mm). Bar phantom, slit, pinhole, and edge phantom are widely used to measure contrast modulation, line spread function (LSF), point spread function (PSF), and edge spread function (ESF) respectively. Since every methods uses square functions as input, and sinusoidal contrast spreading as outputs, the quantitative resolving power means that how exactly the system transfers the square input to an image. The MTF is a well proven measure of signal transfer over a range of spatial frequencies and quantifies image resolving power. It is defined as the modulus of the Fourier Transform (FT) of the LSF, which is the system response to signal in the shape of delta function. It is always scaled to unity at a zero frequency [4]:
{
( )}
)
(f FT LSF x
MTF = ··· (1)
The edge test phantom recommended by the International Electrotechnical Commission (IEC) was used for the MTF measurements.[3]
4. Noise Power Spectrum
The NPS, also called Wiener spectrum, is defined mathematically in terms of Fourier transform of noise images. It is the spectral decomposition of the noise variance in the image and is defined as equation (2) [5]:
. )
, ( 1
) , (
2
2 ) ( 2
lim
,mean XY
vy ux i
Y X
normalized
S
dxdy e
y x s XY
v u NPS
∫∫
− +∞
→
=
π
··· (2)
X and Y in the equation are the distances in x and y direction, s(x,y) is the difference between the average image signal and the signal at point (x,y), Smean represents the mean signal over the region of interest (ROI), and the symbol < > stands for the ensemble average. The normalized NPS was calculated following the IEC recommendation.
5. Detective quantum efficiency (DQE) and noise equivalent quanta (NEQ)
The DQE is defined as the fraction of the number of quanta entering the imaging system effectively used by the system to produce an image. The DQE is generally regarded as the most useful measure of sensitivity and noise performance of an imaging system. The MTF is a measure of resolution, and DQE is the measure of detector performance. However they do not reflect the overall image quality affected by noise, resolution, and contrast in the image. To evaluate image quality by the overall role of noise, resolution, and contrast, the NEQ
Figure 1.Measured exposed dose at various beam current deviated from the beam current set by automatic exposure control (AEC) system for a chest diagnosis.
have to be calculated. The NEQ is the number of quanta that an ideal detector would have needed to yield the same signal to noise ratio, which is the effective number of photons per cm of detector. It is the absolute measure of image quality ranges from zero to infinity. It is defined as in equation (3) and can be deduced from the measured DQE, and the photon fluence Ninc since SNR2in = Ninc
for the noise limited system:[6]
) ( ) (
) (
) (
2 2
f NPS
f MTF
f DQE N
SNR f NEQ
normalized inc
ideal non
=
⋅
=
= −
··· (3)
The SNR2in and SNR2non-deal are the signal‐to‐noise ratios of the quantum field at the sensor input and of the image at the sensor output, respectively.
6. Experimental setup
Experiments were accomplished with fixed tube voltage and exposure time (55 kVp , 25msec), and various beam currents. The analysis of NPS, MTF, and the preparation of “edge test device” were followed by the recommendations of IEC. REX-525R automatic exposure control system and Toshiba LTN-25 embedded BLD-150RK X-ray exposure system was used.[7] Agfa CR30-X digitizer CR system and 24 x 30 cm (9.5 x 12”) imaging plate was used for digital imaging.[8] Exposed dose with different beam current were measured using VictoreenTM 06-524-3000 ion chamber and RAD-CHECKTM Micro X-ray exposure meter.[9] The measured dose corresponding to the beam currents are shown in figure 1.
Tube voltage was fixed at 55 kVp because it was manufacturer‐providing AEC setting value for “Chest AP (Anterior to Posterior)” projection imaging. The exposed dose was controlled by the manual beam current control as it is executed in clinics to increase exposed dose.
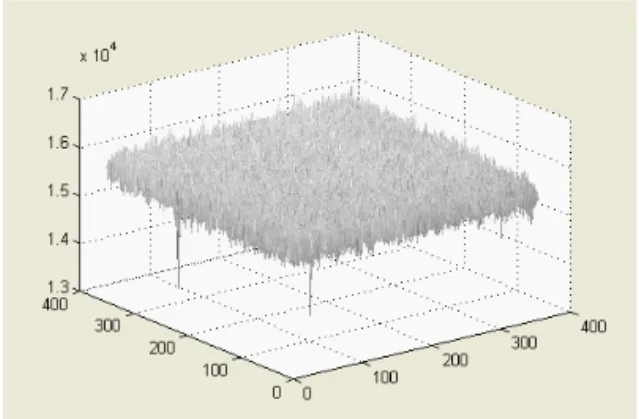
Figure 2.An example of crop image for calculated NPS of sampled image from a white image at exposure condition of
55 kVp, 100 mA and 25 msec.
III. Result
Figure 2 shows the example of the crop image for NPS calculation sampled from white image at exposure condition of 55 kVp, 100 mA and 25 msec. Calculated normalized NPS curves for the various exposed dose are shown in figure 3. It was found that the normalized NPS was improved when the exposed dose was increased as it was expected. The system noise variance is small even when the exposure condition is changed, but the output signal is increased when the input signal is changed. Thus it appears that the variations of signal between pixels are reduced and increased mean pixels values, then improve
the normalized NPS in result. The normalized NPS gradually decreased with the increased spatial frequency.
Calculated NPS at zero spatial frequency were about 2.0x10⁻⁵ mm2 and 4.5x10⁻⁶ mm2 at exposed dose of 0.75 mR and 18.57 mR, respectively.
Figure 3.Calculated NPS of CR images exposed at the various conditions from a half to twice of AEC setting dose.
Figure 4. Measured MTF of CR images exposed at the various conditions from a half to twice of AEC setting dose.
Measured MTF is shown in figure 4, and it shows about 4 lp/mm (0.125 lp/mm) at 10 % MTF within the controlled exposure dose range. Since the resolution requirement for the clinical chest diagnosis is 2.5 lp/mm (0.2 mm resolution), the used CR system is regarded as providing enough resolution within the exposure dose range between 18.57 mR and 0.75 mR. Small variances
between MTFs at different dose conditions are regarded an experimental error mostly comes from the instability of X‐ray energy. According to the experimental results the dose control by exposure current change does not affect the system resolution, which is accords with the ‘Lubbert’s effect’.[10]
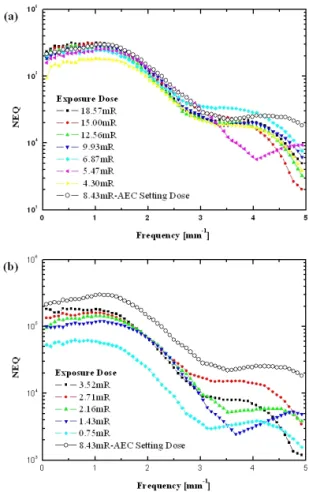
Figure 5. Measured NEQ of CR images exposed at the various conditions from a half to twice of AEC setting dose.
Notable variations were found at the measured NEQ.
The NEQ at zero frequency varied from about 5x10⁴ to 2x10⁵ when the exposure dose controlled from 0.75 mR to 18.57 mR. The NEQ plots at the dose range from 4.30mR to 18.57 mR are shown in figure 5 (a), and the NEQ plots at the range from 0.72 mR to 3.52 mR are shown in figure 5 (b).
Figure 5(a) shows that overexposure improves NEQ at low frequency up to 1 lp/mm, but it is degraded at the higher frequency up to the CR resolution limit. The
variance between NEQs are negligible up to CR resolution limit. Figure 5 (b) shows that the image quality is aggravated by the lower exposure than the half of the AEC setting dose. The variances between NEQs were still negligible up the CR resolution limit. It shows that the image quality was aggravated by the lower exposure than a half of the AEC setting dose.
IV. Conclusion
The experimental results show that overexposure by increasing exposure beam current does not improve CR image quality and the resolution either even with about factor of two higher exposure than AEC setting dose.
More over, the similar image quality could be achieved at about a half of the AEC setting dose with the clinical requirement resolution. In the view of radiation protection, overexposure by increasing beam current potentially imperils patients’ health without any advantages in CR radiological diagnosis. The experimental results revealed that the optimal exposure dose could be decided by the image quality assessments using NPS, MTF, and NEQ, which can be used for setting up new exposure protocol to reduce patient dose.
Acknowledgement
Author is grateful to Dr. Ho‐Sang Jeon for providing advices on MatLabTM programming, and Professor Kyoung‐Jae Jung for the information on the anatomical pathologies and providing examples of clinical cases.
References
[1] John E. Aldrich, Emerenciana Duran, Pat Dunlop, and John R.Mayo, Optimization of Dose and Image Quality for Computed Radiography and Digital Radiography, J. of Digital Imaging, 19, pp.126‐131, (2006).
[2] J. A. Rowlands, The physics of computed radiography, Phys.
Med. Biol. 47, R123‐R166, (2002).
[3] International Electrotechnical Commission, Diagnostic Imaging Equipment, IEC 62220‐1, (2002).
[4] J. T. Dobbins, D. L. Ergun, L. Rutz, D. A. Hinshaw, H.
Blume, and D.C. Clark, Med. Phys. 22, 1581 (1995).
[5] E. Samei, M. J. Flynn and H. G. Chotas, Proc. SPIE 4320, 189 (2001).
[6] J. T. Dobbins III, “Image Quality Metrics for Digital Systemss”, in Handbook of Medical Imaging, Physics and Psychophysics, J. Beutel, H. L. Kundel, R. Van Metter, Eds. Bellingham, WA:
SPIE, Vol. 1, pp. 121-126, (2000).
[7] www.listem.co.kr [8] http://www.agfa.com
[9] http://www.elimpex.com/products/diagnostic‐radiology/measuring‐x‐r ay/victoreenrad.pdf
[10] A. Badano, R. M. Gagne, B. D. Gallas et. al., Lubberts effect in columnar phosphors, Med. Phys. 31, 3122, (20