ISSN 2289-0203
한국 입원환자의 영양상태에 대한 예비조사
이연미1, 김선형2, 김영신3, 김은미4, 김정연5, 금민애6, 문재영7, 박수진8, 신동우9, 안홍엽10, 이영란11, 임해준12, 홍석경6, 백현욱13
1서울아산병원 영양팀, 2전북대학교병원 영양팀, 3서울아산병원 약제팀, 4삼성서울병원 영양팀, 5세브란스병원 간호부, 6서울아산병원 외과, 7충남대학교병원 내과, 8삼성서울병원 약제팀, 9한림대학교 의과대학 동탄성심병원 외과학교실, 10동국대학교 통계학과,
11한림대학교 동탄성심병원 영양팀, 12한림대학교 한강성심병원 외상외과, 13분당제생병원 내과
Nutritional Status of Korean Hospitalized Patients: A Multi-Center Preliminary Survey
Yeon-Mi Lee1, Seon Hyeong Kim2, Young Shin Kim3, Eun Mee Kim4, Jung Yeon Kim5, Min Ae Keum6, Jae Young Moon7, Su Jin Park8, Dong Woo Shin9, Hong-Yup Ahn10, Young Ran Lee11, Hae Jun Yim12, Suk-Kyung Hong6, Hyun Wook Baik13
1Dietetics and Nutrition Services Team, Asan Medical Center, Seoul, 2Dietetics and Nutrition Services Team, Chonbuk National University Hospital, Jeonju, 3Department of Pharmacy, Asan Medical Center, 4Department of Dietetics, Samsung Medical Center, 5Division of Nursing, Severance Hospital,
6Department of Surgery, Asan Medical Center, Seoul, 7Department of Internal Medicine, Chungnam National University Hospital, Daejeon, 8Department of Pharmacy, Samsung Medical Center, Seoul, 9Department of Surgery, Dongtan Sacred Heart Hospital, Hallym University College of Medicine, Hwaseong, 10Department of Statistics, Dongguk University, Seoul, 11Dietetics and Nutrition Services Team, Dongtan Sacred Heart Hospital, Hallym University, Hwaseong, 12Department of Burn Surgery and Critical Care, Burn Center, Hangang Sacred Heart Hospital, Hallym University, Seoul,
13Department of Internal Medicine, DMC BundangJesaeng Hospital, Seongnam, Korea
Purpose: The purpose of this study is to examine the prevalence of malnutrition in hospitalized patients aged 18 years old or older at the time of admission in Korea.
Methods: This multi-center, preliminary survey included patients over 18 years old who were admitted on a given day from six hospitals in Korea. Nutritional status was assessed using Subjective Global Assessment tool. Data collected included hospital characteristics, patient characteristics, nutrition screening, and nutrition assessment.
Results: Among the 99 patients recruited (47 males, 47.5%), 18 (18.2%) and 2 (2.0%) patients were moderately malnourished and severely malnourished, respectively. The mean age of the malnourished group was older than that of the well-nourished group (49.7±17.1 vs. 60.5±13.6 years old, P-value=0.010). Patients admitted for medical treatment were more malnourished than those admitted for surgical treatment.
Conclusion: Results of the multi-center preliminary survey showed 20.2% prevalence of malnutrition on admission. A national survey was piloted and will be followed by full implementation.
Key Words: Malnutrition, Prevalence, Inpatients, Multi-center, Korea
Received Aug 11, 2014; Revised Aug 18, 2014; Accepted Aug 18, 2014 Correspondence to Suk-Kyung Hong
Division of Trauma and Surgical Critical Care, Department of Surgery, Asan Medical Center, University of Ulsan College of Medicine, 88 Olympic-ro 43-gil, Songpa-gu, Seoul 138-736, Korea
Tel: +82-2-3010-3510, Fax: +82-2-3010-6701, E-mail: [email protected] Conflict of interest: None.
This is an Open Access article distributed under the terms of the Creative Commons Attribution Non-Commercial License (http://creativecommons.org/licenses/by-nc/3.0) which permits unrestricted non-commercial use, distribution, and reproduction in any medium, provided the original work is properly cited.
서 론
병원에 입원중인 환자의 영양불량은 임상치료 결과에 영향을 미칠 수 있음이 널리 알려지면서, 임상가들은 영양불량 유병률 연구 및 영양불량 환자에 대한 영양치료를 함으로써 임상치료 효과를 극대화하기 위한 연구들을 보고하고 있다.1-3 연구대상
이나 영양상태 평가도구 등에 따라 차이는 있지만, 입원환자의 영양불량 유병률은 20%∼50%로 알려져 있으며, 영양불량 환 자의 재원일수, 재입원률, 사망률 등은 영양상태가 양호한 환자 들에 비해 증가하는 것으로 보고되고 있다.4-6 영양불량은 개인 적 측면의 임상치료 효과 감소의 결과도 초래하지만, 합병증 발 생으로 투여되는 의료 자원, 비용 및 인력의 증가와도 관련이 있 어 최근의 영양불량 연구는 영양불량 개선을 통한 전반적인 의 료 경제적 측면의 치료효율성 개선에 초점을 맞추고 있다.7
Joint Commission for Accreditation of Healthcare Organi- zation에서는 입원 초기 영양평가를 포함한 초기평가를 권고하 며, 환자의 상태, 연령, 건강요구도, 요청, 선호에 따른 맞춤형 초 기 평가 실시와 추가적인 전문적 평가 필요 여부에 대해 언급하 고 있다.8 국내 종합병원 대다수에서는 국내 의료기관 평가 기준 에 따라 입원 24시간 이내 초기 영양평가를 시행하고 있다. 초 기 영양평가를 통해 선별되는 환자는 영양불량 위험에 있는 환 자이고, 각 의료기관별 규정에 따라 영양관리되고 있다.
본 조사는 예비조사로서, 영양불량과 그 영양치료에 대한 관 심이 증가되고 있는 반면 국내 의료기관에 입원하는 환자들의 영양상태 수준을 대표하는 기초자료가 없어 계획되었으며, 추 후 영양상태를 기반으로 한 맞춤형 영양정책 및 국가적 차원의 건강정책 수립, 의료 서비스 질평가의 근거자료로 제시하고자 실시하였다. 이 예비조사를 시작으로 국내의 여러 의료기관의 도움을 받아 병원 입원 환자의 영양상태에 대한 조사를 추후 확 대, 계획하고 있다.
대상 및 방법
1. 조사 대상 및 시기
영양집중지원팀이 구성되어 있는 상급종합병원과 종합병원 6 개 병원이 참여하였고, 연구에 동의한 18세 이상의 성인환자 99 명을 대상으로 하였으며, 임산부, 응급실로 입원하거나 48시간 이내 퇴원한 환자는 제외하였다.
예비조사 2주전 각 병원 영양집중지원팀 연구자(의사, 영양 사, 간호사, 약사 중 최소 1인)에게 연구목적과 방법을 교육하였 고, 2013년 7월 15일에 입원한 환자 중 통계학자에 의해 발생된 배정표에 의해 병원 별로 입원환자의 규모에 따라 10명 또는 20 명의 대상자를 무작위로 선정하였다.
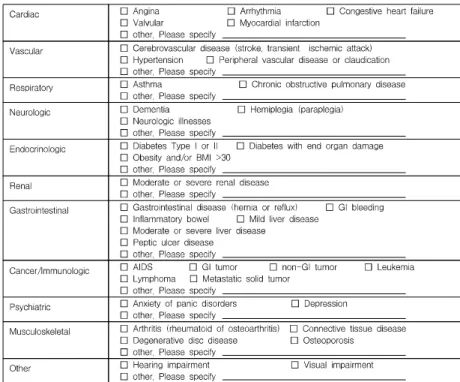
환자의 이름, 등록번호 등 개인식별 정보를 제거한 설문지를 통해 자료를 받아(Fig. 1), 엑셀파일에 자료를 입력하였다.
2. 조사 내용 및 방법
영양검색결과는 입원 초기(24시간 이내) 각 병원 별로 이미
구축된 검색 기준을 그대로 사용하였다. 영양검색 기준은 병원 별로 차이가 있었으며, 신체계측 수치, 혈중 알부민, 총 임파구 수 등의 생화학적 검사결과, 식사력, 나이, 소화기 장애 등의 조 합으로 다양하였고 영양불량 위험 있음, 위험 없음 두 군으로 조 사하였다.
환자의 일반적인 정보는 입원 48시간 이내에 의무기록 (medical records)을 통해 입원 당시 진료과, 입원 유형, 주진단 명, 기저질환의 유무와 종류를 조사하였다.
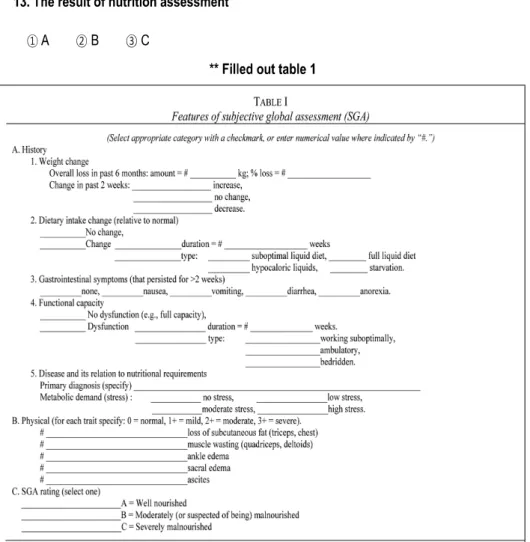
영양상태 평가는 영양사가 Subjective Global Assessment (SGA)를 이용하였으며 의무기록과 면담법을 통해 시행하였 다.9 SGA에는 체중변화, 경구섭취량의 변화, 소화기 증상, 활동 정도, 대사적 스트레스 정도, 신체 증상 등이 포함되어 있고, 환 자의 영양상태는 영양사가 총괄적으로 판단하여 A (well-nour- ished), B (moderately malnourished), C (severely malnour- ished) 3군으로 판정하였다.
3. 통계 처리
연구결과는 IBM SPSS Statistics 21.0 (IBM Co., Armonk, NY, USA)을 이용하여 분석하였다. 환자의 일반적 특성과 영양 불량률은 백분율 또는 평균±표준편차로 나타냈다. SGA에 의 한 영양판정결과, 세 군은 다시 영양양호군(SGA rating, A)과 영양불량군(B+C) 두 군으로 나누었고, 각 군에 따라 임상적 특 징에 차이가 있는지 t-test 또는 chi-square test를 통해 확인하 였다. 영양불량과의 영양검색 일치도는 chi-square test를 이용 하여 평가하였다. 영양판정 결과에 미치는 요인을 분석하기 위 해 이분형로지스틱 분석을 사용하였고, P값은 0.05 미만으로 통 계적인 유의성을 확인하였다.
결 과
1. 대상자의 일반적 특성
대상 환자는 99명으로 남:여의 비는 1:1.1이었다(Table 1).평 균 연령은 남자가 여자에 비해 높았으며(55.9±16.1세, 48.3±
17.1세; P=0.025), 평균 체질량지수(body mass index, BMI) 는 남녀 차이가 없었다(24.2±4.3 kg/m2, 24.0±4.7 kg/m2; P=0.819). 입원 시 진료과는 일반외과가 14%로 가장 많았고, 소화기내과(11%), 부인과(8%) 순이었고, 예정된 수술을 이유 로 입원하는 경우는 51.5%였고, 내과적 치료 목적은 43.4%였 다(Table 2). 주진단명이 암인 환자가 전체의 31.3%로 가장 많 았고, 혈관질환을 기저질환으로 가지고 있는 환자가 34.3%였다 (Table 3).
Fig. 1. Case report form of patient.
BMI = body mass index; GI = gastrointestinal (adapted from Table 1 of Reference 9).
2. 영양판정 결과
SGA를 이용한 영양판정 결과, 고도 영양불량군(C, severely malnourished)은 2명(2.0%), 중등도 영양불량군(B, moder- ately malnourished)은 18명(18.2%), 영양양호군(A, well- nourished)은 79명(79.8%)이었다(Fig. 2).
3. 영양검색 결과와 영양판정 결과의 일치도
각 병원 별로 정해진 검색도구에 의한 영양검색결과와 SGA 따른 영양판정 결과를 비교했을 때, 일치하지는 않았다(=
0.048, P=0.567) (Table 4).
4. 영양불량도에 따른 두 군간의 비교
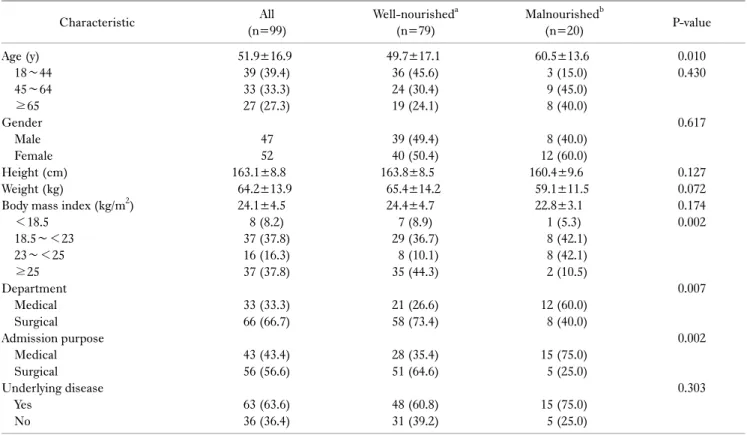
SGA를 이용하여 나온 영양판정 결과를 영양양호군(SGA rating, A)과 영양불량군(B+C) 두 군으로 나누어 일반적인 특 징에 차이가 나는지 비교하였다(Table 5). 나이는 영양불량군 이 양호군에 비해 유의적으로 많았고(49.7±17.1 vs. 60.5±
13.6; P=0.010), BMI 평균은 두 군간 차이가 없었으나, 영양불 량군에서는 정상, 과체중 비율이 각각 42.1%로 많았고, 양호군 에는 비만 비율이 44.3%로 높았다(P=0.002).
입원 시 진료과를 내과계와 외과계로 구분 지어보니 영양불량 군에는 내과계 진료과가 60.0%, 양호군에서는 외과계 진료과가 73.4%로 더 많았다(P=0.007). 입원 치료 목적에서도 영양불량
Fig. 1. Case report form of patient.
BMI = body mass index; GI = gastrointestinal (adapted from Table 1 of Reference 9) (continued).
군에는 내과적 치료 목적의 환자가 75.0%, 양호군에는 외과적 수술 환자가 64.6%였다(P=0.002). 두 군에서 기저질환을 가지 고 있는 환자의 비율은 영양불량군에서 더 많았으나 유의적 차 이는 없었다(P=0.303).
5. 영양불량도와 영양판정 요인
SGA 평가 세부 요인 중 체중감소 여부, 식사량 감소여부, 거동 변화 여부, 대사적 요구량, 신체증후의 유무는 단변량 분석에서 는 영양양호군과 영양불량군 두 군간 유의적 차이를 보였으나 다
변량 분석에서는 차이가 없었다(Table 6). 최근 6개월간 체중감 소가 있는 환자는 20명(20.2%)이었고, 평균 체중감소량은 4.5±2.1 kg, 감소율은 6.6±2.8%였으나, 영양양호군과 영양불량 군 간의 차이는 없었다. 경구섭취량 감소가 있는 환자도 21명이 었는데, 평균 감소기간은 3.8±3.3주였고, 두 군간 차이는 없었다.
거동 기능에 문제가 있는 환자는 9명이었고, 평균 지속 기간은 2.1±2.1주였다. 대사적 요구도는 no stress에서 severe stress까 지 1에서 4로 점수화 하였을 때, 평균 1.7±0.7점이었고, 영양불 량군이 유의적으로 높았다(1.6±0.6점 vs. 2.3±0.7점; P<0.001).
Table 1. General characteristics of all patients (n=99)
Characteristic Value
Age (y)
≤19 20∼29 30∼39 40∼49 50∼59 60∼69 70∼79
≥80 Gender
Male Female Height (cm) Weight (kg)
Body mass index (kg/m2)
51.9±16.9 1 (1.0) 12 (12.1)
8 (8.1) 21 (21.2) 18 (18.2) 21 (21.2) 6 (6.1) 2 (2.0)
47 (47.5) 52 (52.5) 163.1±8.8
64.2±13.9 24.1±4.5
Values are presented as mean±standard deviation or number (%).
Table 3. Admission-related characteristics of the patients (n=99)
Characteristic Case No.
Main diagnostic categories Neoplastic
Others Digestive
Blood and blood-forming organs
Symptoms, signs and abnormal clinical and laboratory Injuries, poisoning
Circulatory Respiratory Genitoruinary Underlying disease
Vascular
Cancer/immunologic Endocrinologic Gastrointestinal Musculoskeletal Cardiac Pulmonary Renal Neurological Psychiatric Others
31 (31.3) 17 (17.1) 11 (11.1) 8 (8.1) 8 (8.1) 8 (8.1) 6 (6.1) 5 (5.1) 5 (5.1)
34 (34.3) 23 (23.2) 16 (16.2) 8 (8.1) 5 (5.1) 4 (4.0) 3 (3.0) 3 (3.0) 2 (2.0) 1 (1.0) 3 (3.0) Values are presented as number (%).
Table 2. Admission status of the patients (n=99)
Characteristic Case No.
Type of admission Medical
Elective operation Emergency operation Department
General Surgery Gastroenterology Gynecology Endocrinology Urology
Orthopedic Surgery Plastic Surgery Cardiology Oncology Pulmonology
Liver Transplantation and Hepatobiliary Surgery Colon and Rectal Surgery
Breast Endocrine Surgery Neurology
Infectious Medicine Nephrology Neurosurgery Emergency Medicine Neuclear Medicine Oral Surgery
Hepatobiliary and Pancreatic Surgery
43 (43.4) 51 (51.5) 5 (5.1)
14 (14.1) 11 (11.1) 8 (8.1) 7 (7.1) 7 (7.1) 5 (5.1) 5 (5.1) 4 (4.0) 4 (4.0) 4 (4.0) 4 (4.0) 4 (4.0) 4 (4.0) 3 (3.0) 2 (2.0) 2 (2.0) 2 (2.0) 1 (1.0) 1 (1.0) 1 (1.0) 1 (1.0) Values are presented as number (%).
Fig. 2. Nutritional status at hospital admission, 99 patients.
고 찰
본 연구는 국내의 종합병원에 입원환 성인 환자의 영양불량 대표 유병률을 살펴보고자 하는 다기관 단면연구를 시행하기
전, 6개 종합병원의 도움을 받아 실시한 예비조사였다.
병원에 입원해 있는 환자들은 영양불량 또는 영양불량 위험에 놓여있다고 알려져 있듯이, 본 예비조사에서도 입원 시점에 이 미 환자의 5분의 1은 영양불량임을 알 수 있었다. 병원환자의 영양불량 유병률은 20%∼50% 가까이 보고되고 있는데, 대부 분의 연구들은 중환자, 암환자, 노인 환자 등의 특성을 가진 한 정된 대상자를 기반으로 하였다.10 본 예비조사는 특정 계층이
Table 4. Comparison of the results of the initial nutrition screening and nutrition assessment by SGA
Nutrition screening
Nutrition assessment Well-
nourisheda Malnourishedb Total Low risk of malnutrition
At risk of malnutrition Total
74 (80.4) 5 (71.4) 79 (79.8)
18 (19.6) 2 (28.6) 20 (20.2)
92 (100) 7 (100) 99 (100) Values are presented as number of subjects (%). =0.048, P=0.567.
Kappa value () <0.2 (poor), 0.2~0.4 (fair), 0.4∼0.6 (moderate), 0.6∼0.8 (substantial), >0.8 (perfect).
SGA = Subjective Global Assessment.
aWell-nourished group from SGA rating A, bmalnourished group from SGA rating B+C.
Table 5. Comparison between well-nourished and malnourished group
Characteristic All
(n=99)
Well-nourisheda (n=79)
Malnourishedb
(n=20) P-value
Age (y) 18∼44 45∼64
≥65 Gender
Male Female Height (cm) Weight (kg)
Body mass index (kg/m2)
<18.5 18.5∼<23 23∼<25
≥25 Department
Medical Surgical Admission purpose
Medical Surgical Underlying disease
Yes No
51.9±16.9 39 (39.4) 33 (33.3) 27 (27.3)
47 52 163.1±8.8
64.2±13.9 24.1±4.5
8 (8.2) 37 (37.8) 16 (16.3) 37 (37.8)
33 (33.3) 66 (66.7)
43 (43.4) 56 (56.6)
63 (63.6) 36 (36.4)
49.7±17.1 36 (45.6) 24 (30.4) 19 (24.1)
39 (49.4) 40 (50.4) 163.8±8.5
65.4±14.2 24.4±4.7
7 (8.9) 29 (36.7) 8 (10.1) 35 (44.3)
21 (26.6) 58 (73.4)
28 (35.4) 51 (64.6)
48 (60.8) 31 (39.2)
60.5±13.6 3 (15.0) 9 (45.0) 8 (40.0)
8 (40.0) 12 (60.0) 160.4±9.6
59.1±11.5 22.8±3.1
1 (5.3) 8 (42.1) 8 (42.1) 2 (10.5)
12 (60.0) 8 (40.0)
15 (75.0) 5 (25.0)
15 (75.0) 5 (25.0)
0.010 0.430
0.617
0.127 0.072 0.174 0.002
0.007
0.002
0.303
Values are presented as mean±standard deviation or number of subjects (%).
SGA = Subjective Global Assessment.
aWell-nourished group from SGA rating A, bmalnurished group from SGA rating B+C.
아닌, 18세 이상의 모든 환자를 대상으로 하였던 것이며, 영양 불량 유병률이 보고된 결과들보다 다소 낮게 나온 이유로 생각 된다.
국내 의료기관 인증평가와 국제 병원 인증에서도 권고한 대 로, 각 의료기관에서는 환자가 입원하면 24시간 이내 영양검색 (nutrition screening)을 시행하고 있다. 의료기관 별 영양검색 도구에 대한 표준화된 권고사항은 아직 없으며, 입원환자의 특
성 또는 의료기관의 특성을 반영하여 정한 도구에 의해 영양불 량 위험에 있는 환자를 선별하고 있다. 각 병원은 영양검색 결과 와 영양판정 결과를 비교하여 각 의료기관에서 정한 영양검색 도구의 타당도를 검증하고 좀 더 민감한 영양검색 도구를 개발 하여 영양불량환자를 입원 초기에 찾고자 노력하고 있다. 그러 나 본 예비조사에서는 영양불량 위험의 영양검색결과와 영양불 량 영양판정결과는 일치하지 않았으며, 각 의료기관별 영양검 색 도구의 타당도에 대한 검증이 요구된다는 사실을 제시하고 있다.
본 조사에서는 내과적 치료를 목적으로 입원한 환자가 외과적 치료 목적의 환자보다 영양불량률이 더 높았다. 영양불량은 치 매, 암, 감염, 신장질환 등의 진단명과 관련이 있고, 내과적 진단 명은 이환율, 사망률과 치료비용 상승과 연관이 있다고 하였 다.11 본 조사에서는 대상자수가 적어 진단명과 영양불량간의 연관성을 분석하지는 않았으나, 추후 연구 시 반영하면 맞춤형 영양지침 및 국가적 차원의 건강정책 수립, 의료 서비스 질평가 의 근거자료가 될 것이다.
영양불량의 판정 도구로서 사용한 SGA는 주관적 평가도구로 써의 제한점을 가지고 있음에도 객관적 자료만을 이용하는 평
Table 6. Comparison between result of assessment and assessment factors All
(n=99)
Well-nourished (n=79)
Malnourished
(n=20) P-value
Weight change
Loss in past 6 months (kg) Loss in past 6 months (%) Dietary intake change
Duration (wk)
Gastrointestinal symptoms Nausea
Vomiting Diarrhea Anorexia Functional capacity
Duration (wk)
Metabolic demand (n=99) No stress
Low stress Moderate stress High stress Physical
Loss of subcutaneous fat Muscle wasting Ankle edema Sacral edema Ascites
20 (20.2) 4.5±2.1 6.6±2.8 21 (21.2)
3.8±3.3 15 (15.2) 4 (26.7) 0 (0.0) 1 (6.7) 10 (66.7)
9 (9.1) 2.1±2.1 1.7±0.7 41(41.4) 46(46.5) 12(12.1) 0 (0.0) 21 (21.2)
8 14 7 1 1
8 (10.1) 4.4±2.4 5.8±2.5 5 (6.3) 2.0±1.2
5 (6.4) 0 (0.0) 0 (0.0) 0 (0.0) 5 (100.0)
3 (3.8) 3.4±2.9 1.6±0.6 38 (48.1) 38 (48.1) 3 (3.8) 0 (0.0) 9 (11.4)
3 4 5 0 1
12 (60.0) 4.6±2.0 7.2±2.9 16(80.0)
4.3±3.6 10 (50.0) 4 (40.0) 0 (0.0) 1 (10.0) 5 (50.0) 6 (30.0) 1.5±1.4 2.3±0.7 3 (15.0) 8 (40.0) 9 (45.0) 0 (0.0) 12 (60.0)
5 10 2 1 0
<0.001 0.835 0.262
<0.001 0.176
<0.001
0.012 0.193
<0.001
<0.001
Values are presented as number of subjects (%) or mean±standard deviation.
가보다 신체의 영양상태를 잘 반영하므로 여러 선행연구의 표 준 도구로 대표되고 있다. 영양불량도를 섬세하게 숫자화 할 수 없고, 평가자의 주관에 따라 결과값이 달라질 수 있다는 단점을 보완하기 위해서는, 표준화된 영양판정 도구의 개발 및 영양평 가자의 숙련도가 뒷받침되어야 할 것이다.
본 조사는 국내 병원에 입원하는 환자의 초기 영양상태 및 영 양불량 대표 유병률을 보기 위한 연구의 예비조사이다. 앞으로 진행될 본조사는 국내의 대표 병원을 어떻게 선택할 것이며, 입 원환자를 어떻게 표본 추출할 것인가에 대해 좀 더 신중할 필요 가 있겠다. 임상결과와 밀접한 관련이 있는 영양불량률의 감소 와 질병 치료비 등 의료자원의 적절한 배분 및 절감을 목표로 한 맞춤형 영양관리 프로세스 정립에 앞서, 본 조사는 환자의 상태 및 질환 등을 넘어선 국가적인 기초자료가 될 것이다.
결 론
국내 의료기관에 입원하는 성인 환자들의 영양상태 수준을 대 표하는 기초자료가 없어 계획된 본 예비조사의 결과인 입원환 자 영양불량 유병률은 20.2%이다. 추후 행해질 본조사에서는 연구 참여 병원을 더 늘려서 대표성을 좀 더 높여야 하며, 입원
초기 영양불량 유병률이 20% 내외인지 검증해야 할 것이다.
ACKNOWLEDGMENTS
We wish to express sincere thanks to Bokyung Min, Seoyean Yoo, Mijin Jeong, Younsoo Cho, Jiyoung Jang for data collection in this survey.
REFERENCES
1. Giner M, Laviano A, Meguid MM, Gleason JR. In 1995 a correlation between malnutrition and poor outcome in critically ill patients still exists. Nutrition 1996;12(1):23-9.
2. Bistrian BR, Blackburn GL, Vitale J, Cochran D, Naylor J.
Prevalence of malnutrition in general medical patients. JAMA 1976;235(15):1567-70.
3. Pirlich M, Schütz T, Norman K, Gastell S, Lübke HJ, Bischoff SC, et al. The German hospital malnutrition study. Clin Nutr 2006;25(4):563-72.
4. Gallagher-Allred CR, Voss AC, Finn SC, McCamish MA.
Malnutrition and clinical outcomes: the case for medical nutrition therapy. J Am Diet Assoc 1996;96(4):361-6, 369.
5. Agarwal E, Ferguson M, Banks M, Batterham M, Bauer J, Capra S, et al. Malnutrition and poor food intake are associated with prolonged hospital stay, frequent readmissions, and greater in-hospital mortality: results from the Nutrition Care Day Survey 2010. Clin Nutr 2013;32(5):737-45.
6. Lim SL, Ong KC, Chan YH, Loke WC, Ferguson M, Daniels L.
Malnutrition and its impact on cost of hospitalization, length of stay, readmission and 3-year mortality. Clin Nutr 2012;31(3):
345-50.
7. Freijer K, Tan SS, Koopmanschap MA, Meijers JM, Halfens RJ, Nuijten MJ. The economic costs of disease related malnutrition.
Clin Nutr 2013;32(1):136-41.
8. Joint Commission International. Joint Commission Interna-
tional accreditation standards for hospitals. 3rd ed. Oakbrook Terrace, Ill:Joint Commission International;2007:71-3.
9. Detsky AS, McLaughlin JR, Baker JP, Johnston N, Whittaker S, Mendelson RA, et al. What is subjective global assessment of nutritional status? JPEN J Parenter Enteral Nutr 1987;11(1):
8-13.
10. Lee H, Kang JH, Kim E, Kim WG. Prevalence of malnutrition in hospitalized elderly Korean patients based on Mini Nutritional Assessment-Short Form. J Clin Nutr 2014;6(1):24-9.
11. Marco J, Barba R, Zapatero A, Matía P, Plaza S, Losa JE, et al.
Prevalence of the notification of malnutrition in the departments of internal medicine and its prognostic implications. Clin Nutr 2011;30(4):450-4.