• 검색 결과가 없습니다.

Characterization on the Ozone Oxidation of Raw Natural Rubber Thin Film using Image and FT-IR Analysis

N/A
N/A
Protected

Academic year: 2021

Share "Characterization on the Ozone Oxidation of Raw Natural Rubber Thin Film using Image and FT-IR Analysis"

Copied!
8
0
0

로드 중.... (전체 텍스트 보기)

전체 글

(1)

DOI: https://doi.org/10.7473/EC.2019.54.2.110

Characterization on the Ozone Oxidation of Raw Natural Rubber Thin Film using Image and FT-IR Analysis

Ik-Sik Kim , DooYoul Lee, Kyung-Suk Sohn, Jung-Hun Lee, and JoongWoo Bae

Aero Technology Research Institute, ROKAF, P.O. Box 304-150, 352 Ayang-ro, Dong-gu, Daegu, Republic of Korea (Received April 4, 2019, Revised April 22, 2019, Accepted April 25, 2019)

Abstract: The characterization of the ozone oxidation for raw natural rubber (NR) was investigated under controlled con- ditions through image and fourier transform infrared (FT-IR) analysis. The ozone oxidation was performed on a transparent thin film of raw NR coated on a KBr window in a dark chamber at 40

o

C under low humidity conditions to completely exclude thermal, moisture, or light oxidation. The ozone concentration was set at 40 parts per hundred million (pphm).

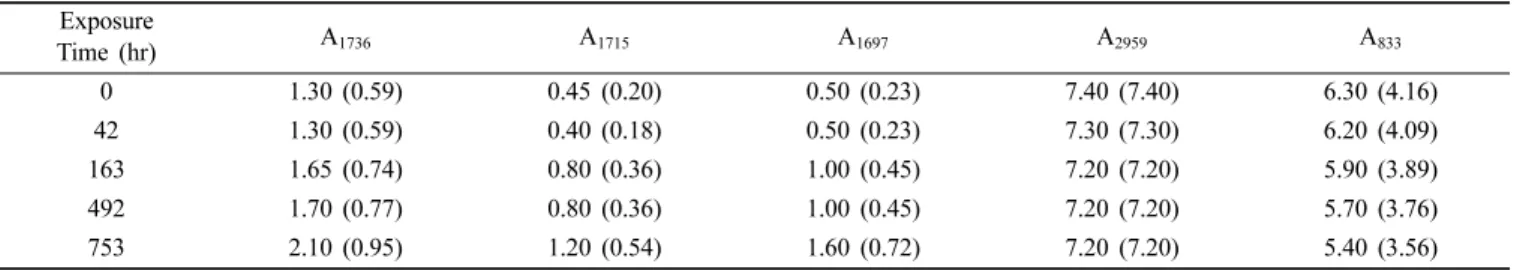
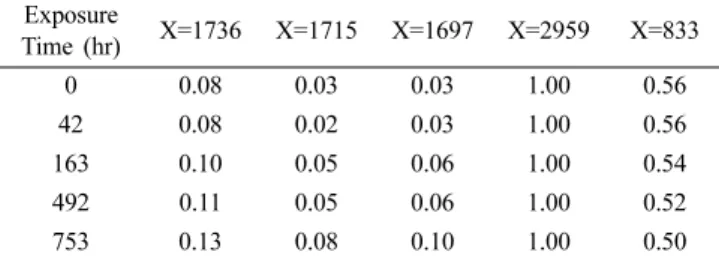
Before or after exposure to ozone, the image of the thin film for raw NR was observed at a right or tilted angle. FT-IR absorption spectra were measured in the transmission mode according to ozone exposure time. The ozone oxidation of NR was determined by the changes in the absorption peaks at 1736, 1715, 1697, and 833 cm

1

, which were assigned to an alde- hyde group (-CHO), a ketone group (-COR), an inter-hydrogen bond between carbonyl group (-C=O) from an aldehyde or a ketone and an amide group (-CONH-) of protein, and a cis-methine group (cis-CCH
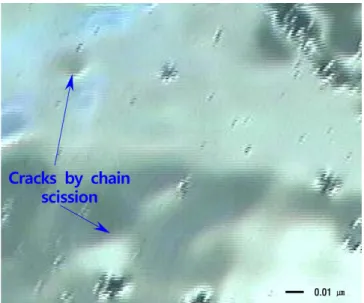
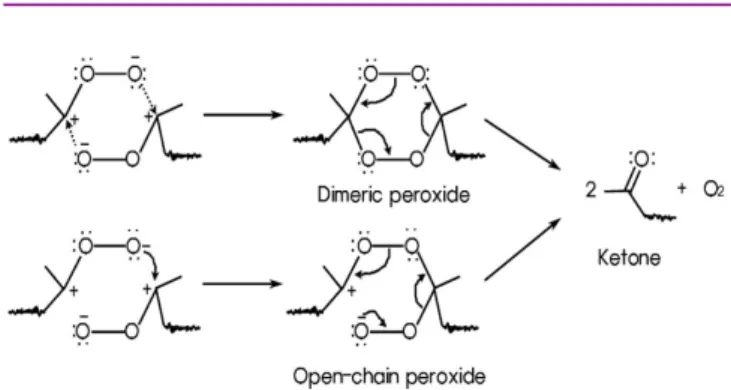
3

=CH-), respectively. During ozone exposure period, the results indicated that the formation of the carbonyl group of aldehyde or ketone was directly related to the decrement of the double bond of cis-1,4-polyisoprene. Only carbonyl compounds such as aldehydes or ketones seemed to be formed through chain scission by ozone. Long thin cracks with one orientation at regular intervals, which resulted in consecutive chain scission, were observed by image analysis. Therefore, one possible two-step mechanism for the formation of aldehyde and ketone was suggested.

Keywords: Ozone Oxidation, Natural Rubber, FT-IR, Image, Chain Scission, Analysis

Introduction

Most of polymers usually contain high levels of unsatu- ration in the polymer backbone. The unsaturation of polymer means what includes carbon-carbon double bond (-C=C-) in its backbone. Such polymers are natural rubber (NR), styrene butadiene rubber (SBR), and polybutadiene rubber (BR). “R”

expressed in the ASTM designations does not mean “rubber”

but does refer to “the presence of unsaturation” in the poly- mer backbone. Most of these polymers are susceptible to degradation when exposed to ultra-violet (UV) radiation, heat, water, ozone, and oxygen. The lifetime of a material is determined by UV radiation (photochemical degradation), thermal oxidation, ozone oxidation, or a combination of these factors.

1-3

Ozone is well known as a degrading agent for rubbers and other unsaturated polymers.

4

Ozone attack on NR was first recognized as being important in the early 1950s due to

ozone cracking problem. A lot of work has been carried out over the past 70 years to understand degradation effects in rubber due to the action of ozone in the air, and more espe- cially, the mechanism of chain scission which is responsible for the accompanying decrease in elasticity.

5-7

NR has four kinds of microstructures in its molecular chain which are cis-1,4-, trans-1,4-, 1,2-, and 3,4-polyisoprene.

The main ingredient of NR is cis-1,4-polyisoprene. There are numerous publications on the degradation processes of both vulcanized and unvulcanized NR. Degradation products of NR that have been identified are hydroperoxides, alcohols, aldehydes, ketones, esters, lactones, anhydrides, ozonides, and carboxylic acids.

8-14

Generally, rubber vulcanizates possess various types of materials such as polymers, carbon blacks, process oils, anti- oxidants, accelerators, crosslinking agents, and activators.

When rubber vulcanizates are exposed to ozone, complex chemical reactions can occur. However, it is not easy to detect characteristic oxidation reactions of polymer itself using lights such as fourier transform infrared (FT-IR) or

Corresponding author E-mail: [email protected]

(2)

Raman spectroscopy because rubber vulcanizates include an excellent light absorbing material like carbon black. There- fore, investigation of oxidation reactions by environmental conditions is only important when the rubber is transparent, as with raw rubber or pure gum peroxide vulcanizates.

15

In this study, the characterization of the ozone oxidation on a transparent thin film of raw NR was investigated in a dark chamber at 40

o

C under low humidity conditions through image and FT-IR analysis. The analytical techniques were used with FT-IR spectroscopy (Bruker, IFS 85) and Image analyzer (Olympus, SZX16).

Experimental

1. Materials

SMR 20 as natural rubber was used. This grade with total nitrogen content 0.6% (w/w rubber) from protein was made from field coagulum in Malaysia. Table 1 shows standard malaysian rubber specifications of SMR-20.

16

2. Sample Preparation

NR in raw was cut into 1 mm

3

in size and extracted with acetone for 4 hours to remove residual emulsifying agents or soluble organic substances which interfere with spectra of NR. The specimen was dried at 25

o

C for 1 day. 1 g of dried sample was dissolved in a sealed beaker including 100 mL of toluene at room temperature for 7 days. The concentration of the solution was adjusted to contain 1% NR solution (w/

v). The sample for measurement of the FT-IR spectroscopy and Image analyzer was prepared as follows. A transparent thin film of raw NR was made on a transparent KBr window with dimension of 20 × 20 × 5 mm (width × length × thick- ness) by coating from 1% NR solution. 1-2 drops of the solu- tion using a glass capillary were dropped and coated thinly on a KBr window. The film thickness must be adjusted to

give an absorbance of about 0.9 at 2959 cm

1

. Sample coated on a KBr window was maintained to evaporate toluene in a dark at room temperature for 7 days.

3. Ozone Oxidation

The temperature at which an ozone test is performed is very important because ozone becomes unstable at high tem- perature. Generally, 40

o

C is a commonly selected ozone test temperature.

2

Thus the ozone oxidation test was operated in a dark at 40

o

C under low humidity conditions to completely exclude thermal, moisture, or light oxidation. The ozone con- centration in a chamber was set at 40 parts per hundred mil- lion (pphm). The ozone oxidation was conducted on a transparent thin film of raw NR coated on a KBr window.

4. Characterization

The images of before and after ozone exposure were observed on thin film using Image analyzer (Olympus, SZX16). The images were obtained at a rectangular and a tilted angle. The spectral changes of thin film of raw NR were measured in the transmission mode per about 24 hours according to the ozone exposure time using FT-IR spectros- copy (Bruker, IFS 85). FT-IR spectra were scanned from 400 to 4,000 cm

1

with a resolution 4 cm

1

. The average of 32 scans for sample was taken for the measurement.

Results and Discussion

1. Image Analysis

Figure 1 shows images for a transparent raw NR thin film coated on a KBr window (a) at a rectangular angle before ozone exposure and (b) at a tilted angle after ozone exposure of 753 hours. To throughly exclude the thermal, moisture, or light oxidation, the ozone oxidation was performed in a dark at 40

o

C under low moisture conditions. In fact, it was con- firmed that thin film of raw NR was not oxidized at that tem- perature for 40 days. Figure 1(a) shows that the image for thin film of raw NR before ozone exposure was neat, clean, and not shiny. However, Figure 1(b) indicates that the one for thin film of raw NR after ozone exposure of 753 hours reveals a unique characteristic with very fine striations together with very shiny surfaces. These fine striations appeared dimly at partial sites. It was considered that fine Table 1. Standard Malaysian Rubber Specifications of SMR 20.

Property SMR-20

Dirt content (% max. on 40 mesh) 0.20

Ash content (% max.) 1.00

Nitrogen content (% max.) 0.60

Volatile matter (% max.) 0.80

Wallace platicity P

o

(min.) 30

Plasticity retension index (% min.) 40

(3)

ones with shiny surfaces could be produced by changes of the chemical structures of NR by ozone.

Figure 2 shows also the magnification image of the ozone oxidation at a tilted angle for the same sample shown in Fig- ure 1(b). Compared to the image seen at a right angle, that at a tilted angle can be seen even more apparently. The image shows a unique regular structure which is composed of a lot of dim and bright parts moving along the lines to one direc- tion at constant intervals and more shiny surfaces. A unique structure resembles striations in appearance. Striations have much more regular structures and thinner in thickness than those of ultra-violet (UV) oxidation.

17

Striations might be

considered as fine cracks which results in changes of chem- ical structures of NR by ozone. It is well known that ozone crack occurs only at the surface since ozone does not extend into the interior of the rubber layer.

2

What seems to be shiny on surface can result in the formation of volatile materials with low molecular weights by chain scission.

18

A new sur- face generated from volatile materials seems to be shiny. This will be discussed more later. Anyway, this unique image may result from regular molecular rearrangement of thin film of raw NR coated on a KBr window.

Although it is known that high cis-1,4 polyisoprene of NR latex does not have regular structure showing amorphous character,

16

our result represents that image of a raw NR thin film after the ozone oxidation shows unusual regular struc- tures as reported previously in the UV oxidation.

17

The reg- ular structures may be formed on an ionic transparent KBr window in the process of evaporating slowly toluene from dilute NR solution at room temperature for 7 days. Because the carbon-carbon double bond (-C=C-) had more polar than methyl group (-CH

3

) and dimethylene group (-CH

2

CH

2

-) in NR backbone, interactions between double bonds were much stronger than those between dimethylene groups. Therefore, when the solution was evaporated slowly, the molecular rear- rangement of NR on a KBr window might be divided into two regions. One is carbon-carbon double bond region (polar region) including pi-electrons and the other is dimethylene region (non-polar region) including  electrons. The image shows that there are linear regular striations (cracks) to one orientation, alternating the ridge and the valley as shown in Figure 1. Images for a transparent raw NR thin film coated on a KBr window (a) at a rectangular angle before ozone exposure and (b) at a tilted angle after ozone exposure of 753 hours.

Figure 2. Magnification image of the ozone oxidation at a tilted

angle for the same sample shown in Figure 1(b).

(4)

Figure 2. It may be considered that the ridge is composed of dimethylene group including less polar character and the val- ley is made up of the carbon-carbon double bond containing more polar character. It is thought the dark line is the valley region and the bright one is the ridge region. In the valley region, cracks by consecutive chain scission at the carbon- carbon double bond with ozone seemed to happen. The reg- ular interval between the valley and the ridge is constant and

parallel to lines each other. It might be considered that this resulted in the stoichiometric oxidation reaction of double bonds with ozone molecules.

In the UV oxidation, on the other hand, carbons at the dou- ble bonds and the allylic position were oxidized to produce aldehydes, ketones, and alcohols. Thus, the regular interval between the valley and the ridge seems to be less constant and does not parallel to lines each other.

17

It might be con- sidered that this resulted in non-stoichiometric oxidation reaction of the double bonds by UV radiation. Figure 3 depicts the regular rearrangement with one orientation for a raw NR thin film coated on a KBr window.

2. FT-IR Analysis

FT-IR absorption spectra for a transparent thin film of raw NR with the ozone exposure time ranging (a) from 2600 to 3600 cm

1

, (b) from 1600 to 1800 cm

1

, and (c) from 700 Figure 3. The regular rearrangement with one orientation for a

raw NR thin film coated on a KBr window.

Figure 4. FT-IR absorption spectra for a transparent thin film of raw NR with the ozone exposure time ranging (a) from 2600 to 3600

cm

1

, (b) from 1600 to 1800 cm

1

, and (c) from 700 to 1400 cm

1

in a dark at 40

o

C.

(5)

to 1400 cm

1

in a dark at 40

o

C are illustrated in Figure 4.

It is observed that oxidation reactions take place because there is the increment and reduction of intensity at some peaks according to the ozone exposure time.

As shown in Figure 4(a), in the regions ranging from 2600 to 3600 cm

1

, the FT-IR spectra of NR according to the ozone exposure time show there is no broad peak near 3425 cm

1

, showing no change after the ozone exposure. A broad peak near 3425 cm

1

means the formation of hydroxyl group (-OH). Unlike UV oxidation,

17

the spectra indicate that the intensity of broad peak near 3425 cm

1

remains constantly.

It was meant that hydroxyl group was not formed during the ozone oxidation. A broad peak near 3283 cm

1

may be assigned to N-H bond of an amide group (-CONH-) from small amount of protein contained in NR.

7

As shown in Figure 4(b), in the regions ranging from 1600 to 1800 cm

1

, the spectral patterns show that the intensity of absorption peaks at 1736 cm

1

, 1715 cm

1

, and 1697 cm

1

increases very slowly with the ozone exposure time. These first two peaks may be assigned to carbonyl groups from a ketone (R

2

C=O) and an aldehyde (RCHO). In the literature, it is well known that the peaks of carbonyl groups at 1736 and 1715 are attributed to aldehyde and ketone, respec- tively.

19

Ketones absorb at a lower frequency than aldehydes due to the addition of a methyl group present on a ketone.

This methyl group is electron-releasing compared to hydro- gen and supplies electrons to the C=O bond. This electron- donating effect weakens the C=O bond in the ketone and lowers the force constant and the absorption frequency. Thus,

it was confirmed that carbonyl group of an aldehyde or a ketone was produced by ozone.

As shown in Figure 5, a peak at 1697 cm

1

may be assigned by an inter-hydrogen bond between carbonyl group of an aldehyde or a ketone and an amide group of small amount of protein included in NR. Hydrogen bonding to a carbonyl group lengthens the C=O bond and lowers the stretching force constant. Therefore, this results in lowering the absorption frequency of carbonyl group.

As shown in Figure 4(c), before the ozone exposure, although the FT-IR spectrum of NR shows there are very weak broad peaks at 1000~1200 cm

1

region, the spectra show that the intensity of broad peaks near 1130, 1088, and 1038 cm

1

in this region remains constantly with the ozone exposure time. On the other hand, in case of UV oxidation of NR, the intensity of broad peaks in this region increases slowly and continuously with the UV irradiation time.

17

These peaks are assigned to carbon-oxygen single bond (-C- O) from primary or secondary alcohols, peroxides, esters, carboxylic acids, lactones, anhydrides, and ozonides. It was confirmed that the formation of carbon-oxygen bond was not influenced greatly by ozone. The absence of ozonides con- taining the carbon-oxygen single bond on the NR surface does not seem to be consistent with the Criegee mechanism for ozone attack of elastomers.

9

However, it was thought that ozonide could not be detected since it was very unstable.

Figure 5. The inter-hydrogen bond between an aldehyde or a ketone and protein of NR.

Table 2. Characteristic FT-IR Peaks for Un-oxidized and Oxidized Natural Rubber.

Sample

I.D. Absorption peak,

cm

1

Chemical structure

Un-oxidized form

3036 =C-H Stretching

2959, 2935, 2854 -CH

3

(Methyl), -CH

2

- (Methylene) 833 cis-Methine (-CCH

3

=CH wagging) Oxidized

form

1736 -C=O (Aldehyde)

1715 -C=O (Ketone)

1697 -C=O (Interactions with amide of protein)

Table 3. The Peak Height in each FT-IR Absorption according to the Ozone Exposure Time based on Figure 4.

Exposure

Time (hr) A

1736

A

1715

A

1697

A

2959

A

833

0 1.30 (0.59) 0.45 (0.20) 0.50 (0.23) 7.40 (7.40) 6.30 (4.16)

42 1.30 (0.59) 0.40 (0.18) 0.50 (0.23) 7.30 (7.30) 6.20 (4.09)

163 1.65 (0.74) 0.80 (0.36) 1.00 (0.45) 7.20 (7.20) 5.90 (3.89)

492 1.70 (0.77) 0.80 (0.36) 1.00 (0.45) 7.20 (7.20) 5.70 (3.76)

753 2.10 (0.95) 1.20 (0.54) 1.60 (0.72) 7.20 (7.20) 5.40 (3.56)

Numbers in parentheses are obtained from multiplying the absorption factors by their peak heights based on baseline.

(6)

The spectral pattern also shows that the intensity of peak at 833 cm

1

decreases slowly during the ozone exposure peri- ods. The peak at 833 cm

1

is assigned to a cis-methine group (cis-CCH

3

=CH-). That shows ozone oxidation occurs mainly at the double bond. Table 2 represents characteristic FT-IR peaks for the un-oxidized and oxidized natural rubber.

To quantitatively express the increment and decrement of intensity at each absorption peak, Table 3 represents the peak height in each FT-IR absorption according to the ozone expo- sure time based on Figure 4. Each peak height means its absorbance which is related to quantity (or concentration) according to Beer-Lambert law. The absorption factor is introduced because the absorbance of the maximum peak shown in Figure 4(a), (b), and (c) is different one another.

Thus, numbers in parentheses are obtained from multiplying the absorption factors by their peak heights based on base- line. The absorbance of the maximum peak on y-coordinate as shown in Figure 4(a), (b), and (c) indicates 0.846, 0.376, and 0.562, respectively. The absorbance of the maximum

peak of Figure 4(a) is considered as the criterion of absor- bance factor. Therefore, the absorption factor for A

1736

, A

1715

, and A

1697

of Figure 3(b) is 0.45. The absorption factor for A

833

of Figure 4(c) is 0.66. Table 4 represents the relative abundance calculated from the absorption peak ratio of A

x

(X=1736, 1715, 1697, and 833 cm

1

) to A

2959

based on the maximum peak. Figure 6 indicates the change curves of the increment and reduction in each absorbance frequency with the ozone exposure time based on Table 4.

During the ozone exposure time, the change curves show that the relative abundance of carbonyl group at 1736, 1715, and 1697 cm

1

increases very slowly from 0.08 to 0.13, from 0.03 to 0.08, and from 0.03 to 0.10, respectively. On the con- trary, the change curve shows that the relative abundance at 833 cm

1

decreases very slowly from 0.56 to 0.50. As before mentioned, what change curves increase or decrease very slowly at each absorbance frequency may be considered as two possible reasons: one is surface oxidation and the other is the formation of volatile materials with low molecular weights. The latter may be related to shiny surface seen in image. From these results, the appearance of carbonyl groups was directly related to the disappearance of cis-methine groups including the carbon-carbon double bonds. It was meant that ozone oxidation of NR was initiated at the carbon- carbon double bonds and carbonyl compounds like aldehydes or ketones were formed by consecutive chain scission.

The mechanism of ozone oxidation of NR has been known for many years and reviews of this field are available.

8-14

In this research, the two-step mechanism for the formation of aldehyde and ketone from NR by ozone can be explained as follows. As shown in Figure 7, in an initiation of ozone oxi- dation, ozones attack the double bonds through nucleophilic addition reaction to produce very unstable ozonides, not Table 4. The Relative Abundance Calculated from the Absorption

Peak Ratio of A

x

to A

2959

based on the Maximum Peak.

Exposure

Time (hr) X=1736 X=1715 X=1697 X=2959 X=833

0 0.08 0.03 0.03 1.00 0.56

42 0.08 0.02 0.03 1.00 0.56

163 0.10 0.05 0.06 1.00 0.54

492 0.11 0.05 0.06 1.00 0.52

753 0.13 0.08 0.10 1.00 0.50

Numbers are calculated from numbers in parentheses in Table 3.

Figure 6. The change curves of the increment and reduction in each absorbtion frequency with the ozone exposure time based

on Table 4. Figure 7. 1

st

step : The formation of a zwitterion and an aldehyde.

(7)

being isolated. The oxygen-oxygen bond of an ozonide can break in two modes of (a) or (b) and produce an intermediate zwitterion and an aldehyde from (a) or a ketone from (b).

Generally, cleavage (a) is more favorable because carbon cat- ion bonded to methyl group is more stable than that con- nected to hydrogen.

21

Unstable carbon cation of zwitterion can be stabilized by electron donating group.

It was known that the intermediate could be stabilized in various ways. The zwitterion intermediate is stabilized by the formation of ozonide by recombination with carbonyl group, the formation of a polymerisable peroxide, and the formation of ester, lactone, anhydride, and carboxylic acid by rear- rangement of it.

8-14

The functional groups which can be formed in these ways are carbonyl group (-C=O), carbon- oxygen single bond (-C-O), and hydroxyl group (-OH).

However, in this research it was identified that the for- mation of ester, anhydride, and carboxylic acid, carbon-oxy- gen single bond, and hydroxyl group from intermediate was not observed on FT-IR spectra. Only ketone and aldehyde were observed. Thus, it was suggested that two ketones from two adjacent zwitterions were formed through dimeric per- oxide or open-chain peroxide as shown in Figure 8.

21

These two products decompose rapidly into ketone and O

2

. Finally, aldehydes and ketones were made from the double bond of NR by ozone through two-step mechanism.

Conclusions

The characterization of the ozone oxidation of raw NR thin film was investigated using Image analyzer and FT-IR spec- troscopy. The ozone oxidation was performed on thin film of raw NR coated on a KBr window in a dark chamber at 40

o

C under low humidity conditions to exclude thermal, moisture, or light oxidation.

After exposure to ozone, the image of thin film was iden-

tified to having a unique structure which was composed of a lot of dim cracks to one direction at constant intervals and more shiny on surfaces. This was considered as regular molecular rearrangement of raw NR thin film when coated on a KBr window. A number of cracks with one orientation showed the ridge and the valley, alternately. It was assumed that the ridge was composed of dimethylene (-CH

2

CH

2

-) having non-polar character and the valley was made up of the carbon-carbon double bond (-C=C-) containing polar one in NR backbone. In the valley region, consecutive chain scis- sion of double bond by ozone exposure seemed to be happen.

FT-IR absorption spectra of NR thin film with the ozone exposure time showed the increment of peak intensity at 1736, 1715, and 1697 cm

1

and the decrease of peak intensity at 833 cm

1

. Peaks at 1736 and 1715 cm

1

were assigned to an aldehyde group (-CHO) and a ketone group (-COR). A peak at 833 cm

1

was assigned to a cis-methine group (=C- H). The relative abundance with the ozone exposure time increases with an aldehyde group and a ketone group and decreases with a cis-methine group.

During ozone exposure period, the ozone oxidation of NR was initiated at the carbon-carbon double bond. Carbonyl compounds such as aldehydes or ketones were produced by consecutive chain scission. As a result, a lot of long thin cracks with the orientation at regular intervals were observed by image analysis.

One possible two-step mechanism for the formation of these products was suggested: the first step was the formation of aldehydes and zwitterions by nucleophilic addition reac- tion of the double bonds with ozone molecules. The second step was the formation of ketone through dimeric peroxide or open-chain peroxide from two adjacent zwitterions.

Acknowledgements

This work was supported by a grant from Aero Technology Research Institute (ATRI) of ROKAF. The authors would like to thank ATRI for supporting this research.

References

1. G. van Santvoort, “Geotextiles and Geomembranes in Civil Engineering”, p. 517-518, Roterdam, Netherlands: A.A.

Balkema, 1994.

2. J. S. Dick, “Rubber Technology: Compounding and Testing for Performance”, ed. by J. S. Dick, p. 64, Munich: Hanser;

Figure 8. 2

nd

step : The formation of ketone from two adjacent

zwitterions.

(8)

Cincinnati: Hanser Gardner, 2001.

3. K. Muniandy, H. ismail, and N. Othman, “Studies on Natural Weathering of Rattan Powder-filled Natural Rubber Compos- ites”, Bioresources, 7, 3 (2012).

4. F. Cataldo, O. Ursini, and G. Angelini, “Surface Oxidation of Rubber Crumb with Ozone”, Polymer Degradation and Sta- bility, 95, 5 (2010).

5. G. Zaikov, S. Rakovsky, and M. Anachkov, “Ozone and its Reaction with Diene Rubbers”, Rubber Chemistry and Chem- ical Technology, 6, 3 (2012).

6. Y. Ohtake, “Degradation of Vulcanised Rubber Products - Problems and Solutions (Degradation by Residual Chlorine in Tap Water, Metals and Ozone due to Deterioration in the Global Environment)”, International Polymer Science and Technology, 34, 4 (2007).

7. A. H. Eng, S. Kodama, K. Nagata, and H. Kawasaki, “Reac- tion of Moist Ozone with Natural Rubber: A Study by Atten- uated Total Reflectance Spectroscopy”, Journal of Rubber Research, 1, 3 (1998).

8. O. Lorenz and C. R. Parks, “Mechanism of Antiozonant Action. II. Effect of Antiozonants on the Ozonization of 2,6- dimethyl-2,6-octadiene and 2-butene”, Rubber Chemistry and Chemical Technology, 36, 1 (1963).

9. R. Criegee, “Peroxide Reaction Mechanisms”, p. 29, Inter- science publishers, New York, N.Y., 1962.

10. R. W. Keller, “Oxidation and Ozonation of Rubber”, Rubber Chemstry and Chemical Technology, 58, 3 (1985).

11. E. Schoenberg, H. A. Marsh, S. J. Walters, and W. M. Salt- man, “Polyisoprene”, Rubber Chemstry and Chemical Tech- nology, 52, 3 (1979).

12. F. H. A. Rodrigues, J. P. A. Feitosa, N. M. P. S. Ricardo, and R. C. M. De Paula, “Ozonation of Unstreched Natural Rub- ber: Part I. Effect of Film Thickness”, Rubber Chemistry and

Chemical Technology, 74, 1 (2001).

13. J. C. Ambelang, R. H. Kline, O. M. Lorenz, C. R. Parks, C.

Wadelin, and J. R. Shelton, “Antioxidants and Antiozonants for General Purpose Elastomers”, Rubber Chemistry and Chemical Technology, 36, 5 (1963).

14. J. C. Andries, D. B. Ross, and H. E. Diem, “Ozone Attack and Antiozonant Protection of Vulcanized Natural Rubber. A Sur- face Study by Attenuated Total Reflectance Spectroscopy”, Rubber Chemistry and Chemical Technology, 48, 1 (1975).

15. J. I. Cunneen, “Oxidative Aging of Natural Rubber”, Rubber Chemistry and Chemical Technology, 41, 182 (1968).

16. J. R. Purdon, “The Vanderbilt Rubber Handbook”, ed. by Robert F. Ohm, 13th Ed. p. 176, R. T. Vanderbilt Company, Inc., Norwalk 1990.

17. I.-S. Kim, B.-W. Lee, K.-S. Sohn, J. Yoon, and J.-H. Lee,

“Characterization of the UV Oxidation of Raw Natural Rub- ber Thin Film Using Image and FT-IR Analysis”, Elastomers and Composites, 51, 1 (2016).

18. M. J. Hackathorn and M. J. Brock, “The determination of

“Head-Head” and “Tail-Tail” Structures in Poly(isoprene)”, Rubber Chemistry and Chemical Technology, 45, 1295 (1972).

19. D. L. Pavia, G. M. Lampman, and G. S. Kriz, “Introduction to Spectroscopy: A Guide for Students of Organic Chemistry”, W. B. Saunders Co., Philadelphia, 1979.

20. S. Kodama, K. Nishi, and M. Furukawa, “Preparation of Low Molecular Weight Natural Rubber by Ozonolysis of High Ammonia Latex”, Journal of Rubber Research, 6, 3 (2003).

21. S. Fliszar and M. granger, “A Quantitative Investigation of

the Ozonolysis Reaction. VII. On the Direction of Cleavage

of Pprimary Ozonides of Sselected Unsymmetrical Olefines”,

Journal of the American Chemical Society, 91, 12 (1969).

수치

Figure 1 shows images for a transparent raw NR thin film coated  on  a  KBr  window  (a)  at  a  rectangular  angle  before ozone exposure and (b) at a tilted angle after ozone exposure of 753 hours
Figure 2. Magnification image of the  ozone oxidation at a  tilted angle  for  the  same  sample  shown  in  Figure  1(b).
Figure 4. FT-IR absorption spectra for a transparent thin film of raw NR with the ozone exposure time ranging (a) from 2600 to 3600 cm 1 ,  (b)  from  1600  to  1800  cm 1 ,  and  (c)  from  700  to  1400  cm 1  in  a  dark  at  40 o C.
Table  3.  The  Peak  Height  in  each  FT-IR  Absorption  according  to  the  Ozone  Exposure  Time  based  on  Figure  4.
+3

참조

관련 문서

Analysis for Thermal Test Assessment Method of Spent Fuel Concrete Cask Using a Scale Down Model Ju - Chan Lee , Kyung - Sik Bang , Seung - Hwan Yu , and Woo - Seok Choi ( KAERI

Analysis for Thermal Test Assessment Method of Spent Fuel Concrete Cask Using a Scale Down Model Ju - Chan Lee , Kyung - Sik Bang , Seung - Hwan Yu , and Woo - Seok Choi ( KAERI

In this study, surface characterization of Mg-doped hydroxyapatite coatings on Ti-25Ta-xHf alloys after plasma electrolytic oxidation(PEO) for dental implants

Polymer materials of EQ cables for Yonggwang Unit 1&2 were analyzed using FT-IR (Fourier Transform Infrared Spectroscopy), TGA (Thermo-Gravimetric Analysis), and

Taubin, “The QBIC Project: Querying Image by Content using Color, Texture and Shape,” Proceedings of SPIE Storage and Retrieval for Image and Video Databases, pp.. Pala,

Dong Won Lee, Young Dug Bae, Suk Kwon Kim, Hee Yun Shin, Bong Guen Hong, Hyun Kyu Jung, Yang Il Jung, Jeong Yong Park, Byung Kwon Choi, and Yong Hwan Jeong(KAERI). P07B04

P01B24 Preliminary Drop Time Analysis of a Control Rod Using CFD Code Myoung Hwan Choi, Jin Seok Park, and Won Jae Lee(KAERI)..

P04D06 Microstructure Analysis on Beryllium Reflector Blocks of Research Reactors Suk Hoon Kang, Jinsung Jang, Yong-Hwan Jeong, Chang-Hee Han, Yang-Il Jung, and Tae Kyu