RESEARCH ARTICLE
Tacrolimus trough levels higher than 6 ng/mL
might not be required after a year in stable
kidney transplant recipients
Hee-Yeon Jung1☯, Min Young Seo2☯, Yena Jeon3, Kyu Ha Huh4, Jae Berm ParkID5, Cheol Woong Jung6, Sik Lee7, Seung-Yeup Han8, Han Ro9, Jaeseok Yang10, Curie Ahn11, Ji-Young Choi1, Jang-Hee Cho1, Sun-Hee Park1, Yong-Lim Kim1, Chan-Duck KimID1*
1 Department of Internal Medicine, School of Medicine, Kyungpook National University, Kyungpook National
University Hospital, Daegu, South Korea, 2 Department of Internal Medicine, Pohang St. Mary’s Hospital, Pohang, South Korea, 3 Department of Statistics, Kyungpook National University, Daegu, South Korea,
4 Department of Surgery, Yonsei University College of Medicine, Seoul, South Korea, 5 Department of
Surgery, Sungkyunkwan University, Seoul Samsung Medical Center, Seoul, South Korea, 6 Department of Surgery, Korea University College of Medicine, Seoul, South Korea, 7 Department of Internal Medicine, Chonbuk National University Hospital, Jeonju, South Korea, 8 Department of Internal Medicine, Keimyung University, Dongsan Medical Center, Daegu, South Korea, 9 Department of Internal Medicine, Gachon University, Gil Hospital, Incheon, South Korea, 10 Department of Surgery, Seoul National University College of Medicine, Seoul, South Korea, 11 Department of Internal Medicine, Seoul National University College of Medicine, Seoul, South Korea
☯These authors contributed equally to this work.
Abstract
Background
Little is known regarding optimal tacrolimus (TAC) trough levels after 1 year post-transplant in stable kidney transplant recipients (KTRs) who have not experienced renal or cardiovas-cular outcomes. This study aimed to investigate the effect of 1-year post-transplant TAC trough levels on long-term renal and cardiovascular outcomes and opportunistic infections in stable KTRs.
Methods
KTRs receiving TAC with mycophenolate-based immunosuppression who did not experi-ence renal or cardiovascular outcomes within 1 year post-transplant were enrolled from a multicenter observational cohort study. Renal outcome was defined as a composite of biopsy-proven acute rejection, interstitial fibrosis and tubular atrophy, and death-censored graft loss. Cardiovascular outcome was defined as a composite of de novo cardiomegaly, left ventricular hypertrophy, and cardiovascular events. Opportunistic infections were defined as the occurrence of BK virus or cytomegalovirus infections.
Results
A total of 603 eligible KTRs were divided into the low-level TAC (LL-TAC) and high-level TAC (HL-TAC) groups based on a median TAC level of 5.9 ng/mL (range 1.3–14.3) at 1 a1111111111 a1111111111 a1111111111 a1111111111 a1111111111 OPEN ACCESS
Citation: Jung H-Y, Seo MY, Jeon Y, Huh KH, Park
JB, Jung CW, et al. (2020) Tacrolimus trough levels higher than 6 ng/mL might not be required after a year in stable kidney transplant recipients. PLoS ONE 15(7): e0235418.https://doi.org/ 10.1371/journal.pone.0235418
Editor: Tatsuo Shimosawa, International University
of Health and Welfare, School of Medicine, JAPAN
Received: May 11, 2020 Accepted: June 15, 2020 Published: July 2, 2020
Copyright:© 2020 Jung et al. This is an open access article distributed under the terms of the Creative Commons Attribution License, which permits unrestricted use, distribution, and reproduction in any medium, provided the original author and source are credited.
Data Availability Statement: All relevant data are
within the paper and its Supporting Information files.
Funding: This research was supported by the
Research Program funded by the Korea Centers for Disease Control and Prevention (No.
2012E3301100, 2013E3301600, 2013E3301601, 2013E3301602, 2016E3300200, 2016E3300201, 2016E3300202, and 2019E320100) to CA and by a grant from the Korea Health Technology R&D Project through the Korea Health Industry
year post-transplant. The HL-TAC group had significantly higher TAC trough levels at 2, 3, 4, and 5 years compared with the levels of the LL-TAC group. During the mean follow-up of 63.7±13.0 months, there were 121 renal outcomes and 224 cardiovascular outcomes. In multivariate Cox regression analysis, LL-TAC and HL-TAC were not independent risk fac-tors for renal and cardiovascular outcomes, respectively. No significant differences in the development of opportunistic infections and de novo donor-specific anti-human leukocyte antigen antibodies and renal allograft function were observed between the two groups.
Conclusions
TAC trough levels after 1 year post-transplant remained at a similar level until the fifth year after kidney transplantation and were not directly associated with long-term outcomes in sta-ble Korean KTRs who did not experience renal or cardiovascular outcomes. Therefore, in Asian KTRs with a stable clinical course, TAC trough levels higher than approximately 6 ng/ mL might not be required after a year of kidney transplantation.
Introduction
Underdosing of tacrolimus (TAC) in kidney transplant recipients (KTRs) can lead to biopsy-proven acute rejection (BPAR) and immunologic sensitization; however, overdosing of TAC can result in calcineurin inhibitor (CNI) toxicity and opportunistic infections including BK virus and cytomegalovirus (CMV) infections, which have detrimental effects on renal allograft outcomes [1–5]. Furthermore, CNI exposure can increase the risk of new-onset diabetes melli-tus, hypertension, and lipid dysregulation, which are considered as potential risk factors for cardiovascular disease [6]. Therefore, the maintenance of optimal TAC trough levels is crucial to improve transplant outcomes.
Optimal TAC trough levels may be different according to the post-transplant period. Previ-ous studies have reported an association between TAC trough levels within 1 year post-trans-plant and kidney transpost-trans-plantation outcomes [7–20]. The Kidney Disease: Improving Global Outcomes guidelines suggest that 5–15 ng/mL of TAC trough levels should be maintained dur-ing the first 2–4 months post-transplant and then reduced in stable KTRs to minimize toxicity, with a low quality of evidence [21]. However, little is known regarding optimal TAC trough levels after 1 year post-transplant in stable KTRs who have not experienced renal or cardiovas-cular outcomes. Furthermore, since ethnicity can affect tacrolimus pharmacokinetics [22], it is crucial to determine the optimal TAC trough levels in Asian KTRs.
This study aimed to investigate the effect of 1-year post-transplant TAC trough levels on renal and cardiovascular outcomes in stable Korean KTRs who did not experience renal or car-diovascular outcomes within 1 year post-transplant.
Materials and methods
Participants
De novo KTRs were enrolled from the Korean Cohort Study for Outcome in Patients with
Kid-ney Transplantation (KNOW-KT) between 2012 and 2016 and followed up until 2019. Out of 1,080 KTRs, we included 707 KTRs receiving TAC with mycophenolate-based immunosup-pression at 1 year. Overall, 101 KTRs who experienced renal or cardiovascular outcomes within 1 year post-transplant (renal = 94, cardiovascular = 33, both = 26), 1 patient with TAC
Development Institute, which is funded by the Ministry of Health & Welfare, Republic of Korea (No. HI13C1232) to CDK. The funders had no role in study design, data collection and analysis, decision to publish, or preparation of the manuscript.
Competing interests: The authors have declared
trough levels > 20 ng/mL, and 2 patients with insufficient information were excluded. As a result, 603 KTRs were included in this study. The Institutional Review Committee of each par-ticipating center approved the KNOW-KT study protocol [Chonbuk National University Hos-pital; Gachon University Gil Medical Center; Keimyung University Dongsan HosHos-pital; Korea University Anam Hospital; Kyungpook National University Hospital; Samsung Medical Cen-ter, Seoul; Seoul National University Hospital; Yonsei University, Severance Hospital (in alphabetical order)] [23]. All patients provided their written informed consent before partici-pating in the study. All clinical investigations were conducted in accordance with the guide-lines of the 2008 Declaration of Helsinki.
Variables
TAC trough levels and TAC dosages were recorded at 1 year and annually thereafter. TAC trough levels and TAC dosages were determined by the physicians’ clinical judgment. Eligible KTRs were divided into the low-level TAC (LL-TAC) and high-level TAC (HL-TAC) groups based on a median TAC level of 5.9 ng/mL (range 1.3–14.3) at 1 year post-transplant.
Possible confounders for renal composite endpoints included TAC trough level, TAC dos-age, dos-age, sex, body mass index (BMI), number of human leukocyte antigen (HLA) mismatches, type of transplant donor, re-transplantation, and desensitization. Possible confounders for car-diovascular composite endpoints included TAC trough levels, TAC dosage, age, sex, BMI, pri-mary kidney disease, dialysis duration, smoking, total cholesterol, high-density lipoprotein (HDL), and systolic blood pressure (BP).
Information on de novo donor-specific anti-HLA antibodies (DSAs) was obtained at base-line, 1 year, and 5 years post-transplant and when clinically indicated.
Outcomes
Renal outcome was defined as a composite of BPAR, interstitial fibrosis and tubular atrophy (IFTA), and death-censored graft loss after 1 year post-transplant. IFTA grade I, II, and III were included. Cardiovascular outcome was defined as a composite of de novo cardiomegaly on chest X-ray, left ventricular hypertrophy on electrocardiogram, and cardiovascular events after 1 year post-transplant. Chest X-ray and electrocardiogram were performed at baseline and annual visits. Cardiomegaly on chest X-ray was defined as cardiothoracic ratio > 50%. Cardiovascular events were defined as myocardial infarction, unstable angina, percutaneous coronary intervention, coronary artery bypass grafting, or stroke. The development of de novo DSAs and estimated glomerular filtration rates (eGFRs) were compared between the two groups.
Opportunistic infections were defined as the occurrence of BK virus or CMV infections. BK virus infection was defined as an occurrence of BK viremia (� 104copies/mL) or diag-nosed biopsy-proven BK virus nephropathy. CMV infection was defined as a presence of sig-nificant positive CMV polymerase chain reaction or diagnosed CMV disease.
Statistical analysis
Continuous variables are expressed as the mean± standard deviation for normally distributed data and as the median with range when the values were not normally distributed. Differences between the groups were assessed by independent samplet-tests and chi-squared tests as
appropriate. The Cox regression model was used to analyze the factors associated with the development of renal and cardiovascular outcomes and opportunistic infections. The cumula-tive incidences of renal and cardiovascular outcomes were analyzed according to TAC trough levels using the Kaplan-Meier method. Statistical analysis was performed using the SAS system
for Windows, version 9.2 (SAS Institute Inc., Cary, NC). P values < 0.05 were considered sta-tistically significant.
Results
Baseline characteristics
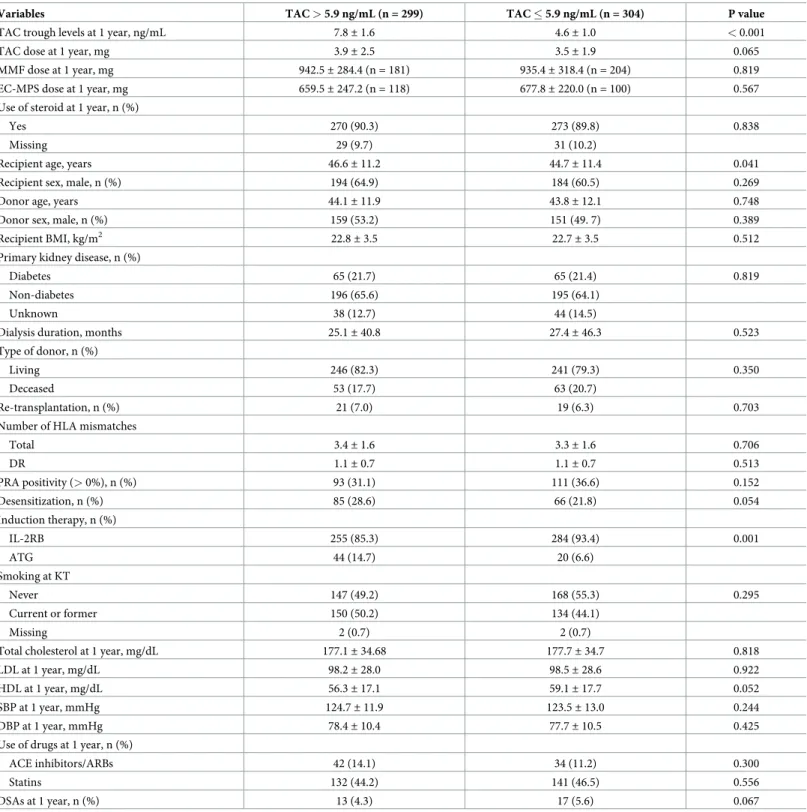
Table 1shows the baseline characteristics according to a median TAC level of 5.9 ng/mL at 1 year post-transplant. The mean TAC trough levels were 7.8± 1.6 and 4.6 ± 1.0 ng/mL in KTRs with HL-TAC and LL-TAC, respectively. In comparison with patients with HL-TAC, those with LL-TAC were significantly younger (46.6± 11.2 vs. 44.7 ± 11.4 years, P = 0.041) and received less anti-thymocyte globulin as induction therapy (14.7 vs. 6.6%, P = 0.001). There were no significant differences in TAC dose, mycophenolic acid dose, the use of steroid, recipi-ent sex, donor age, donor sex, BMI, primary kidney disease, dialysis duration, type of trans-plant donor, re-transtrans-plantation, number of HLA mismatches, panel reactive antibody positivity, desensitization, smoking, lipid profile, BP, the use of angiotensin-converting enzyme inhibitors, angiotensin II receptor blockers, and statins, DSAs at 1 year, and eGFR at 1 year.
TAC trough levels and renal outcomes
Patients with HL-TAC at 1 year had significantly higher TAC trough levels at 2 years (6.4± 5.2 vs. 5.2± 1.8 ng/mL, P < 0.001), 3 years (6.0 ± 1.9 vs. 5.2 ± 1.8 ng/mL, P < 0.001), 4 years (6.1± 2.1 vs. 5.1 ± 1.7 ng/mL, P < 0.001), and 5 years (5.9 ± 5.3 vs. 5.3 ± 2.1 ng/mL, P < 0.001) compared with the levels of patients with LL-TAC (Fig 1).
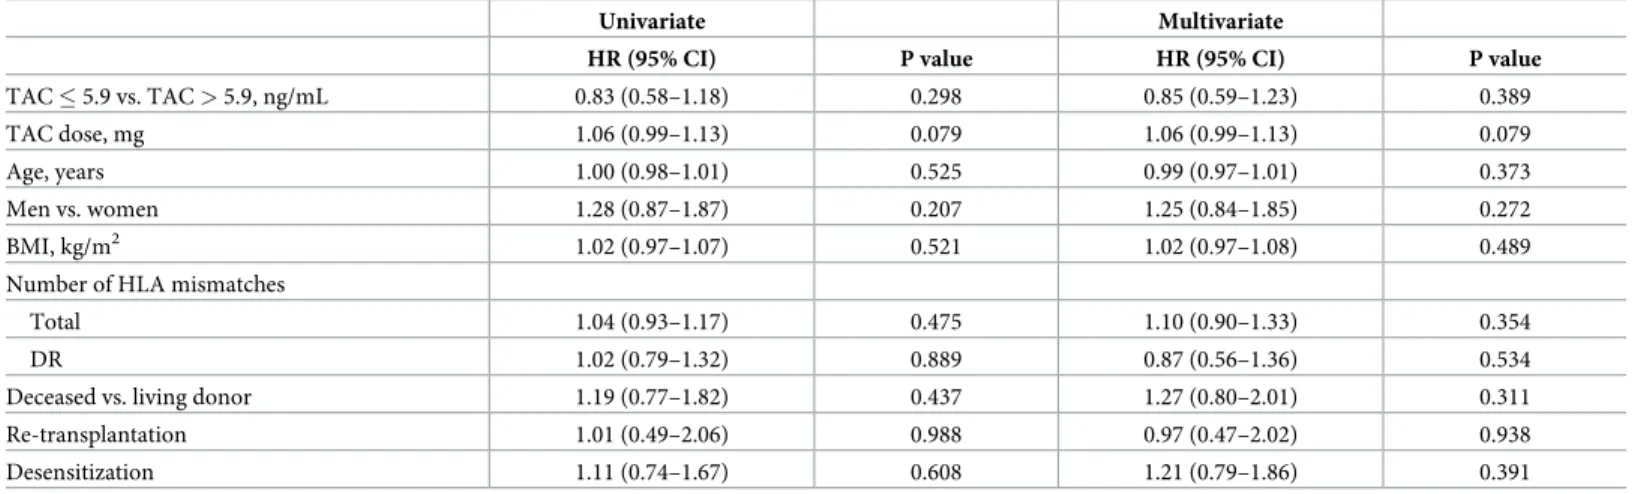
During the mean follow-up of 63.7± 13.0 months, 121 renal outcomes occurred after 1 year post-transplant. Detailed information on renal outcomes is presented inS1 Table. Univar-iate and multivarUnivar-iate Cox regression analysis demonstrated that TAC trough levels, TAC dose, age, sex, BMI, number of HLA mismatches, re-transplantation, and desensitization were not significantly associated with renal composite endpoints (Table 2).
Multivariate Cox regression analysis for BPRA or IFTA are shown inS2 Table. TAC trough levels were not significantly associated with both BPRA and IFTA.
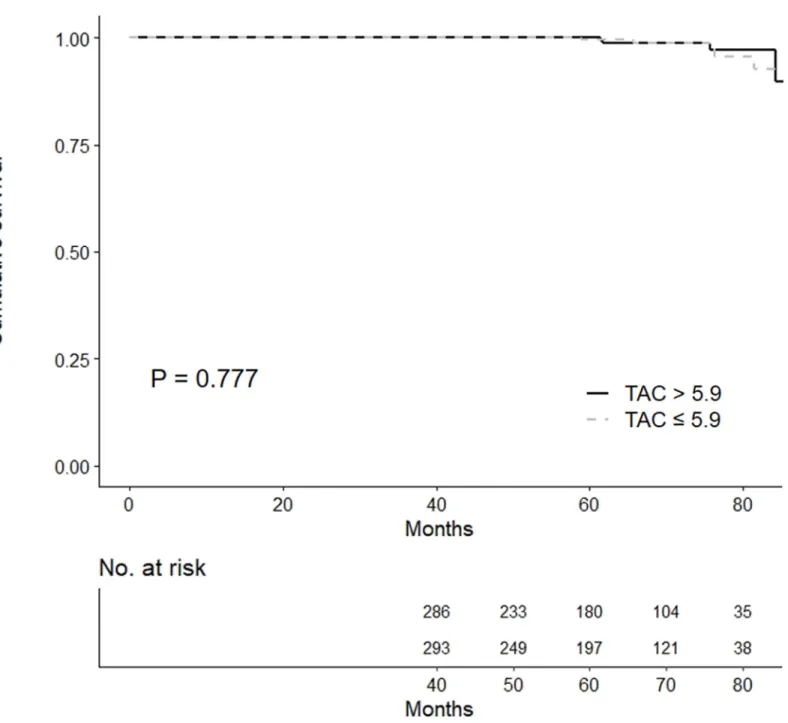
Kaplan-Meier analysis showed that there was no significant difference in the development
of renal outcomes between the HL-TAC and LL-TAC groups (Fig 2A).
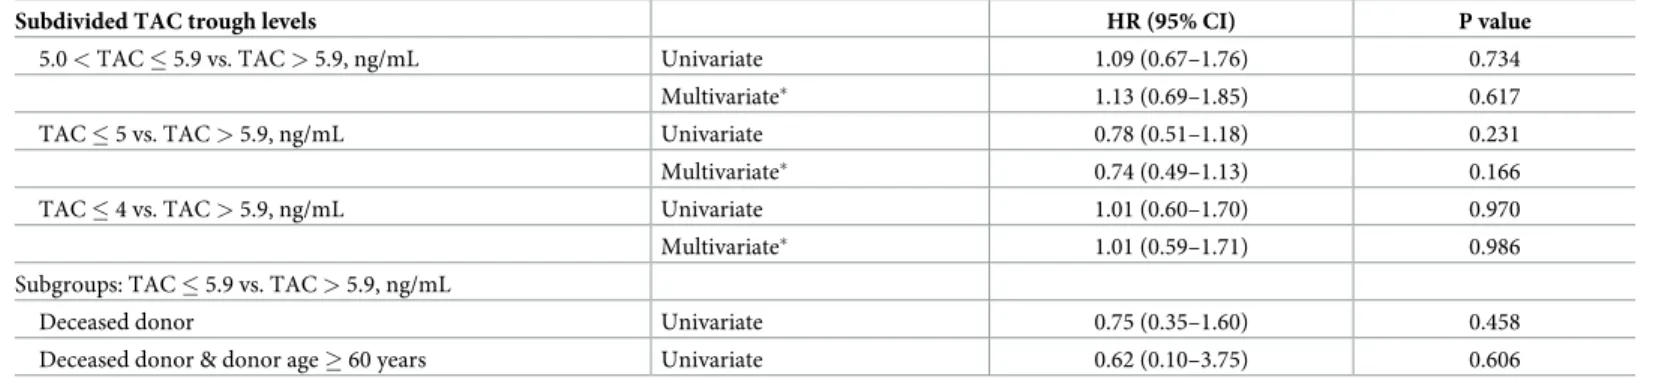
TAC trough levels of 5.0–5.9, � 5, and � 4 ng/mL compared with > 5.9 ng/mL were not asso-ciated with renal composite endpoints even after adjusting for TAC dose, age, sex, BMI, number of HLA mismatches, type of transplant donor, re-transplantation, and desensitization (Table 3). Subgroup analysis including deceased donor and deceased donor with donor age � 60 revealed that renal outcome was not associated with LL-TAC compared with HL-TAC.
TAC trough levels and cardiovascular outcomes
A total of 224 cardiovascular outcomes were observed during the follow-up. Detailed informa-tion on cardiovascular outcomes is presented inS1 Table. Univariate and multivariate Cox regression analysis demonstrated that TAC trough levels, TAC dose, age, sex, BMI, primary kidney disease, smoking, serum total cholesterol, HDL, and systolic BP were not significantly associated with cardiovascular composite endpoints (Table 4). Multivariate Cox regression analysis showed that dialysis duration was an independent predictor of the development of cardiovascular outcomes (HR = 1.01, 95% CI 1.00–1.01, P < 0.001).
No significant difference in the development of cardiovascular outcomes between the
Table 1. Baseline characteristics.
Variables TAC > 5.9 ng/mL (n = 299) TAC � 5.9 ng/mL (n = 304) P value
TAC trough levels at 1 year, ng/mL 7.8± 1.6 4.6± 1.0 < 0.001
TAC dose at 1 year, mg 3.9± 2.5 3.5± 1.9 0.065
MMF dose at 1 year, mg 942.5± 284.4 (n = 181) 935.4± 318.4 (n = 204) 0.819
EC-MPS dose at 1 year, mg 659.5± 247.2 (n = 118) 677.8± 220.0 (n = 100) 0.567
Use of steroid at 1 year, n (%)
Yes 270 (90.3) 273 (89.8) 0.838
Missing 29 (9.7) 31 (10.2)
Recipient age, years 46.6± 11.2 44.7± 11.4 0.041
Recipient sex, male, n (%) 194 (64.9) 184 (60.5) 0.269
Donor age, years 44.1± 11.9 43.8± 12.1 0.748
Donor sex, male, n (%) 159 (53.2) 151 (49. 7) 0.389
Recipient BMI, kg/m2 22.8
± 3.5 22.7± 3.5 0.512
Primary kidney disease, n (%)
Diabetes 65 (21.7) 65 (21.4) 0.819
Non-diabetes 196 (65.6) 195 (64.1)
Unknown 38 (12.7) 44 (14.5)
Dialysis duration, months 25.1± 40.8 27.4± 46.3 0.523
Type of donor, n (%)
Living 246 (82.3) 241 (79.3) 0.350
Deceased 53 (17.7) 63 (20.7)
Re-transplantation, n (%) 21 (7.0) 19 (6.3) 0.703
Number of HLA mismatches
Total 3.4± 1.6 3.3± 1.6 0.706 DR 1.1± 0.7 1.1± 0.7 0.513 PRA positivity (> 0%), n (%) 93 (31.1) 111 (36.6) 0.152 Desensitization, n (%) 85 (28.6) 66 (21.8) 0.054 Induction therapy, n (%) IL-2RB 255 (85.3) 284 (93.4) 0.001 ATG 44 (14.7) 20 (6.6) Smoking at KT Never 147 (49.2) 168 (55.3) 0.295 Current or former 150 (50.2) 134 (44.1) Missing 2 (0.7) 2 (0.7)
Total cholesterol at 1 year, mg/dL 177.1± 34.68 177.7± 34.7 0.818
LDL at 1 year, mg/dL 98.2± 28.0 98.5± 28.6 0.922
HDL at 1 year, mg/dL 56.3± 17.1 59.1± 17.7 0.052
SBP at 1 year, mmHg 124.7± 11.9 123.5± 13.0 0.244
DBP at 1 year, mmHg 78.4± 10.4 77.7± 10.5 0.425
Use of drugs at 1 year, n (%)
ACE inhibitors/ARBs 42 (14.1) 34 (11.2) 0.300
Statins 132 (44.2) 141 (46.5) 0.556
DSAs at 1 year, n (%) 13 (4.3) 17 (5.6) 0.067
Values are shown as the mean± standard deviation (range) or number (%).
Abbreviations: ACE, angiotensin-converting enzyme; ARBs, angiotensin II receptor blockers; ATG; anti-thymocyte globulin; BMI, body mass index; DBP, diastolic blood pressure; DSA, donor-specific anti-human leukocyte antigen antibodies; EC-MPS, enteric-coated mycophenolate sodium; HDL, high-density lipoprotein; HLA, human leukocyte antigen; IL-2RB, interleukin-2 receptor blocker; KT, kidney transplantation; LDL, low-density lipoprotein; MMF, mycophenolate mofetil; PRA, panel reactive antibody; SBP, systolic blood pressure; TAC, tacrolimus.
TAC trough levels and opportunistic infections
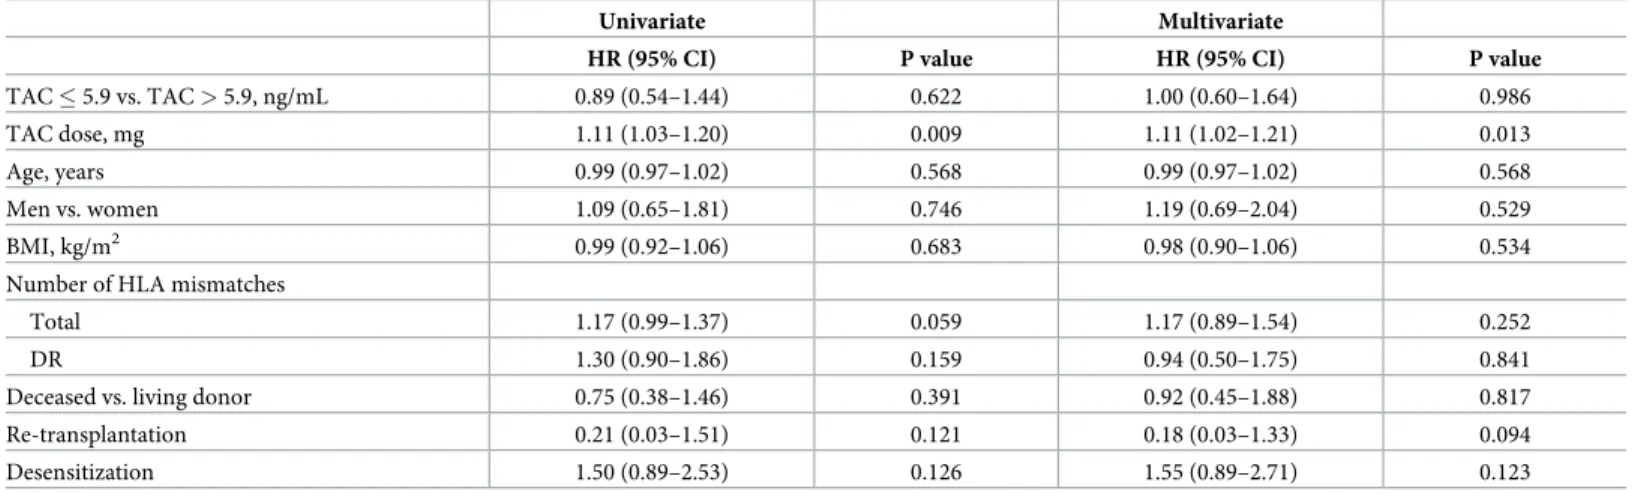
During the follow-up, 5 BK virus infections and 60 CMV infections occurred after 1 year post-transplant. Univariate and multivariate Cox regression analysis demonstrated that TAC trough levels, age, sex, BMI, number of HLA mismatches, re-transplantation, and desensitization were not significantly associated with opportunistic infections (Table 5). TAC dose was an independent risk factor for the development of opportunistic infections.
TAC trough levels, de novo DSAs, and renal allograft function
No significant difference in the development of de novo DSAs between the HL-TAC and LL-TAC groups was observed in the Kaplan-Meier plot (Fig 3).
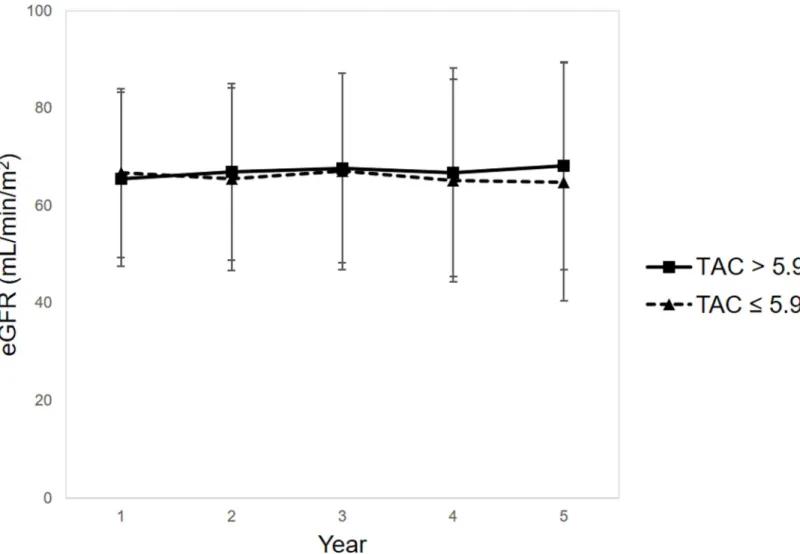
There were no significant differences in eGFRs at 2 years (67.0± 18.1 vs. 65.5 ± 18.8 mL/ min/1.73 m2, P = 0.648), 3 years (67.8± 19.4 vs. 67.1 ± 20.2 mL/min/1.73 m2, P = 0.662), 4
Fig 1. TAC trough levels at 2, 3, 4, and 5 years post-transplant. Patients with HL-TAC at 1 year had significantly higher TAC trough levels at 2 years (6.4± 5.2 vs. 5.2± 1.8 ng/mL, P < 0.001), 3 years (6.0 ± 1.9 vs. 5.2 ± 1.8 ng/mL, P < 0.001), 4 years (6.1 ± 2.1 vs. 5.1 ± 1.7 ng/mL, P < 0.001), and 5 years (5.9 ± 5.3 vs. 5.3 ± 2.1 ng/mL, P < 0.001) compared with the levels of patients with LL-TAC.�P < 0.001. Abbreviations: LL, low-level; HL, high-level; TAC, tacrolimus.
years (66.9± 21.4 vs. 65.2 ± 20.8 mL/min/1.73 m2, P = 0.417), and 5 years (68.3± 21.3 vs. 64.9± 24.4 mL/min/1.73 m2, P = 0.273) between the HL-TAC and LL-TAC groups (Fig 4).
Discussion
In this multicenter cohort study, TAC trough levels after 1 year post-transplant remained at a similar level until the fifth year after kidney transplantation. No significant association was
Table 2. Univariate and multivariate Cox regression analysis for renal composite endpoints.
Univariate Multivariate
HR (95% CI) P value HR (95% CI) P value
TAC � 5.9 vs. TAC > 5.9, ng/mL 0.83 (0.58–1.18) 0.298 0.85 (0.59–1.23) 0.389
TAC dose, mg 1.06 (0.99–1.13) 0.079 1.06 (0.99–1.13) 0.079
Age, years 1.00 (0.98–1.01) 0.525 0.99 (0.97–1.01) 0.373
Men vs. women 1.28 (0.87–1.87) 0.207 1.25 (0.84–1.85) 0.272
BMI, kg/m2 1.02 (0.97–1.07) 0.521 1.02 (0.97–1.08) 0.489
Number of HLA mismatches
Total 1.04 (0.93–1.17) 0.475 1.10 (0.90–1.33) 0.354
DR 1.02 (0.79–1.32) 0.889 0.87 (0.56–1.36) 0.534
Deceased vs. living donor 1.19 (0.77–1.82) 0.437 1.27 (0.80–2.01) 0.311
Re-transplantation 1.01 (0.49–2.06) 0.988 0.97 (0.47–2.02) 0.938
Desensitization 1.11 (0.74–1.67) 0.608 1.21 (0.79–1.86) 0.391
Abbreviations: BMI, body mass index; CI, confidence interval; HLA, human leukocyte antigen; HR, hazards ratio; TAC, tacrolimus. https://doi.org/10.1371/journal.pone.0235418.t002
Fig 2. Cumulative incidence of (A) renal composite endpoints and (B) cardiovascular composite endpoints according to TAC trough levels. No significant differences in
the development of renal and cardiovascular outcomes between the HL-TAC and LL-TAC groups were observed in the Kaplan-Meier plot. Abbreviations: LL, low-level; HL, high-level; TAC, tacrolimus.
found between 1-year post-transplant TAC trough levels and long-term renal and cardiovascu-lar outcomes and opportunistic infections in stable Korean KTRs who did not experience renal and cardiovascular outcomes within 1 year post-transplant. Furthermore, TAC trough levels of > 5.9 ng/mL compared with � 5, 5.0–5.9, and � 5.9 ng/mL did not show any benefits in terms of outcomes as well as the development of de novo DSAs and renal allograft function. Subgroup analysis including deceased donor or deceased donor with donor age � 60 also showed consistent results.
There are limited data on stable KTRs, especially in the Asian population, who have not experienced any outcomes including rejection in the first year following kidney
Table 3. Univariate and multivariate Cox regression analysis for renal composite endpoints in subgroups.
Subdivided TAC trough levels HR (95% CI) P value
5.0 < TAC � 5.9 vs. TAC > 5.9, ng/mL Univariate 1.09 (0.67–1.76) 0.734
Multivariate� 1.13 (0.69–1.85) 0.617
TAC � 5 vs. TAC > 5.9, ng/mL Univariate 0.78 (0.51–1.18) 0.231
Multivariate� 0.74 (0.49–1.13) 0.166
TAC � 4 vs. TAC > 5.9, ng/mL Univariate 1.01 (0.60–1.70) 0.970
Multivariate� 1.01 (0.59–1.71) 0.986
Subgroups: TAC � 5.9 vs. TAC > 5.9, ng/mL
Deceased donor Univariate 0.75 (0.35–1.60) 0.458
Deceased donor & donor age � 60 years Univariate 0.62 (0.10–3.75) 0.606
Abbreviations: CI, confidence interval; HR, hazards ratio; TAC, tacrolimus.
�Adjusted for TAC dose, age, sex, BMI, number of HLA mismatches, type of transplant donor, re-transplantation, desensitization, and induction therapy. https://doi.org/10.1371/journal.pone.0235418.t003
Table 4. Univariate and multivariate Cox regression analysis for cardiovascular composite endpoints.
Univariate Multivariate
HR (95% CI) P value HR (95% CI) P value
TAC > 5.9 vs. TAC � 5.9, ng/mL 0.80 (0.62–1.04) 0.102 0.76 (0.58–1.01) 0.055
TAC dose, mg 0.99 (0.93–1.05) 0.642 0.99 (0.93–1.05) 0.658
Age, years 1.01 (1.00–1.02) 0.171 1.01 (0.99–1.02) 0.270
Men vs. women 1.46 (1.10–1.94) 0.010 1.31 (0.90–1.90) 0.161
BMI, kg/m2 1.02 (0.98–1.05) 0.420 0.98 (0.94–1.03) 0.475
Primary kidney disease
Diabetes 1.15 (0.83–1.59) 0.397 1.08 (0.76–1.53) 0.656
Non-diabetes Reference Reference
Unknown 1.35 (0.94–1.93) 0.107 1.61 (0.80–1.69) 0.437
Dialysis duration, months 1.01 (1.00–1.01) < 0.001 1.01 (1.00–1.01) < 0.001
Smoking at KT
Never Reference Reference
Current or former 1.28 (0.98–1.66) 0.071 1.07 (0.77–1.48) 0.694
Missing 2.34 (0.58–9.48) 0.235 1.79 (0.24–13.61) 0.573
Total cholesterol at 1 year, mg/dL 1.00 (1.00–1.01) 0.314 1.00 (1.00–1.01) 0.103
HDL at 1 year, mg/dL 1.00 (0.99–1.00) 0.360 1.00 (0.99–1.01) 0.530
SBP at 1 year, mmHg 1.01 (1.00–1.02) 0.086 1.01 (1.00–1.02) 0.119
Abbreviations: BMI, body mass index; CI, confidence interval; HDL, high-density lipoprotein; HR, hazards ratio; KT, kidney transplantation; SBP, systolic blood pressure; TAC, tacrolimus.
transplantation. In this study, TAC trough levels higher than approximately 6 ng/mL did not exhibit any beneficial effect on reducing renal outcomes including the development of de novo DSAs in stable KTRs. Although an existing large-scale study reported TAC trough levels > 5 ng/mL after 1 year post-transplant as optimal for preventing the development of de novo DSAs, the study differed considerably from this study in that it included all patients who expe-rienced BPAR within a year after kidney transplantation [19]. As BPAR itself can affect trans-plant outcomes and the target range of TAC trough levels, this study excluded those with clinical events within 1 year. Furthermore, TAC trough levels < 5 ng/mL in patients with low HLA alloimmune response did not increase the risk of de novo DSA development, indicating that not all KTRs may have a standard TAC trough level target of above 5 ng/mL [19]. There-fore, the TAC trough level target should be adjusted based on previous BPAR history as well as the individual’s alloimmune risk.
CNIs have been reported to cause dyslipidemia and vascular calcification dose-dependently, and these conditions may increase cardiovascular outcomes [6]. However, the reduction of cardiovascular outcomes by optimal TAC trough levels has not been investigated. Contrary to our expectations, high TAC trough levels did not increase the risk of cardiovascular outcomes in this study. Instead, pretransplant dialysis duration was an independent risk factor for car-diovascular outcomes even after adjusting for Framingham risk factors. The result of the pres-ent study is consistpres-ent with that of a previous study, which reported pretransplant dialysis duration as an independent predictor of patient death resulting from cardiovascular diseases [24]. The pathogenesis may be attributed to the rapid progression of cardiovascular changes including vascular calcification and left ventricular hypertrophy [25], increased inflammation [26], and changes in concentrations of advanced glycosylation end products [27].
This study has some limitations. First, this study was not a randomized controlled study but an observational study. The results of our study are not completely unaffected by the physi-cian’s strategies and clinical circumstances of KTRs. Second, as the TAC trough level involved a single drug concentration, there may be a lack of representation. However, KTRs with HL-TAC at 1 year post-transplant also had significantly higher TAC trough levels until 5 years post-transplant. The sustained higher or lower TAC trough levels for the following 5 years may be explained by individual genetic predispositions, as reported in previous studies about the association between cytochromeP450(CYP)3A5 gene polymorphisms, the dose
Table 5. Univariate and multivariate Cox regression analysis for opportunistic infections.
Univariate Multivariate
HR (95% CI) P value HR (95% CI) P value
TAC � 5.9 vs. TAC > 5.9, ng/mL 0.89 (0.54–1.44) 0.622 1.00 (0.60–1.64) 0.986
TAC dose, mg 1.11 (1.03–1.20) 0.009 1.11 (1.02–1.21) 0.013
Age, years 0.99 (0.97–1.02) 0.568 0.99 (0.97–1.02) 0.568
Men vs. women 1.09 (0.65–1.81) 0.746 1.19 (0.69–2.04) 0.529
BMI, kg/m2 0.99 (0.92–1.06) 0.683 0.98 (0.90–1.06) 0.534
Number of HLA mismatches
Total 1.17 (0.99–1.37) 0.059 1.17 (0.89–1.54) 0.252
DR 1.30 (0.90–1.86) 0.159 0.94 (0.50–1.75) 0.841
Deceased vs. living donor 0.75 (0.38–1.46) 0.391 0.92 (0.45–1.88) 0.817
Re-transplantation 0.21 (0.03–1.51) 0.121 0.18 (0.03–1.33) 0.094
Desensitization 1.50 (0.89–2.53) 0.126 1.55 (0.89–2.71) 0.123
Abbreviations: BMI, body mass index; CI, confidence interval; HLA, human leukocyte antigen; HR, hazards ratio; TAC, tacrolimus. https://doi.org/10.1371/journal.pone.0235418.t005
requirement of TAC, and TAC trough levels [28–30]. CYP3A5 is the major enzyme responsi-ble for the metabolisms TAC. The CYP3A5 genetic polymorphisms can affect the pharmacoki-netics of TAC and contribute to the interindividual variability of TAC trough levels. Previous studies reported that CYP3A5 genotype is associated with dose-adjusted level of TAC and
complications among Korean KTRs [30,31]. Although no information on CYP3A5 gene
poly-morphism has been obtained from the current study, further studies regarding the genotype-guided TAC dosage control will ultimately be necessary to achieve individual optimized TAC
Fig 3. Development of de novo DSAs after 1 year post-transplant according to TAC trough levels. No significant difference in de novo DSA development between the
HL-TAC and LL-TAC groups was observed in the Kaplan-Meier plot. Abbreviations: DSA, donor-specific anti-HLA antibody; LL, low-level; HL, high-level; TAC, tacrolimus.
trough levels and achieve the optimal transplant outcomes. Third, there are no data on the presence of proteinuria over time, which may have yielded more useful information for the evaluation of recurrent or newly occurring glomerulonephritis after kidney transplantation which are a frequent cause of allograft loss at 10 years [32]. Despite these limitations, this study could provide Asian clinicians with some guidance about TAC trough levels after 1 year post-transplant because it included an Asian population, in contrast to prior studies that included Caucasian, African American, and Hispanic populations. Furthermore, the results of this study are clinically significant, demonstrating that stable KTRs who have never experienced renal or cardiovascular outcomes make up the largest number of patients in clinical practice. In addition, the mean follow-up duration was considerably long.
In conclusion, TAC trough levels after 1 year post-transplant were not directly associated with long-term outcomes in stable Korean KTRs who did not experience renal or cardiovascu-lar outcomes. Therefore, in Asian KTRs who have not experienced any outcomes in the first year, TAC trough levels higher than approximately 6 ng/mL might not be required after a year of kidney transplantation.
Fig 4. eGFRs at 2, 3, 4, and 5 years post-transplant. There were no significant differences in eGFRs at 2 years (67.0± 18.1 vs. 65.5 ± 18.8 mL/min/1.73 m2
, P = 0.648), 3 years (67.8± 19.4 vs. 67.1 ± 20.2 mL/min/1.73 m2, P = 0.662), 4 years (66.9± 21.4 vs. 65.2 ± 20.8 mL/min/1.73 m2, P = 0.417), and 5 years (68.3± 21.3 vs. 64.9 ± 24.4 mL/ min/1.73 m2, P = 0.273) between the HL-TAC and LL-TAC groups. Abbreviations: eGFR, estimated glomerular filtration rate; LL, low-level; HL, high-level; TAC, tacrolimus.
Supporting information
S1 Table. Number of renal and cardiovascular outcomes after 1 year post-transplant.
(DOCX)
S2 Table. Multivariate Cox regression analysis for BPRA or IFTA.
(DOCX)
S1 File Raw data.
(XLSX)
Author Contributions
Conceptualization: Hee-Yeon Jung, Min Young Seo, Chan-Duck Kim.
Data curation: Hee-Yeon Jung, Min Young Seo, Kyu Ha Huh, Jae Berm Park, Cheol Woong
Jung, Sik Lee, Seung-Yeup Han, Han Ro, Jaeseok Yang, Curie Ahn, Chan-Duck Kim.
Formal analysis: Hee-Yeon Jung, Min Young Seo, Yena Jeon. Funding acquisition: Curie Ahn, Chan-Duck Kim.
Investigation: Hee-Yeon Jung, Min Young Seo, Kyu Ha Huh, Jae Berm Park, Cheol Woong
Jung, Sik Lee, Seung-Yeup Han, Han Ro, Jaeseok Yang, Curie Ahn, Ji-Young Choi, Jang-Hee Cho, Sun-Jang-Hee Park, Yong-Lim Kim, Chan-Duck Kim.
Methodology: Hee-Yeon Jung, Min Young Seo, Yena Jeon, Chan-Duck Kim. Writing – original draft: Hee-Yeon Jung.
Writing – review & editing: Hee-Yeon Jung, Min Young Seo, Chan-Duck Kim.
References
1. Sagedal S, Hartmann A, Nordal KP, Osnes K, Leivestad T, Foss A, et al. Impact of early cytomegalovi-rus infection and disease on long-term recipient and kidney graft survival. Kidney Int. 2004; 66(1):329– 37.https://doi.org/10.1111/j.1523-1755.2004.00735.xPMID:15200441.
2. Arthurs SK, Eid AJ, Pedersen RA, Kremers WK, Cosio FG, Patel R, et al. Delayed-onset primary cyto-megalovirus disease and the risk of allograft failure and mortality after kidney transplantation. Clin Infect Dis. 2008; 46(6):840–6.https://doi.org/10.1086/528718PMID:18260785.
3. Ramos E, Drachenberg CB, Wali R, Hirsch HH. The decade of polyomavirus BK-associated nephropa-thy: state of affairs. Transplantation. 2009; 87(5):621–30.https://doi.org/10.1097/TP.
0b013e318197c17dPMID:19295303.
4. Sellares J, de Freitas DG, Mengel M, Reeve J, Einecke G, Sis B, et al. Understanding the causes of kid-ney transplant failure: the dominant role of antibody-mediated rejection and nonadherence. Am J Trans-plant. 2012; 12(2):388–99.https://doi.org/10.1111/j.1600-6143.2011.03840.xPMID:22081892.
5. Park WY, Kang SS, Jin K, Park SB, Choe M, Han S. Long-term prognosis of BK virus-associated nephropathy in kidney transplant recipients. Kidney Res Clin Pract. 2018; 37(2):167–73. Epub 2018/07/ 05.https://doi.org/10.23876/j.krcp.2018.37.2.167PMID:29971212; PubMed Central PMCID:
PMC6027809.
6. Jardine AG. Assessing the relative risk of cardiovascular disease among renal transplant patients receiving tacrolimus or cyclosporine. Transpl Int. 2005; 18(4):379–84. https://doi.org/10.1111/j.1432-2277.2005.00080.xPMID:15773954.
7. van Gelder T, Silva HT, de Fijter JW, Budde K, Kuypers D, Tyden G, et al. Comparing mycophenolate mofetil regimens for de novo renal transplant recipients: the fixed-dose concentration-controlled trial. Transplantation. 2008; 86(8):1043–51.https://doi.org/10.1097/TP.0b013e318186f98aPMID: 18946341.
8. Ekberg H, Tedesco-Silva H, Demirbas A, Vitko S, Nashan B, Gurkan A, et al. Reduced exposure to cal-cineurin inhibitors in renal transplantation. N Engl J Med. 2007; 357(25):2562–75.https://doi.org/10. 1056/NEJMoa067411PMID:18094377.
9. Bouamar R, Shuker N, Hesselink DA, Weimar W, Ekberg H, Kaplan B, et al. Tacrolimus predose con-centrations do not predict the risk of acute rejection after renal transplantation: a pooled analysis from three randomized-controlled clinical trials(dagger). Am J Transplant. 2013; 13(5):1253–61.https://doi. org/10.1111/ajt.12191PMID:23480233.
10. Staatz C, Taylor P, Tett S. Low tacrolimus concentrations and increased risk of early acute rejection in adult renal transplantation. Nephrol Dial Transplant. 2001; 16(9):1905–9.https://doi.org/10.1093/ndt/ 16.9.1905PMID:11522877.
11. O’Seaghdha CM, McQuillan R, Moran AM, Lavin P, Dorman A, O’Kelly P, et al. Higher tacrolimus trough levels on days 2–5 post-renal transplant are associated with reduced rates of acute rejection. Clin Transplant. 2009; 23(4):462–8.https://doi.org/10.1111/j.1399-0012.2009.01021.xPMID:19681975.
12. Israni AK, Riad SM, Leduc R, Oetting WS, Guan W, Schladt D, et al. Tacrolimus trough levels after month 3 as a predictor of acute rejection following kidney transplantation: a lesson learned from DeKAF Genomics. Transpl Int. 2013; 26(10):982–9.https://doi.org/10.1111/tri.12155PMID:23879408; PubMed Central PMCID: PMC3787982.
13. Gaynor JJ, Ciancio G, Guerra G, Sageshima J, Roth D, Goldstein MJ, et al. Lower tacrolimus trough lev-els are associated with subsequently higher acute rejection risk during the first 12 months after kidney transplantation. Transpl Int. 2016; 29(2):216–26.https://doi.org/10.1111/tri.12699PMID:26442829.
14. Arreola-Guerra JM, Serrano M, Morales-Buenrostro LE, Vilatoba M, Alberu J. Tacrolimus Trough Lev-els as a Risk Factor for Acute Rejection in Renal Transplant Patients. Ann Transplant. 2016; 21:105– 14.https://doi.org/10.12659/aot.895104PMID:26879833.
15. Rehman S, Wen X, Casey MJ, Santos AH, Andreoni K. Effect of different tacrolimus levels on early out-comes after kidney transplantation. Ann Transplant. 2014; 19:68–75.https://doi.org/10.12659/AOT. 889858PMID:24509826.
16. Richards KR, Hager D, Muth B, Astor BC, Kaufman D, Djamali A. Tacrolimus trough level at discharge predicts acute rejection in moderately sensitized renal transplant recipients. Transplantation. 2014; 97 (10):986–91.https://doi.org/10.1097/TP.0000000000000149PMID:24784360.
17. Davis S, Gralla J, Klem P, Tong S, Wedermyer G, Freed B, et al. Lower tacrolimus exposure and time in therapeutic range increase the risk of de novo donor-specific antibodies in the first year of kidney trans-plantation. Am J Transplant. 2018; 18(4):907–15.https://doi.org/10.1111/ajt.14504PMID:28925597; PubMed Central PMCID: PMC5858995.
18. Jung HY, Cho SY, Choi JY, Cho JH, Park SH, Kim YL, et al. Comparison of Transplant Outcomes for Low-level and Standard-level Tacrolimus at Different Time Points after Kidney Transplantation. J Korean Med Sci. 2019; 34(12):e103.https://doi.org/10.3346/jkms.2019.34.e103PMID:30940998; PubMed Central PMCID: PMC6439199.
19. Wiebe C, Rush DN, Nevins TE, Birk PE, Blydt-Hansen T, Gibson IW, et al. Class II Eplet Mismatch Modulates Tacrolimus Trough Levels Required to Prevent Donor-Specific Antibody Development. J Am Soc Nephrol. 2017; 28(11):3353–62.https://doi.org/10.1681/ASN.2017030287PMID:28729289; PubMed Central PMCID: PMC5661295.
20. Gatault P, Kamar N, Buchler M, Colosio C, Bertrand D, Durrbach A, et al. Reduction of Extended-Release Tacrolimus Dose in Low-Immunological-Risk Kidney Transplant Recipients Increases Risk of Rejection and Appearance of Donor-Specific Antibodies: A Randomized Study. Am J Transplant. 2017; 17(5):1370–9.https://doi.org/10.1111/ajt.14109PMID:27862923.
21. Eckardt KU, Kasiske BL. Kidney disease: improving global outcomes. Nat Rev Nephrol. 2009; 5 (11):650–7.https://doi.org/10.1038/nrneph.2009.153PMID:19786993.
22. Trofe-Clark J, Brennan DC, West-Thielke P, Milone MC, Lim MA, Neubauer R, et al. Results of ASER-TAA, a Randomized Prospective Crossover Pharmacogenetic Study of Immediate-Release Versus Extended-Release Tacrolimus in African American Kidney Transplant Recipients. Am J Kidney Dis. 2018; 71(3):315–26.https://doi.org/10.1053/j.ajkd.2017.07.018PMID:29162334.
23. Yang J, Lee J, Huh KH, Park JB, Cho JH, Lee S, et al. KNOW-KT (KoreaN cohort study for outcome in patients with kidney transplantation: a 9-year longitudinal cohort study): study rationale and methodol-ogy. BMC Nephrol. 2014; 15:77.https://doi.org/10.1186/1471-2369-15-77PMID:24884405; PubMed Central PMCID: PMC4022441.
24. Helantera I, Salmela K, Kyllonen L, Koskinen P, Gronhagen-Riska C, Finne P. Pretransplant dialysis duration and risk of death after kidney transplantation in the current era. Transplantation. 2014; 98 (4):458–64.https://doi.org/10.1097/TP.0000000000000085PMID:24646770.
25. Himmelfarb J, Ikizler TA. Hemodialysis. N Engl J Med. 2010; 363(19):1833–45.https://doi.org/10.1056/ NEJMra0902710PMID:21047227.
26. Zimmermann J, Herrlinger S, Pruy A, Metzger T, Wanner C. Inflammation enhances cardiovascular risk and mortality in hemodialysis patients. Kidney Int. 1999; 55(2):648–58. https://doi.org/10.1046/j.1523-1755.1999.00273.xPMID:9987089.
27. Degenhardt TP, Grass L, Reddy S, Thorpe SR, Diamandis EP, Baynes JW. Technical note. The serum concentration of the advanced glycation end-product N epsilon-(carboxymethyl)lysine is increased in uremia. Kidney Int. 1997; 52(4):1064–7.https://doi.org/10.1038/ki.1997.429PMID:9328946.
28. Thishya K, Vattam KK, Naushad SM, Raju SB, Kutala VK. Artificial neural network model for predicting the bioavailability of tacrolimus in patients with renal transplantation. PLoS One. 2018; 13(4):e0191921. Epub 2018/04/06.https://doi.org/10.1371/journal.pone.0191921PMID:29621269; PubMed Central PMCID: PMC5886400.
29. Anutrakulchai S, Pongskul C, Kritmetapak K, Limwattananon C, Vannaprasaht S. Therapeutic concen-tration achievement and allograft survival comparing usage of conventional tacrolimus doses and CYP3A5 genotype-guided doses in renal transplantation patients. Br J Clin Pharmacol. 2019; 85 (9):1964–73. Epub 2019/05/12.https://doi.org/10.1111/bcp.13980PMID:31077425; PubMed Central PMCID: PMC6710516.
30. Kim IW, Noh H, Ji E, Han N, Hong SH, Ha J, et al. Identification of factors affecting tacrolimus level and 5-year clinical outcome in kidney transplant patients. Basic Clin Pharmacol Toxicol. 2012; 111(4):217– 23. Epub 2012/04/04.https://doi.org/10.1111/j.1742-7843.2012.00892.xPMID:22469198.
31. Cho JH, Yoon YD, Park JY, Song EJ, Choi JY, Yoon SH, et al. Impact of cytochrome P450 3A and ATP-binding cassette subfamily B member 1 polymorphisms on tacrolimus dose-adjusted trough concentra-tions among Korean renal transplant recipients. Transplant Proc. 2012; 44(1):109–14. Epub 2012/02/ 09.https://doi.org/10.1016/j.transproceed.2011.11.004PMID:22310591.
32. Floege J, Regele H, Gesualdo L, Group E-EIW. The ERA-EDTA Database on Recurrent Glomerulone-phritis following renal transplantation. Nephrol Dial Transplant. 2014; 29(1):15–21. Epub 2013/08/30. https://doi.org/10.1093/ndt/gft299PMID:23986077.