INTRODUCTION
Between one third and three fourths of maintenance hemo- dialysis patients show signs, symptoms, or laboratory evi- dence of malnutrition (1-5). There is a strong relationship between the extent of malnutrition and mortality. Specifi- cally, low serum albumin levels appear to be independently associated with an increased risk of death in patients treated with hemodialysis (6). Several factors have been identified which may contribute to this problem. Among these are ano- rexia and decreased nutrient intake (7, 8), hormonal derange- ments, such as insulin resistance, increased glucagon sensi- tivity and excess parathyroid hormone levels (9-11), intake of multiple medications (12), metabolic acidosis (13, 14) and frequent hospitalization (15). Dialysis-related factors may also have an important impact on malnutrition (16, 17). There is a considerable amount of amino acid and/or protein loss during renal replacement therapy, and the amount of amino acid loss varies depending on the type of dialysis. The aver- age loss of free amino acids in the dialysis fluid has been report- ed to be 5-8 g/dialysis during hemodialysis and 1.2-3.4 g/
24 hr during CAPD (18-20). Losses of amino acid during hemodialysis may also contribute to malnutrition. An incre- ased dose of dialysis and the use of biocompatible membranes
have also been used to enhance nutritional status in hemodial- ysis patients. However, several randomized and nonrandom- ized clinical trials have shown conflicting results regarding the impact of the study intervention on nutritional parame- ters (21-23). The high flux membrane (HF) in the HEMO study did not prevent deterioration in nutritional status over time (24). Although amino acid losses during dialysis have been reported previously, these studies have been performed using conventional cellulose membranes. One study revealed that the high flux membrane resulted in significantly more amino acid loss into the dialysate when compared to the low flux membrane (LF) (20). However, when adjusted for sur- face area and blood flow, amino acid losses were not different.
Although both surface area and blood flow influence amino acid losses to dialysate, the two membranes in this study were composed of different membrane material. There is no pre- vious report comparing the difference between HF and LF composed of the same synthetic membrane material.
In this study, we measured the impact of two different hemodialysis membranes with the same synthetic mem- brane material on plasma amino acid concentrations, and simultaneously measured the amino acid losses into the dia- lysate.
Hyo-Wook Gil, Jong-Oh Yang, Eun-Young Lee, Eun-Mi Lee*, Jong Soon Choi*, Sae-Yong Hong
Department of Internal Medicine, Soonchunhyang University Cheonan Hospital, Cheonan; Proteome Analysis Team, Korea Basic Science Institute*, Daejeon, Korea
Address for correspondence Eun-Young Lee, M.D.
Department of Internal Medicine, Soonchunhyang Cheonan Hospital, 23-20 Bongmyung-dong, Cheonan 330-100, Korea
Tel : +82.41-570-2132, Fax : +82.41-574-5762 E-mail : [email protected]
598
The Effect of Dialysis Membrane Flux on Amino Acid Loss in Hemodialysis Patients
We examined whether high flux membranes (HF) may induce a greater loss of amino acids compared to low flux membranes (LF). Ten hemodialysis patients participat- ed in this study. Pre- and post-hemodialysis plasma amino acid profiles were mea- sured by reverse-phase high pressure liquid chromatography for both HF and LF.
We measured the dialysate amino acid losses during hemodialysis. The reduction difference for plasma total amino acid (TAA), essential amino acid (EAA), and branch chained amino acid (BCAA) was not significantly different in comparisons between the two membranes. (HF vs. LF; TAA 66.85±±30.56 vs. 53.78±±41.28, p=0.12;
EAA 14.79±±17.16 vs. 17.97±±28.69, p=0.12; BCAA 2.21±±6.08 vs. 4.16±±10.98 mg/L, p=0.13). For the HF, the reduction in plasma amino acid levels for TAA and EAA were statistically significant. Although it was not statistically significant, the dialysate losses of BCAA were greater than the reduction in plasma (plasma reduc- tion vs. dialysate loss; HF 2.21±±6.08 vs. 6.58±±4.32, LF 4.16±±10.98 vs. 7.96±± 3.25 mg/L). HF with large pores and a sieving coefficient do not influence dialysate amino acid losses. Hemodialysis itself may influence the dialysate amino acid loss- es and may have an effect on protein metabolism.
Key Words : Amino Acid; High Flux Membrane; Low Flux Membrane
Received : 28 June 2006 Accepted : 7 December 2006
MATERIALS AND METHODS Patients
Ten patients participated in this study, which was conduct- ed at the Soonchunhyang University Cheonan Hospital, Cheo- nan, Korea. All of the patients who participated provided informed consent. The study protocol was approved by the Ethics Committee of Soonchunhyang University Cheonan Hospital, Korea. All study patients were clinically stable on chronic hemodialysis treatment for a minimum of 24 months.
We excluded patients who had cancer, active infection, pre- vious cardiovascular disease, or unstable vital signs during maintenance hemodialysis. The data were collected in August 2005. The mean age of the patients was 57.2±14.6 yr and the mean time on hemodialysis was 75.3±42.9 months.
Three of the patients were non insulin-dependent diabetics.
The mean height of the ten patients was 164.9±7.6 cm, and the body weight was 58.6±11.7 kg. The mean body mass index was 21.5±3.3. Urea Kinetic modeling and pro- tein catabolic rates (PCR) of the patients were calculated every three months. The Kt/V and nPCR results of the ten patients participating in the study were 1.52±0.22 and 0.92±0.24 g/kg/day, respectively. They had a mean serum albumin level of 3.74±0.56 g/dL. The ten patients had undergone LF dialysis and a sample was obtained, then they underwent HF dialysis and a sample was obtained. All pa- tients had a small meal approximately one hour prior to each dialysis treatment, which was similar in composition. Pati- ents were instructed to have a diet composed of a half bowl of rice with cooked vegetables.
Membranes
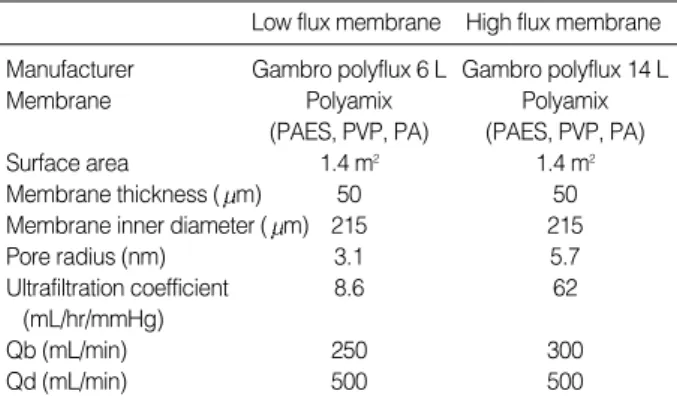
The characteristics of the membranes used in the study are shown in Table 1. LF (Polyflux 6L, Gambro dialysatoren;
from Hechingen, Germany) and HF (Polyflux 14S, Gam- bro dialysatoren; Hechingen, Germany) membranes were
composed of the same materials (PA polyamide; PAES pol- yarylethersulfon; PVP polyvinylpyrrolidone). The two mem- branes had the same surface area. However, the pore size dis- tribution of the nanoporous polymeric membranes was dif- ferent; these differences influence sieving capacity (25).
Plasma amino acid
Plasma amino acid concentrations were measured before and after dialysis performed using new dialyzers. The venous needle was inserted pointing toward the heart more than 5 cm proximal to the arterial needle to prevent the recircula- tion effect on plasma amino acid measure. Measured param- eters included pre- and post-dialysis (15 min following ter- mination of dialysis), blood samples from arterial blood lines for amino acid (AA) profiles, and blood chemistries at each dialysis session. Plasma samples were separated from blood within 15 min of collection, and all specimens were stored at temperatures -20℃immediately, until specific assays were performed.
Dialysate amino acid
Dialysate amino acid losses were initially measured during the first use of the two dialyzers.
Blood flow and ultrafiltration volume were similar with the two dialyzers in each patient (LF: blood flow 250 mL/
min, UF volume 2,700±220 mL, dialysate flow 500 mL/
min, HF: blood flow 300 mL/min, UF 2,770±180 mL, dia- lysate flow 500 mL/min). Gambro AK 95S Hemodialysis machines (Gambro dialysatoren; Hechingen, Germany) were used. Dialysate fluid was collected 4 times per hour, at 100 mL each time, during hemodialysis. Dialysate amino acid was calculated by the mean of four aliquots. The aliquots of dialysate were stored at -20℃, until specific assays were per- formed.
Amino acid analysis
Blood chemistry (BUN, creatinine, glucose, sodium, potas- sium, and HCO3-) was performed using standard techniques (76600-020, Hitachi, Japan). HCO3-was performed using blood gas analysis (Rapidlab 248, Bayer Health Care, U.S.A.).
Plasma and dialysate amino acid profiles were measured by reverse-phase high pressure liquid chromatography (HPLC) using a modified version of the methods of Bidlingmeyer et al. (25), and Heinrikson and Meredith (26), in which amino acids were derived from phenylisothiocyanate. The phenylth- iocarbamoyl amino acids were then separated over a 65 min gradient and detected at 254 nm.
Statistics
Repeated measure analysis of variance was used to assess
PA, polyamide; PAES, polyarylethersulfon; PVP, polyvinylpyrrolidone;
Qb, blood flow; Qd, dialysate flow.
Low flux membrane High flux membrane Manufacturer Gambro polyflux 6 L Gambro polyflux 14 L
Membrane Polyamix Polyamix
(PAES, PVP, PA) (PAES, PVP, PA)
Surface area 1.4 m2 1.4 m2
Membrane thickness ( m) 50 50
Membrane inner diameter ( m) 215 215
Pore radius (nm) 3.1 5.7
Ultrafiltration coefficient 8.6 62
(mL/hr/mmHg)
Qb (mL/min) 250 300
Qd (mL/min) 500 500
Table 1.Characteristics of the hemodialyzer
overall differences between the two types of membranes stud- ied. Data were presented as mean±SD values. A probabili- ty value of p<0.05 was considered statistically significant.
All statistical analyses were performed using SPSS for Win- dows (version 12.0, Chicago, IL, U.S.A.). We used paired t- tests to assess differences between membranes.
RESULTS Patients’ characteristics
The study included 6 male patients and 4 female patients.
All patients took ferrous sulfates, calcium acetate, vitamin B12, and folic acid. Nine patients took antihypertensive drugs (angiotensin receptor blocker 9; beta-blocker 6; calcium channel blocker 5). Three diabetic patients took an oral hypo- glycemic agent. All patients had native arteriovenous fistula.
All patients had less than 100 mL residual urine volume.
Pre-dialysis serum concentrations of BUN (45.98±9.08 mg/dL), creatinine (10.4±2.78 mg/dL), sodium (139.33± 3.57 mEq/L), potassium (4.91±0.67 mEq/L), and HCO3- (23.39±2.69 mEq/L) were not different in patients, regard- less of the dialyzers used. High sensitive C-reactive protein was 2.61±0.94 mg/L.
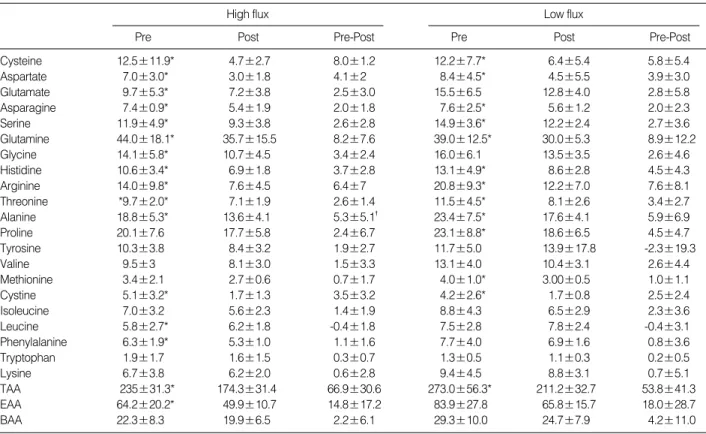
Plasma amino acid profile
The concentration of individual amino acids as well as the concentration of groups of amino acids (total, essential, and branched chain) in plasma before and after dialysis for each of the membranes is shown in Table 2. Pre-hemodialysis plasma amino acid levels were not significantly different in comparisons between the two dialysis membrane groups for any individual amino acid except glutamate (9.69±5.27 vs.
15.52±6.52 mg/L).
For HF, the reduction in plasma amino acid levels for total amino acids and essential amino acids were statistically sig- nificant, although the reduction of branch chained amino acids was not statistically significant. For LF, the reduction in total plasma amino acid levels was statistically significant.
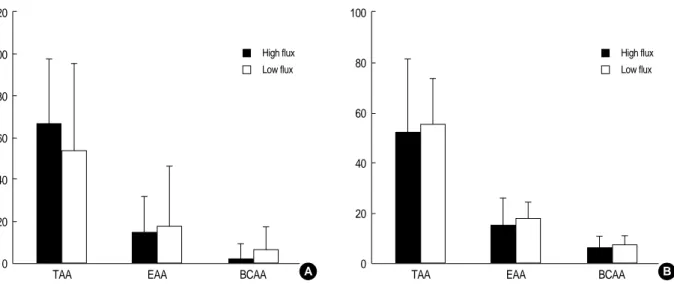
The difference in reduced levels of total amino acids (TAA), essential amino acids (EAA), and branched chain amino acids (BCAA) was not significant in comparisons between the two membranes (Fig. 1).
Dialysate amino acid losses
Amino acid losses in the dialysate for the two membranes are shown in Table 3. TAA, EAA, and BCAA were not sig- nificantly different in comparisons between the two mem- branes. Alanine loss in the dialysate was greater in the low
High flux
Pre Post Pre-Post
Low flux
Pre Post Pre-Post
Cysteine 12.5±11.9* 4.7±2.7 8.0±1.2 12.2±7.7* 6.4±5.4 5.8±5.4
Aspartate 7.0±3.0* 3.0±1.8 4.1±2 8.4±4.5* 4.5±5.5 3.9±3.0
Glutamate 9.7±5.3* 7.2±3.8 2.5±3.0 15.5±6.5 12.8±4.0 2.8±5.8
Asparagine 7.4±0.9* 5.4±1.9 2.0±1.8 7.6±2.5* 5.6±1.2 2.0±2.3
Serine 11.9±4.9* 9.3±3.8 2.6±2.8 14.9±3.6* 12.2±2.4 2.7±3.6
Glutamine 44.0±18.1* 35.7±15.5 8.2±7.6 39.0±12.5* 30.0±5.3 8.9±12.2
Glycine 14.1±5.8* 10.7±4.5 3.4±2.4 16.0±6.1 13.5±3.5 2.6±4.6
Histidine 10.6±3.4* 6.9±1.8 3.7±2.8 13.1±4.9* 8.6±2.8 4.5±4.3
Arginine 14.0±9.8* 7.6±4.5 6.4±7 20.8±9.3* 12.2±7.0 7.6±8.1
Threonine *9.7±2.0* 7.1±1.9 2.6±1.4 11.5±4.5* 8.1±2.6 3.4±2.7
Alanine 18.8±5.3* 13.6±4.1 5.3±5.1� 23.4±7.5* 17.6±4.1 5.9±6.9
Proline 20.1±7.6 17.7±5.8 2.4±6.7 23.1±8.8* 18.6±6.5 4.5±4.7
Tyrosine 10.3±3.8 8.4±3.2 1.9±2.7 11.7±5.0 13.9±17.8 -2.3±19.3
Valine 9.5±3 8.1±3.0 1.5±3.3 13.1±4.0 10.4±3.1 2.6±4.4
Methionine 3.4±2.1 2.7±0.6 0.7±1.7 4.0±1.0* 3.00±0.5 1.0±1.1
Cystine 5.1±3.2* 1.7±1.3 3.5±3.2 4.2±2.6* 1.7±0.8 2.5±2.4
Isoleucine 7.0±3.2 5.6±2.3 1.4±1.9 8.8±4.3 6.5±2.9 2.3±3.6
Leucine 5.8±2.7* 6.2±1.8 -0.4±1.8 7.5±2.8 7.8±2.4 -0.4±3.1
Phenylalanine 6.3±1.9* 5.3±1.0 1.1±1.6 7.7±4.0 6.9±1.6 0.8±3.6
Tryptophan 1.9±1.7 1.6±1.5 0.3±0.7 1.3±0.5 1.1±0.3 0.2±0.5
Lysine 6.7±3.8 6.2±2.0 0.6±2.8 9.4±4.5 8.8±3.1 0.7±5.1
TAA 235±31.3* 174.3±31.4 66.9±30.6 273.0±56.3* 211.2±32.7 53.8±41.3
EAA 64.2±20.2* 49.9±10.7 14.8±17.2 83.9±27.8 65.8±15.7 18.0±28.7
BAA 22.3±8.3 19.9±6.5 2.2±6.1 29.3±10.0 24.7±7.9 4.2±11.0
Table 2.Comparison of amino acid concentrations in plasma for high flux and low flux membranes (Mean±SD, mg/L)
*p<0.05 compared with post plasma amino acid concentration; �p<0.05 compared with the reduction of amino acid in low flux membrane.
TAA, total amino acid; EAA, essential amino acid; BAA, branch chained amino acid.
flux membrane than in the high flux membrane.
The reduction in some plasma amino acids (aspartate, cys- tine) was greater than dialysate losses in the high flux mem- brane, but the reduction of proline and leucine was less. The reduction in some plasma amino acids (cysteine, aspartate, cystine) was greater than dialysate losses for the LF, but the
reduction of leucine was less. Although it was not statisti- cally significant, the dialysate losses of BCAA were greater than the reduced amount of BCAA in plasma (Fig. 1).
DISCUSSION
Multiple factors may contribute to the abnormal amino acid profile seen in chronic renal failure. Many patients expe- rience anorexia, nausea, and vomiting caused by illness, ina- dequate dialysis or medication, and a moderate amount of amino acids are lost during each hemodialysis (18-20). In addition, altered lipid metabolism, metabolic acidosis, dec- reased muscle mass, and insulin resistance may also be closely related to the mechanism causing plasma amino acid abnor- malities in end stage renal disease (27-30).
Hemodialysis, with certain types of membranes, has been shown to increase protein catabolism. It has been observed that the breakdown of skeletal muscle protein occurs during sham dialysis with bioincompatible cellulosic membranes in healthy subjects (31). However, in our study, biocompatible membranes were used. These membranes have a minimal effect on complement activation, which induces the break- down of skeletal muscle protein.
HF had a larger pore size and a middle molecule sieving coefficient (32). Although the dose and flux intervention may subtly influence certain nutritional parameters, neither inter- vention prevented deterioration of nutritional status over time (24). HF does not improve nutritional parameters. We sug- gest that one of the causes of greater nutritional losses to dia- lysate in HF is due to the large pore and bigger sieving coeffi- cient. A previous report showed that HF resulted in a signifi- cant loss of amino acids into the dialysate when compared to LF (20). However, when adjusted for surface area and blood flow, amino acid losses were not different. Our study findings,
*p<0.05 compared with low flux.
TAA, total amino acid; EAA, essential amino acid; BAA, branched chain amino acid.
High flux Low flux
Cysteine 1.7±1.1 2.3±1.9
Aspartate 1.3±1.0 1.1±0.7
Glutamate 2.6±1.5 2.4±1.2
Asparagine 1.5±0.8 1.5±0.8
Serine 2.1±0.8 3.0±1.1
Glutamine 10.4±8.7 7.2±2.7
Glycine 2.2±0.8 3.0±1.4
Histidine 2.0±0.7 2.5±1.5
Arginine 2.5±1.5 3.4±1.4
Threonine 2.1±1.3 2.3±1.1
Alanine* 3.0±1.7 4.4±1.6
Proline 5.1±3.2 4.6±1.7
Tyrosine 4.9±2.1 5.4±2
Valine 2.7±1.6 3.4±1.2
Methionine 0.8±0.4 0.9±0.3
Cystine 0.4±0.3 0.5±0.5
Isoleucine 2.1±1.5 2.5±1.3
Leucine 1.7±1.1 2.1±0.9
Phenylalanine 1.4±0.8 1.6±0.4
Tryptophan 1.4±1.9 0.3±0.1
Lysine 1.2±0.9 1.6±0.8
TAA 52.9±28.4 56.0±17.7
EAA 15.9±10.3 18.1±6.7
BAA 6.6±4.32 8.0±3.3
Table 3.Comparison of amino acid losses into dialysate in high flux and low flux membranes (mean±SD, mg/L)
TAA EAA BCAA TAA EAA BCAA
Fig. 1.Comparison of high flux membranes with low flux membranes about amino acid dialysate losses and the reduction of plasma amino acids. TAA, total amino acid; EAA, essential amino acid; BCAA, branched chain amino acid.
A High flux
B 120
100
80
60
40
20
0
100
80
60
40
20
0 Low flux
High flux Low flux
with synthetic membranes, are consistent with the above result. We fixed the membrane surface, blood flow, and dialy- sis flow. Total dialysate amino acid losses were not different, and the reduction of plasma EAA was equal to dialysis loss- es for both membranes studied. HF, with a large pore size and sieving coefficient, did not influence the dialysate amino acid losses.
Increased attention has focused on the plasma levels of leu- cine, isoleucine, and valine, the so-called BCAA, because leucine has been shown to enhance protein synthesis in vitro.
Dialysate losses of BCAA were greater than the reduction of plasma BCAA, although this was not statistically significant.
This discrepancy suggests an enhanced appearance of new amino acids during dialysis, most likely from other tissue stores such as skeletal muscle. Our patients had no metabol- ic acidosis. Ikizler et al. (33) showed that hemodialysis is an overall catabolic event, decreasing the circulating amino acids, accelerating rates of whole body and muscle proteolysis, stim- ulating muscle release of amino acids, and elevating net whole body and muscle protein loss.
Our findings suggest that the hemodialysis membrane itself has a major impact by either increasing catabolism and/or from losses to the dialysate.
Our study of amino acid loss in hemodialysis patients has several limitations, although we believe that these do not inva- lidate its conclusions. First, the number of our study sample was very small. Second, the nutritional marker was varied, but in our study only nPCR, albumin, and cholesterol were measured. The nutritional status could affect the level of plasma amino acid. The patients were clinically stable, but if subjective global assessment, prealbumin, and transferrin were measured, which could explain the nutritional status of the patients. Third, recirculation has an effect on the level of plasma amino acid, but we did not measure recirculation.
To prevent recirculation, there was more than 5 cm distance between artery puncture and venous puncture. Fourth, we measured only the concentration of plasma amino acid before and after hemodialysis and the concentration of dialysis amino acid. We did not consider that hemodialysis itself could have caused a catabolic event. The muscle and whole body prote- olysis could happen, and plasma amino acid concentration might be affected. Fifth, HF was done only once. We did not consider that repeated usage could have an effect on the concentration of plasma amino acid.
In conclusion, amino acid losses to dialysate were not dif- ferent in comparisons between HF and LF when dialysis dose and blood flow were adjusted. HF with its large pore size and sieving coefficient does not influence dialysate amino acid losses. However, hemodialysis itself may influence dia- lysate amino acid losses and may have an effect on muscle breakdown. Improved protein metabolism should be pur- sued in patients undergoing hemodialysis.
REFERENCES
1. Centers for Medicare & Medicaid service: 2001 Annual report: End stage renal disease clinical performance measures projects. Am J Kidney Dis 2002; 39 (Suppl 2): 1-98.
2. Allman MA, Stewart PM, Tiller DJ, Horvath JS, Duggin GG, Trus- well AS. Energy Supplementation and the nutritional status of hemo- dialysis patients. Am J Clin Nutr 1990; 51: 558-62.
3. Alvestrand A, Gutierrez A. Relationship between nitrogen balance, protein and energy intake in haemodialysis patients. Nephrol Dial Transplant 1996; 11 (Suppl 2): 130-3.
4. Bansal VK, Popli S, Pickering J, Ing TS, Vertuno LL, Hano JE. Pro- tein-Calorie malnutrition and cutaneous anergy in hemodialysis maintained patients. Am J Clin Nutr 1980; 33: 1608-11.
5. Bellizzi V, Cioffi MF, Cianciaruso B. Body weight is a fluctuating parameter in hemodialysis patients. Kidney Int 2000; 58: 900.
6. Lowrie EG, Lew NL. Death risk in hemodialysis patients: the pre- dictive value of commonly measured variables and an evaluation of death rate differences between facilities. Am J Kidney Dis 1990; 15:
458-82.
7. Ellakany S, Eagon PK, Gavaler JR, Schade RR, Whiteside T, van Thiel DH. Gastrointestinal function, morphology, and immune sta- tus in uremia. Nutrition 1990; 6: 461-8.
8. Maroni B, Steiman TI, Mitch NE. A method for estimating nitrogen intake of patients with chronic renal failure. Kidney Int 1985; 27:
58-65.
9. DeFronzo RA, Alvestrand A, Smith D, Hendler R, Hendler E, Wahren J. Insulin resistance in uremia. J Clin Invest 1981; 67: 563-8.
10. Arem R. Hypoglycemia associated with renal failure. Endocrinol Metab Clin N Am 1989; 18: 103-21.
11. Akmal M, Massry SG, Goldstein DA, Fanti P, Weisz A, DeFronzo RA. Role of parathyroid hormone in the glucose intolerance of chron- ic renal failure. J Clin Invest 1985; 75: 1037-44.
12. Hakim RM, Levin N. Malnutrition in hemodialysis patients. Am J Kidney Dis 1993; 21: 125-37.
13. Mitch WE, May RC, Maroni BJ, Druml W. Protein and amino acid metabolism in uremia: influence of metabolic acidosis. Kidney Int 1989; 37 (Suppl 27): 205-7.
14. Mitch WE, Jurkovitz C, England BK. Mechanisms that cause pro- tein and amino acid catabolism in uremia. Am J Kidney Dis 1993;
21: 91-5.
15. Sanders HN, Harvarte J, Bittle PA, Ramirez G. Hospitalized dialy- sis patients have lower nutrient intakes on renal diet than on regu- lar diet. J Am Dietet Assoc 1991; 91: 1278-80.
16. Borah MF, Scholenfeld PY, Gotch FA, Sargent JA, Wolfson M, Hum- phreys MH. Nitrogen balance during intermittent dialysis therapy of uremia. Kidney Int 1978; 14: 491-500.
17. Lim VS, Flanigan MJ. The effect of interdialytic interval on protein metabolism: Evidence suggesting dialysis-induced catabolism. Am J Kidney Dis 1989; 14: 96-101.
18. Kopple JD, Blumenkrantz MJ, Jones MR, Moran JR, Cobum JW.
Plasma amino acid levels and amino acid losses during continuous ambulatory peritoneal dialysis. Am J Clin Nutr 1982; 36: 395-402.
19. Wolfson M, Jones MR, Kopple JD. Amino acid losses during hemo-
dialysis with infusion of amino acids and glucose. Kidney Int 1982;
21: 500-6.
20. Ikizler TA, Flakoll PJ, Parker RA, Hakim RM. Amino acid and albu- min losses during hemodialysis, Kidney Int 1994; 46: 830-7.
21. Locatelli F, Mastrangelo F, Redaelli B, Ronco C, Marcelli D, La Greca G, Orlandini G. Effects of different membranes and dialysis technologies on patient treatment tolerance and nutritional parame- ters. The Italian Cooperative Dialysis Study Group. Kidney Int 1996;
50: 1293-302.
22. Parker TF 3rd, Wingard RL, Husni L, Ikizler TA, Parker RA, Hakim RM. Effect of the membrane biocompatibility on nutritional param- eters in chronic hemodialysis patients. Kidney Int 1996; 49: 551-6.
23. Marcus RG, Cohl E, Uribarri J. Protein intake seems to respond to increases in Kt/V despite baseline Kt/V greater than 1.2 Am J Nephrol 1999; 19: 500-4.
24. Rocco MV, Dwyer JT, Larive B, Greene T, Cockram DB, Chumlea WC, Kusek JW, Leung J, Burrowes JD, McLeroy SL, Poole D, Uhlin L. HEMO Study Group: The effect of dialysis dose and membrane flux on nutritional parameters in hemodialysis patients: results of the HEMO Study. Kidney Int 2004; 65: 2321-34.
25. Bidlingmeyer B, Cohen S, Travin T. Rapid analysis of amino acids using pro-column derivatization. J Chromatogr Biomed Appl 1984;
336: 93-104.
26. Heinrikson R, Meredith S. Amino acid analysis by reverse-phase high-pressure liquid chromatography: Precolumn derivatization with phenylisothiocyanate. Anal Biochem 1984; 136: 65-74.
27. Papadoyannakis NJ, Stefanides CJ, McGeown M. The effect of the
correlation of metabolic acidosis on nitrogen and protein balance of patients with chronic renal failure. Am J Clin Nutr 1984; 40: 623-7.
28. Bergstrom J, Furst P, Noree LO, Vinnars E. Intracelluar free amino acids in muscle tissue of patients with chronic uremia effect of peri- toneal dialysis and infusion of essential amino acids. Clin Sci Mol Med 1978; 54: 51-60.
29. Castellino P, Luzi L, Simonson DC, Haymond M, DeFronzo RA.
Effect of insulin and plasma amino acid concentrations on leucine metabolism in man: the role of substrate availability on estimates of whole body protein synthesis. J Clin Invest 1987; 80: 1784-93.
30. Castellino P, Solini A, Luzi L, Barr JG, Smith DJ, Petrides A, Gior- dano M, Carroll C, DeFronzo RA. Glucose and amino acid meta- bolism in chronic renal failure: effect of insulin and amino acids. Am J Physiol 1992; 262: 168-76.
31. Gutierrez A, Alvestrand A, Wahren J, Bergstrom J. Effect of in vivo contact between blood and dialysis membranes on protein catabolism in humans. Kidney Int 1990; 38: 487-94.
32. Ronco C, Crepaldi C, Brendolan A, Bragantini L, d’Intini V, Inguag- giato P, Bonello M, Krause B, Deppisch R, Goehl H, Scabardi A.
Evolution of synthetic membranes for blood purification: the case of the Polyflux family. Nephrol Dial Transplant 2003; 18 (Suppl 7):
10-20.
33. Ikizler TA, Pupim LB, Brouillette JR, Levenhagen DK, Farmer K, Hakim RM, Flakoll PJ. Hemodialysis stimulates muscle and whole body protein loss and alters substrate oxidation. Am J Physiol En- docrinol Metab 2002; 282: 107-16.