ISSN 2288-1069 (Online)
http://dx.doi.org/10.12925/jkocs.2016.33.1.204
Assessment of Antioxidant Activity of Garlic
( Allium sativum L.) Peels by Various Extraction Solvents
Gyeong-Hwuii Kim
1ㆍYishan Duan
2ㆍSang-Chang Lee
3ㆍHan-Soo Kim
2,✝1
Department of Biological Science and Technology, Yonsei University, Seoul 03722, Korea
2
Department of Food Science and Technology, Pusan National University, Miryang 50463, Korea
3
College of Nano Science and Technology, Office of Administration, Pusan National University, Miryang 50463, Korea
(Received February 17, 2016; Revised March 7, 2016; Accepted April 1, 2016)
Abstract : This study was carried out to investigate the antioxidant activities, total phenol, and flavonoid contents of 70% methanol, 70% ethanol, and chloroform-methanol (CM, 2:1, v/v) extracts from garlic ( Allium sativum L.) peels. Antioxidant activity was evaluated by DPPH (2,2-diphenyl-1-picrylhydrazyl) radical and ABTS [2,2′-azino-bis(3-ethylbenzothiazoline-6- sulfonic acid) diammonium salt] radical scavenging activity, β-carotene bleaching assay, and ferric reducing antioxidant power. Total phenol and flavonoid were in a range of 32.59-63.05 mg CAE/g, 5.26-9.22 mg QE/g, respectively. Total phenol and flavonoid were predominant with the values of 63.05±0.20 mg CAE/g and 9.22±0.17 mg QE/g in 70% ethanol extract. Additionally, 70% ethanol extract also displayed the strongest antioxidant activity followed by 70% methanol extract and CM extract in all assays. These results showed that garlic peel can be used as natural antioxidant in nutraceutical preparations to prevent human diseases.
Keywords : garlic (Allium sativum L.) peels, total phenol, flavonoid, antioxidant activity
1. Introduction
Garlic ( Allium sativum L.) has played an important dietary and medicinal role for centuries. Even today the medicinal use of garlic is widespread and growing [1]. Studies have conducted the consumption of garlic could treat various ailments such as heart disease, arthritis, pulmonary complaints, abdominal growths (particularly uterine), diarrhea and worm infestation as well as
✝
Corresponding author
(E-mail: [email protected])
reduce the risk of cancer [2,3]. In Korea, garlic has generated a lot of interest throughout human history as an indispensable part of diet. The major bioactive compounds in garlic was phenolics, flavonoids, alliin, allicin, organosulfur volatiles, S-allyl-L- cysteine, steroid saponins and sapogenins [4,5].
Allicin as a major component present in freshly cut garlic is one of the most biologically active compounds of garlic [6].
Alliin is acted upon by the allinase to form
allicin, which gets metabolized rapidly into
diallyl sulfide, diallyl disulfide, diallyl trisulfide,
ajoene, S-allylmercaptocysteine, S-allyl cysteine
and vinyl dithiines [3]. Allicin displays antibacterial, antifungal, antiparasitic and antiviral activies [7] and is said to lower the serum cholesterol, triglycerides and simultaneously the systolic blood pressure [8].
The overproduction of oxidative radicals such as reactive oxygen species (ROS) or reactive nitrogen species (RNS) results in oxidative stress, which is considered to contribute to some diseases such as age-related neurodegenerative diseases, cardiovascular disease and cancer [9]. Fruit and vegetables contain not only essential nutrients needed for daily life but also a wide variety of bioactive compounds (antioxidant phytochemicals) for health promotion and disease prevention [10,11]. The extract from garlic peel has been reported to show strong antioxidant activity and could use as an herbal medicine [12].
Therefore, the objective of this study was to evaluate total phenol content, total flavonoid content and antioxidant activity of garlic ( Allium sativum L.) peels by various solvents including 70% methanol, 70% ethanol and chloroform-methanol (CM, 2:1, v/v).
2. Materials and Methods 2.1. Materials
Garlics ( Allium sativum L.) were purchased from Uiseong (Gyeongbuk, Korea). Garlics were peeled and ground with a blender (HMF-3250S, Hanil Electric Co., Seoul, Korea). The garlic peel flours were stored at – 80℃ (SW-UF-400, Sam-Won Co., Busan, Korea) for further analyses.
2.2. Preparation of garlic peel extracts Garlic peel flours were mixed with various extraction solvents including 70% methanol, 70% ethanol and chloroform–methanol mixture (CM, 2:1, v/v) in a ratio of 1:10 and kept in the dark about 24 h, and then used the Advantec No. 1 filter paper (Tokyo, Japan) to filter. The process of extraction was repeated 3
times. The filtrate was evaporated by rotary vacuum evaporator (EYELA, N-N series, Tokyo, Japan) until the solvents were completely removed. The extracts were collected and sealed in brown reagent bottles and frozen at –80℃ until required for further analyses.
2.3. Measurement of total phenol contents (TPC)
The total phenol contents were determined by using Folin–Denis’ phenol (Sigma-Aldrich, St. Louis, USA) reagent and caffeic acid (Sigma-Aldrich, St. Louis, USA) was used as a standard for the calibration curve [13,14]. In brief, samples (0.5 mL) were mixed with 3.0 mL of distilled water and 0.5 mL of Folin–
Denis’ phenol reagent in the test tubes. After incubated for 3 min, 0.5 mL of 10% sodium carbonate (w/v) was added. Then the mixture was incubated in the temperature for 60 min.
The absorbance of the reaction mixture was measured at 700 nm using uv/vis- spectrophotometer (Specord 200, Analytikjena, Jena, Germany). Total phenol contents were expressed as mg of caffeic acid equivalents per g of extract (mg CAE/ g extract).
2.4. Measurement of total flavonoids content (TFC)
Total flavonoid content was determined by aluminum chloride colorimetric method with some modifications [15,16]. Samples (0.5 ml) were mixed with 0.5 ml of 10% aluminum nitrate enneahydrate (Junsei, Tokyo, Japan), 0.5 ml of 1 M sodium acetate and 2.0 ml of 80% ethanol (v/v). After this step, reaction mixture was incubated at room temperature for 40 min, and then the absorbance was read at 415 nm. Quercetin (Sigma-Aldrich, St.
Louis, USA) was used as a standard. Total
flavonoids contents were expressed as mg of
quercetin equivalents per g of extract (mg
QE/g extract).
2.5. DPPH radical scavenging activity assay
DPPH radical scavenging activity was measured according to the method of Ichikawa et al and Duan et al [12,13]. Samples (2.0 mL) were mixed with 0.4 mM DPPH (2.0 mL, Sigma-Aldrich, St. Louis, USA) and then vigorously shaken. The mixture solution was stood in the dark for 30 min at 37℃ water bath. Ascorbic acid (Sigma-Aldrich, St. Louis, USA) was used as positive control. Then the absorbance of the reaction mixture was read with spectrophotometer at 517 nm. The percentage inhibition of DPPH radical scavenging activity was calculated based on the control reading using the following calculation:
DPPH radical scavenging activity (%)
where A
sis the absorbance in the presence of sample or BHA (butylated hydroxyanisole, Sigma-Aldrich, St. Louis, USA), and A
cis the absorbance of control reaction.
2.6. ABTS radical scavenging activity assay
ABTS radical scavenging activity was evaluated according to the method of Gorinstein et al [17]. The mixture of 15 mL of 7 mM ABTS (Sigma-Aldrich, St. Louis, USA) and 15 mL of 2.45 mM potassium persulfate was stored at room temperature in the dark for 16 h to get the green–blue free radical ABTS˙
+. Then the solution was diluted with ethanol until the absorbance was 0.7±0.02 at 734 nm. Samples (0.1 mL) were mixed with 2.9 mL of ABTS working solution.
After 10 min of reaction, the absorbance was taken at 734 nm. Ascorbic acid was used as positive control. The percentage of ABTS radical scavenging effect was calculated as follow:
ABTS radical scavenging effect (%)
where A
sis the absorbance in the presence of sample or BHA, and A
cis the absorbance of control reaction.
2.7. β-carotene bleaching assay
The antioxidant activity of different extract was evaluated according to the β-carotene bleaching method following the method of Kaur and Kapoor [18]. In brief, a solution of β-carotene was prepared by dissolving 1 mg of β-carotene (Sigma-Aldrich, St. Louis, USA) in 10 mL of chloroform. One milliliter of this solution was then added to a round-bottomed flask containing a mixture of 20 mg linoleic acid (Sigma-Aldrich, St. Louis, USA) and 200 mg Tween 40. After the chloroform was removed under vacuum using a rotary evaporator at 40℃, 100 mL of aerated distilled water were added to the flask with vigorous shaking. The emulsion obtained was freshly prepared before experiment. An aliquot (3.0 mL) of the β-carotene–linoleic acid emulsion was mixed with 0.3 mL of sample extracts, positive control standards (ascorbic acid). Then the mixture was incubated at 50℃ for 120 min. Absorbance readings were performed immediately (t=0 min) and after 120 min of incubation at 470 nm with. Antioxidant activity (AOA) was calculated using the following formula:
A
0and A′
0are the initial absorbance of sample and control, whereas A
120and A′
120are the absorbance of sample and control after 120 min.
2.8. Ferric reducing antioxidant power (FRAP) assay
The working FRAP reagent was prepared by
mixing 10 mL of 0.3 M sodium acetate buffer
(pH 3.6), 1 mL of 10 mM TPTZ
(Sigma-Aldrich, St. Louis, USA) in 40 mM
hydrochloride acid and 1 mL of 20 mM ferric
chloride (Junsei, Tokyo, Japan). The freshly
prepared FRAP reagent (3.0 mL) was mixed
with 0.2 mL of sample solution. After
incubated at 37℃ water bath for 30 min, the
absorbance was read at 593 nm. Ascorbic acid
was used as the positive control. The FRAP
values were expressed as the absorbance of
samples [15,19].
Assays 70% methanol 70% ethanol CM
2)Extraction yields (%) 3.67 4.51 3.31
Total phenol content (mg GAE/g) 55.48±0.40
b3)63.05±0.20
c32.59±0.20
aTotal flavonoid content (mg QE/g) 8.06±0.32
b9.22±0.17
c5.26±0.29
aDPPH
1)(IC
50, mg/mL) 0.24±0.00
b0.20±0.00
a0.42±0.01
cABTS (IC
50, mg/mL) 0.51±0.01
b0.44±0.01
a0.86±0.04
cβ-carotene bleaching (IC
50, mg/mL) 1.96±0.27
b1.27±0.14
a2.88±0.33
c1)
DPPH radical scavenging activity (DPPH), ABTS radical scavenging activity (ABTS) and β -carotene bleaching assays.
2)
CM: chloroform–methanol mixture (2:1, v/v).
3)
The values are means±SD (n=3). Values with the different letters in the same row are significantly different (p<0.05) by Duncan’s multiple range tests.
Table 1. Extraction yields, total phenol contents, total flavonoid contents and IC
50values in the antioxidant activity evaluation assays of garlic ( Allium sativum L.) peels
2.9. Statistical analysis
The experimental data in triplicate were subjected to analysis of variance (ANOVA) and expressed as mean±SD (n=3). ANOVA was performed by using the one-way analysis of variance procedures. Duncan’s multiple-range test was used to analysis the significant difference of means, and p<0.05 was considered to be statistically significant for all statistic procedures. IBM SPSS statistic 21 program was used for data analysis.
3. Results and Discussion
3.1. Yields
The various extraction yields of garlic peels by 70% methanol, 70% ethanol, and chloroform–methanol (CM, 2:1, v/v) were shown in Table 1. The extraction yield by 70% ethanol was found to show the maximum (4.51%), followed by 70% methanol (3.67%) and CM (3.31%).
3.2. Total phenol contents (TPC)
As phenolic compounds possess the structure of hydroxyl substituent on the aromatic ring,
they could serve as antioxidants to scavenge oxygen radicals and other highly reactive oxygen species [20,21]. Furthermore, a positively and highly significant relationship between total phenolics and antioxidant activity has already been conducted by Velioglu et al [22]. Total phenol contents were determined by according to the colorimetric Folin–Denis’ method with caffeic acid as a stand compound (y=0.1141x+0.0076, R
2=0.9941). The total phenol contents of various extracts (70% methanol, 70% ethanol, and CM extracts) fromgarlic peels were showed in Table 1. 70% Ethanol extract was found to show the highest Total phenol content, with a mean of 63.05±0.20 mg CAE/g extract. And the total phenol contents of 70% methanol extract and CM extract were 55.48±0.40 and 32.59±0.20 mg CAE/g extract, respectively. According to the reports of Kaur and Kapoor [18], the total phenol content of garlic was determined to be 145.0±5.9 mg catechol/100 g fresh weight.
3.3. Total flavonoid contents (TFC)
Flavonoids as plant phytochemicals are a
group of polyphenolic compounds diverse in
chemical structure and characteristics [23].
Numerous studies have continuously suggested that flavonoids not only show antioxidant capacity, anti-inflammatory, antiviral activities, but also inhibit the lipid peroxidation platelet aggregation and the activity of enzyme system such as cyclooxygenase and lipoxygenase [23,24]. The content of flavonoid in extracts from various extraction solvents were calculated in accordance with the calibration curve of quercetin (y=0.1092x+0.0034, R
2=9996). As can be seen in Table 1, total flavonoid contents of various extracts decreased in the order: 70% ethanol extract (9.22±0.17 mg QE/g), 70% methanol extract (8.06±0.32 mg QE/g) and CM extract (5.26±0.29 mg QE/g), respectively. In the mature garlic plant, the amounts of total flavonoid content were determined to be 5.78±0.09 and 6.99±0.01 µ g QE/g, respectively [25].
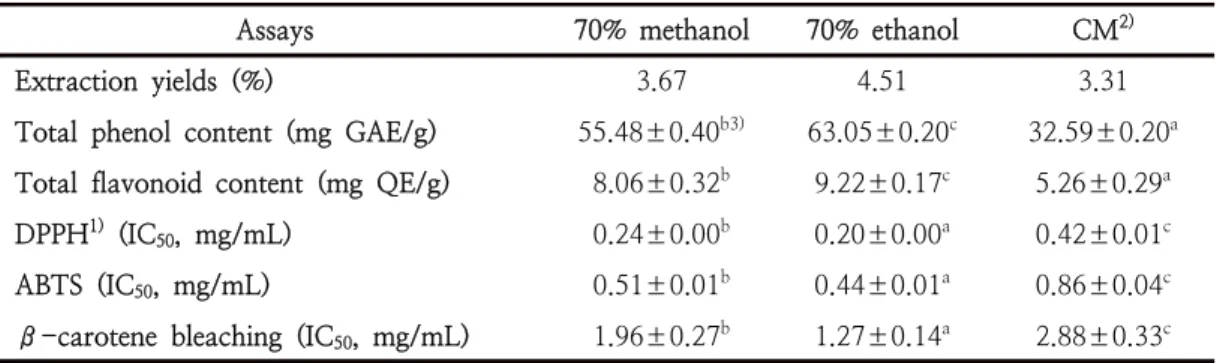
3.4. DPPH radical scavenging activity DPPH is a stable free radical and can be scavenged by antioxidants through donating hydrogen. The discoloration from purple to yellow induces the absorbance of reaction mixture decreases at 517 nm [26]. Fig. 1 described the DPPH radical scavenging activities of various extracts appeared to be associated with increasing concentrations (0.2 mg/mL, 0.4 mg/mL and 0.6 mg/mL). All extracts exhibited excellent DPPH radical scavenging ability even if their effects were lower than that of ascorbic acid. Results showed that the antioxidant activity of various extracts decreased in the following order: 70%
ethanol extract (IC
50=0.20±0.00 mg/mL), 70%
methanol extract (IC
50=0.24±0.00 mg/mL), and CM extract (IC
50=0.42±0.01 mg/mL) (Table 1). The garlic peel extract indicated strong activity eliminating about 90% of the DPPH radicals at the concentration of 0.1%
[12]. In our study, correlation between total phenol content, total flavonoid content and DPPH radical scavenging activity in all extracts
was could be observed clearly. This founding was in keeping with the reports of Velioglu et al [22] and Braca et al [27].
Fig. 1. DPPH radical scavenging activity of various extracts from garlic ( Allium sativum L.) peels.
1)
The values are means±SD (n=3). Bars with the different letters are significantly different (p<0.05) by Duncan’s multiple range tests.
2)
CM: chloroform–methanol mixture (2:1, v/v) extract.
3)
AA: ascorbic acid.
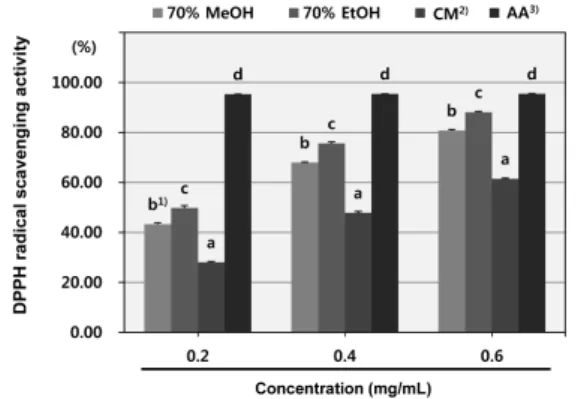
3.5. ABTS radical scavenging activity The radical–cation ABTS˙
+is produced by the oxidation of ABTS. In the absence of antioxidants, ABTS is rather stable, but it reacts actively with an H-atom donor (i.e.
phenolics). Therefore, the blue/green chromophore would discolor gradually or be converted into a non-colored form of ABTS up to the antioxidant capacity of antioxidants [28]. The inhibitory effects of various extracts on ABTS radical are presented in Fig. 2 and Table 1. ABTS radical scavenging activity was appreciable and concentration-related in all extracts. The IC
50values of different fractions increased in the following order: 70% ethanol extract (IC
50=0.44±0.01 mg/mL), 70%
methanol extract (IC
50=0.51±0.01 mg/mL) and
CM extract (IC
50=0.86±0.04 mg/mL),
respectively. Obviously, the 70% ethanol
extract exhibited the strongest scavenging
activity against ABTS radical compared to
other extracts. The phenomenon that garlics display ABTS radical scavenging activity has been proved by Gorinstein et al [17]. Our results revealed that the ABTS radical scavenging activity of garlic peel extracts depended on their total phenol and flavonoid contents. This founding was in consistent with a number of previous studies, which state the correlation between total phenol, flavonoid contents and antioxidant activity was existed [22,29].
Fig. 2. ABTS radical scavenging activity of various extracts from garlic ( Allium sativum L.) peels.
1)
The values are means±SD (n=3). Bars with the different letters are significantly different (p<0.05) by Duncan’s multiple range tests.
2)
CM: chloroform–methanol mixture (2:1, v/v) extract.
3)
AA: ascorbic acid.
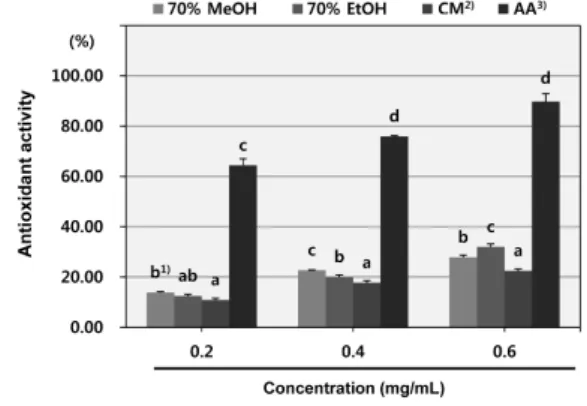
3.6. β-carotene bleaching assay
Fig. 3 showed the effects of various extracts on the bleaching of β-carotene. The highly unsaturated β-carotene molecules in this system can be attacked by free radicals generating from the oxidation of linoleic acid, and as a consequence, the characteristic orange color disappears. The presence of antioxidant can avoid the destruction of the β-carotene by neutralizing the free radicals formed in the system to keep the orange color [30]. The results exhibited concentration-dependent
antioxidant activity by β-carotene bleaching method in all the tested concentrations of various extracts. And ascorbic acid always showed the most effective antioxidant activity compared with other extracts. 70% Ethanol extract protected the linoleic acid from peroxidation (IC
50=1.27±0.14 mg/mL) more efficient than 70% methanol extract (IC
50=1.96±0.27 mg/mL) and CM extract (IC
50=2.88±0.33 mg/mL) (Table 1). In the study of Kaur and Kapoor [18] the fresh garlic inhibited lipid oxidation by 62.1%
(ethanol extract) and 61.8% (aqueous extract).
It was probable that the antioxidative components in extracts can reduce the extent of β-carotene destruction by neutralizing the linoleate free radical and other free radicals in this system. Amongst the extracts studied, the antioxidant activities might be related to their total phenol and flavonoid contents. This result was in agreement with the foundings of Queiroz rt al [31] and Taji et al [32].
Fig. 3. Antioxidant activity of various extracts from garlic ( Allium sativum L.) peels by using β-carotene bleaching method.
1)
The values are means±SD (n=3). Bars with the different letters are significantly different (p<0.05) by Duncan’s multiple range tests.
2)
CM: chloroform–methanol mixture (2:1, v/v) extract.
3)
AA: ascorbic acid.
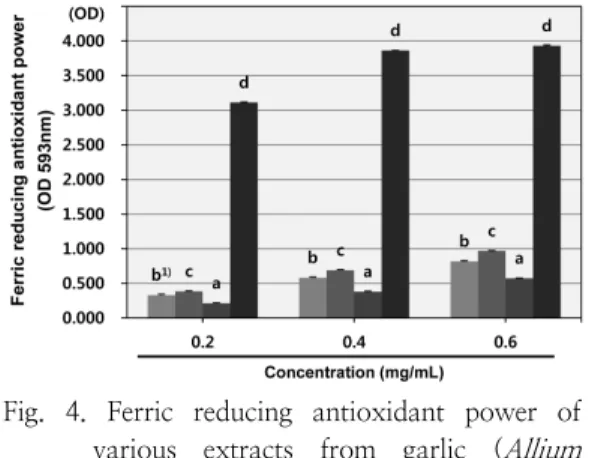
3.7. Ferric reducing antioxidant power (FRAP)
Antioxidant potential of various extracts from garlic peels was estimated from their ability to reduce the ferric-tripyridyltriazine (Fe
Ⅲ-TPTZ) complex to ferrous- tripyridyltriazine (Fe
Ⅱ-TPTZ) at low pH, forming an intense blue color with an absorption maximum at 593 nm develops [19].
The antioxidant activities through the ferric reducing antioxidant power model system of garlic peels extracts at 0.2 to 0.6 mg/mL concentrations compared with ascorbic acid were presented in the Fig. 4. The ferric reducing antioxidant power values increased with the increasing concentration of the extract sample. At a concentration of 0.6 mg/mL, the FRAP value of 70% ethanol extract was found to be 0.97±0.01, which was significantly higher than 70% methanol extract (0.82±0.01) and CM extract (0.57±0.00) but lower than that of ascorbic acid. The FRAP values of garlic and elephant garlic extracts were reported to range from 7.62±0.64 to 11.45±0.63 µmol trolox/g FW [33]. Similar
Fig. 4. Ferric reducing antioxidant power of various extracts from garlic ( Allium sativum L.) peels.
1)
The values are means±SD (n=3). Bars with the different letters are significantly different (p<0.05) by Duncan’s multiple range tests.
2)
CM: chloroform–methanol mixture (2:1, v/v) extract.
3)