*Corresponding author: Wonho Yang, Tel: 053-850-3739, E-mail: [email protected]
Department of Occupational Health, Catholic University of Daegu. 13-13 Hayang-ro, Hayang-eup, Gyeongsan-si, Gyeongbuk 712-012 Received: September 4, 2014, Revised: December 12, 2014, Accepted: December 17, 2014
This is an Open-Access article distributed under the terms of the Creative Commons Attribution Non-Commercial
License(http://creativecommons.org/licenses/by-nc/3.0) which permits unrestricted non-commercial use, distribution, and reproduction in any medium, provided the original work is properly cited.
http://dx.doi.org/10.15269/JKSOEH.2014.24.4.436
시간활동 양상과 국소환경 농도를 이용한 근로자의 유해 공기오염물질 노출 예측
이현수ㆍ이석용ㆍ이병준ㆍ허 정ㆍ김순신ㆍ양원호* 대구가톨릭대학교 산업보건학과
Estimation of Personal Exposure to Air Pollutants for Workers Using Time Activity Pattern and Air Concentration of Microenvironments
Hyunsoo LeeㆍSeokyong LeeㆍByoungjun LeeㆍJung HeoㆍSunshin KimㆍWonho Yang* Department of Occupational Health, Catholic University of Deagu
ABSTRACT
Objectives: Time-activity studies have become an integral part of comprehensive exposure assessment and personal exposure modeling. The aims of this study were to estimate exposure levels to nitrogen dioxide(NO2) and volatile organic compounds(VOCs), and to compare estimated exposures by using time-activity patterns and indoor air concentrations.
Methods: The major microenvironments for office workers were selected using the Time-Use Survey conducted by the National Statistical Office in Korea in 2009. A total of 9,194 and 6,130 workers were recruited for weekdays and weekends, respectively, from the Time-Use Survey. It appears that workers were spending about 50% of their time in the house and about 30% of their time in other indoor areas during the weekdays. In addition, we analyzed the time-activity patterns of 20 office workers and indoor air concentrations in Daegu using a questionnaire and time-activity diary. Estimated exposures were compared with measured concentrations using the time-weighted average analysis of air pollutants.
Conclusions: According to the time-activity pattern for the office workers, time spent in the residence indoors during the summer and winter have been shown as 11.12±2.20 hours and 12.48±1.77 hours, respectively, which indicates higher hours in the winter.
Time spent in the office in the summer has been shown to be 1.5 hours higher than in the winter. The target pollutants demonstrate a positive correlation (R2=0.076~0.553)in the personal exposure results derived from direct measurement and estimated personal exposure concentrations by applying the time activity pattern, as well as measured concentration of the partial environment to the TWA model. However, these correlations were not statistically significant. This may be explained by the difference being caused by other indoor environments, such as a bar, cafe, or diner.
Key words: Office workers, time-activity pattern, microenvironment, TWA model
I. 서 론
오늘날 우리나라는 급격한 산업화와 도시화에 따 라 인간의 생활환경은 많은 변화가 이루어지고 있으 며, 다양한 환경오염에 관한 문제가 대두되고 있다
(Yang et al., 2008). 여러 가지 환경인자 중 공기는 사람이 살아가는데 없어서는 안 될 중요한 요소라 할 수 있다. 대부분의 사람들은 하루 중 대략 80%
이상을 실내에서 보내고 있어 실내환경의 공기오염 물질 농도는 재실자의 건강 위해를 미칠 만큼 보건
학적으로 중요한 인자이며(Yang et al., 2009), 공기오 염물질의 개인노출은 고정된 대기측정망에 의해 측 정된 것 보다는 오히려 실내 및 실외 환경을 모두 고 려한 실내농도에 의해 결정된다(Lai et al., 2004). 노 출은 일반적으로 오염원과 인간사이의 접촉으로 정 의될 수 있으며, 노출평가는 평가 대상 실내외 공기 오염물질에 대한 개인이나 집단의 환경에서 노출강 도, 빈도 및 기간을 측정하고 평가하는 과정이다(US EPA, 1997).
실내공기오염의 건강영향을 보다 정확히 분석하기 위해 개인의 하루 24시간의 활동양상에 따라 특정 오염물에 노출되는 양을 측정하는 연구가 필요하며 (Schwab et al.,1990), 실내농도와 시간활동 양상 (Time-activity pattern)을 통해 개인노출을 예측할 수 있다고 보고되고 있다(Noy et al., 1990).
사람은 일반적으로 한 장소에 머물지 않고 계속적 또는 주기적으로 이동하며, 각 개별 장소에서 국소환 경의 유해 공기오염물질 농도가 같이 않기 때문에 시간활동에 의한 총 인간노출(Total human exposure) 의 개념을 도입하게 되었다(Ott, 1995). 인간의 시간 활동 양상에 관한 연구는 다양한 환경 유해인자, 특 히 실내외 공기 오염물질에 대한 노출을 평가하기 위한 위해도 관리의 측면에서 가장 중요한 부분이며, 노출평가 및 예측모델에서 유용하게 적용될 수 있다 (Liu et al., 2007; Sexton et al., 2007).
시간활동 양상은 계절, 날씨, 평일 또는 주말, 도시 화 정도, 연령, 성별, 민족, 유전자 구성, 건강 상태, 비만도, 임신, 수입, 교육, 직장 유무, 직업의 종류, 개인 성향, 주택의 종류, 결혼 여부 등이 영향을 주 는 것으로 알려져 있다(McCurdy & Graham, 2003).
또한, 세계보건기구(WHO)는 인구집단의 실내외 공 기 오염물질의 노출에 대한 건강영향 평가 시 모델 링(Modeling)을 주요 방법 중 한 가지로 인식하고 있 으며, 시간활동 양상은 노출 모델링을 적용할 때 필 수적인 요인이라고 보고하였다(WHO, 2000).
직장인의 경우 직업의 특성에 따라 직업군을 나누어 시간활동 양상을 평가한 후 각각의 실내국소환경에서 의 오염물질 농도를 적용하여 개인의 공기오염물질에 대한 노출수준을 추정 할 수 있다(Lee et al., 2000).
본 연구에서는 2009년 통계청 생활시간조사 자료 를 이용하여, 근로자 인구집단의 시간활동 양상을 분
석하였으며, 대구광역시에 거주하는 사무실 근로자 20명을 대상으로 근로자가 주로 시간을 보내는 국소 환경(주택실내․외, 직장실내)에서의 공기오염물질 (이산화질소(NO2)), 휘발성유기화합물(VOCs(BTEX)) 을 평가하고, 시간활동 양상을 이용한 개인노출 모델 링을 실측값과 비교하여 검증하고자 한다.
Ⅱ. 연구 방법
1. 우리나라 근로자의 시간활동 양상 분석
통계청 2009년 생활시간 조사(Time-use survey) 자 료를 이용하였으며, 조사 참여자(평일 시간활동 조사 24,256명, 주말 시간활동조사 참여자 16,270명)중 근 로자 군집 참여자를 대상으로 시간활동 양상 및 우 리나라 근로자의 집안 및 집밖에서의 행동빈도를 분 석하였다. 또한 대구광역시에 거주하는 사무실 근로 자 20명을 대상으로 설문지를 작성하고, 시간활동일 지를 작성하도록 하여 통계청 결과와 비교 분석하였 다. 직접 조사한 시간활동일지는 통계청에서 사용하 는 일지를 참고하여 일부수정하고 사용하였다. 시간 단위는 오전 0시부터 오전 6시까지는 취침시간을 고 려하여 1시간단위로 작성하도록 하였고, 나머지 시 간은 30분 단위로 작성하도록 하였다.
2. 공기오염물질 측정 및 분석
참여 대상자 20명의 가정 실내외 및 직장실내에서 2012년 9월과 12월에 각각 NO2, VOCs(Benzene, Toluene, Ethylbenzene, Xylene)의 농도를 측정하였다. 측정은 4~5일간 참여자가 거주하는 주택실내·외 및 직장실내에서 NO2(Toyo Roshi Kaisha Ltd.)와 VOCs(OVM #3500 3M) 수동식 시료채취기를 이용하여 측정하였다. NO2의 분석은 Sulfanilic acid 5 g, phosphoric acid(85%) 50 mL 와 NEDA(N(1-naphtyll) ethylene diamine dihydrochloride, 98%) 0.05 g을 이용하여 발색시약(Color reagent) 1 L 를 제조하고, 실리카겔과 활성탄을 연속으로 연결하 여 공기를 챔버(Chamber)로 유입시켜 실내외 공기 오염물질이 없는 상태, 즉 NO2가 없는 상태의 클린룸 (Clean room)안에서 수동식 시료채취기를 분해하여 Cellulose 필터를 시험관에 넣고 앞서 제조한 발색시 약 10 mL를 시험관에 주입하여 밀봉한 후 발색하였다.
이 때 충분히 발색하기까지는 약 40 분가량이 소요되며,
발색된 시약은 UV-visible spectrophotometer(UV-1650, Shimadzu, Japan)로 545 nm에서 분석하였다(Yanagisawa
& Nishimura, 1982).
VOCs 분석은 이황화탄소(CS2) 1.5 mL로 탈착하여 가스크로마토그래피(GC, Turbo Mass Gold, Perkin elmer, USA)로 분석하였고, 표준물질을 GC로 정량하 여 검량선을 작성한 후 식 (1)을 사용하여 농도를 계산 하였다. 검출한계(Limit Of Detection, LOD)는 검출 가 능한 표준용액을 이용하여 7회 분석 후 표준편차의 3배 수(3×표준편차)로 하였다(Daisey et al., 1994). VOCs 중 목적 물질인 벤젠, 에틸벤젠, 톨루엔, 자일렌의 검출한계는 각각 0.34 ppb, 0.04 ppb, 0.04 ppb, 0.25 ppb 이었다.
(1)
W: VOCs의 양(㎍), B: 상수, r: 탈착효율, t: 측정시간(분)
3. 시간가중평균에 의한 노출추정농도와 실측농도 비교
사무실 근로자의 24시간 개인노출을 시간활동 양 상과 측정된 각 국소환경의 농도를 시간가중평균 (Time weight average, TWA)모델에 적용하여 실측한 개인노출과 비교 평가하였다. 시간가중평균 모델은 식(2)로 나타낼 수 있다(Moschandreas et al. 2002).
× (2)
Eij: 개인(i)의 국소환경(j)(ppb) 노출, Fij: 개인(i)이 하루 24시간 동안 국소환경(j)에서 보낸 시간 분율, Cij: 개인(i)이 존재한 각 국소환경에서의 공기오염물 질 평균농도(ug/m3), m: 각 국소환경의 수
Ⅲ. 결과 및 고찰
1. 근로자들의 시간활동 양상 분석
2009년 통계청 시간생활조사에서 근로자 군집 참 여자는 평일 9,194명 및 주말 6,130명이었다. 근로자 의 평일 시간활동을 업종별로 조사한 결과 주택실내 에서 보내는 시간이 농업, 임업 및 어업 조사자가 15.79±3.31 hr로 가장 많았으며, 사무실 근로자인 금
융 및 보험업과 공공행정, 국방 및 사회보장행정 종 사자는 11.32±2.59 hr, 12.11±3.32 hr으로 각각 나타 났다. 회사 및 다른 실내공간인 기타실내에 하루 평 균 머무는 시간은 제조업이 9.28±3.23 hr로 가장 높 았고, 주택실외 및 기타 실외시간은 농업, 임업 및 어업 종사가가 가장 많았다. 그리고 하루 중 이동시 간은 운수업 종사자가 가장 높은 것으로 나타났다 (Table 1).
직장인 군집의 주말 시간활동 양상은 주택실내에 서 보내는 시간이 금융 및 보험업 종사자가 가장 높 았으며(16.46 hr), 기타실내에서 보내는 시간은 숙박 및 음식점 업 종사자가 가장 많은 시간을 보내는 것 으로 나타났다. 주말에도 일을 하는 직업의 특성 때 문으로 생각된다. 주택실외 및 기타실외의 경우도 농 업, 임업 및 어업 종사자가 가장 높게 나타났으며, 이 역시 평일과 주말 구분이 없는 근로의 특성을 보 여주는 것으로 생각할 수 있다. 사무실 근로자인 금 융 및 보험업과 공공행정, 국방 및 사회보장행정 종 사자는 주택실내의 시간이 평일에 비해 약 3~4시간 증가하여, 다른 업종보다 많은 증가율을 보였다 (Table 2). 다른 나라의 경우 일본의 근로자는 주택실 내에서 약 12.5 hr, 기타실내에서 약 9.4 hr을 보내는 것으로 조사된 바 있으며(Lee et al, 2010), 우리나라 의 결과와 비슷한 양상을 나타내었다.
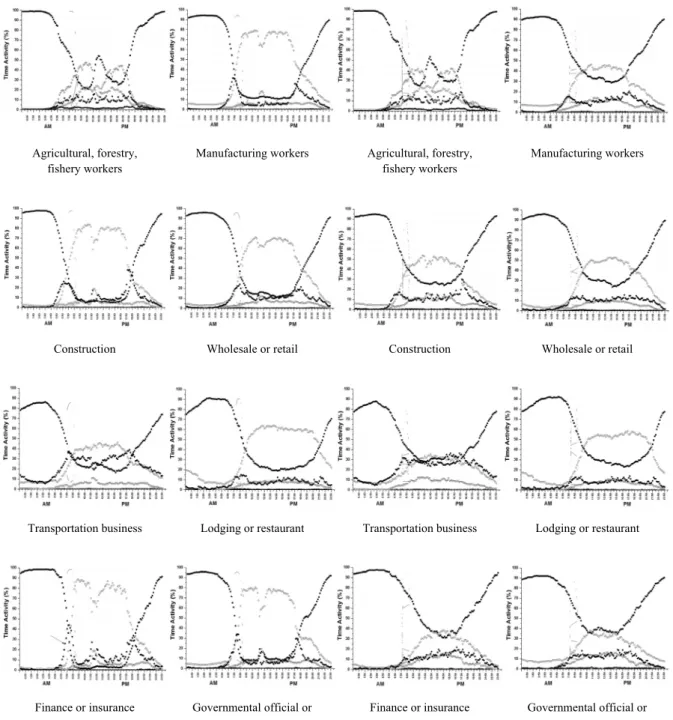
평일과 주말에 대하여 업종별 하루 시간에 따른 활동양상을 Figure 1에 나타내었다. 업종별로 다른 패턴을 나타내었으며, 평일과 주말의 패턴이 업종의 특성에 따라 다른 양상을 보였다.
본 연구에 참여한 사무실 근로자의 시간활동 양상조 사 결과는 여름과 겨울 참여자 중 2명이 변경되었으며, 여름과 겨울 주택실내 재실시간은 각각 11.12±2.20 hr, 12.48±1.77 hr로 겨울에 가정실내 재실시간이 많은 것으로 나타났다. Table 1의 통계청 조사결과에서 사 무직인 금융 및 보험업과 공공행정, 국방 및 사회보 장행정종사자와 평일은 비슷하게 양상을 보였다. 사 무실에서 보내는 시간은 겨울에 비해 여름이 약 1시 간 30분 정도가 높은 것으로 나타났으며, 식당, 술집 등의 가타실내에서 머무는 시간은 여름이 1.77±1.56 hr, 겨울이 2.55±3.35 hr 로 계절별로 차이를 보였다. 또 한, 실외에서 보내는 시간은 여름이 약 8.7%, 겨울이 약 6.4%로 나타났다(Table 3).
Microenvironment Type N Mean S.D.
Confi. interval95% p Post-hoc (<0.05) Lower Upper
Indoor
Residential indoor
Agricultural, forestry, fishery workers(a) 1,308 15.79 3.31 15.61 15.96
0.000
b,c,d,e,f,g,h Manufacturing workers(b) 2,357 11.77 3.24 11.64 11.90 a,d,f
Construction(c) 894 11.49 3.18 11.28 11.70 a,d,f,h
Wholesale or retail(d) 1,926 12.68 3.41 12.53 12.83 a,b,c,e.f.h Transportation business(e) 635 11.62 3.65 11.33 11.90 a,d,f Lodging or restaurant(f) 1,033 12.19 3.49 11.98 12.41 a,b,c,d,e,g Finance or insurance(g) 406 11.32 2.59 11.07 11.58 a,d,f,h Governmental official or manager(h) 635 12.11 3.32 11.85 12.37 a,c,d,g
Other indoors
Agricultural, forestry, fishery workers(a) 1,308 2.18 2.44 2.05 2.32
0.000
b,c,d,e,f,g,h
Manufacturing workers(b) 2,357 9.28 3.23 9.15 9.41 a,d,e,h
Construction(c) 894 9.13 3.16 8.92 9.34 a,d,e
Wholesale or retail(d) 1,926 8.11 3.30 7.96 8.25 a,b,c,e,f,g,h Transportation business(e) 635 5.94 3.72 5.65 6.23 a,b,c,d,f,g,h
Lodging or restaurant(f) 1,033 9.00 3.52 8.78 9.21 a,d,e
Finance or insurance(g) 406 9.13 2.67 8.86 9.39 a,d,e
Governmental official or manager(h) 635 8.83 3.45 8.56 9.10 a,d,e
Outdoor
Residential outdoor
Agricultural, forestry, fishery workers(a) 1,308 0.31 0.67 0.27 0.34
0.000
b,c,d,e,f,g,h
Manufacturing workers(b) 2,357 0.04 0.11 0.04 0.04 a
Construction(c) 894 0.04 0.20 0.03 0.06 a
Wholesale or retail(d) 1,926 0.06 0.16 0.05 0.07 a
Transportation business(e) 635 0.04 0.15 0.03 0.05 a
Lodging or restaurant(f) 1,033 0.07 0.13 0.06 0.08 a
Finance or insurance(g) 406 0.03 0.07 0.02 0.03 a
Governmental official or manager(h) 635 0.06 0.17 0.05 0.08 a
Other outdoors
Agricultural, forestry, fishery workers(a) 1,308 4.22 2.82 4.06 4.37
0.000
b,c,d,e,f,g,h
Manufacturing workers(b) 2,357 1.04 1.44 0.98 1.09 a
Construction(c) 894 0.93 1.01 0.87 1.00 a
Wholesale or retail(d) 1,926 0.99 1.15 0.94 1.04 a
Transportation business(e) 635 0.98 1.12 0.89 1.06 a
Lodging or restaurant(f) 1,033 1.12 1.38 1.03 1.20 a
Finance or insurance(g) 406 0.94 1.13 0.83 1.05 a
Governmental official or manager(h) 635 1.13 1.43 1.02 1.25 a
Transport
Agricultural, forestry, fishery workers(a) 1,308 1.51 1.09 1.45 1.57
0.000
b,c,d,e,g,h Manufacturing workers(b) 2,357 1.88 1.18 1.83 1.93 a,c,d,e,f,g
Construction(c) 894 2.40 1.50 2.30 2.50 a,b,d,e,f,h
Wholesale or retail(d) 1,926 2.16 1.59 2.09 2.24 a,b,c,e,f,g,h Transportation business(e) 635 5.43 3.98 5.12 5.74 a,b,c,d,f,g,h Lodging or restaurant(f) 1,033 1.63 1.17 1.56 1.70 b,c,d,e,g Finance or insurance(g) 406 2.58 1.29 2.46 2.71 a,b,d,e,f,g,h Governmental official or manager(h) 635 1.86 1.13 1.77 1.95 a,c,d,e,g Table 1. Time-activity pattern analysis of workers using time use survey of the Korea National Statistical Office (KNSO) in weekday
Microenvironment Type N Mean S.D.
95% Confi.
interval p Post-hoc (<0.05) Lower Upper
Indoor
Residential indoor
Agricultural, forestry, fishery workers(a) 872 15.91 3.52 15.67 16.14
0.000
b,c,d,e,f Manufacturing workers(b) 1,467 14.81 4.84 14.57 15.06 a,e,f,g,h
Construction(c) 620 14.25 4.96 13.86 14.64 a,e,f,g,h
Wholesale or retail(d) 1,344 14.47 4.29 14.24 14.70 a,e,f,g,h Transportation business(e) 447 12.68 4.73 12.24 13.12 a,b,c,d,g,h Lodging or restaurant(f) 687 13.22 4.29 12.90 13.54 a,b,c,d,g,h Finance or insurance(g) 278 16.46 4.50 15.93 16.99 b,c,d,e,f Governmental official or manager(h) 415 15.67 4.61 15.22 16.11 c,d,e,f,g
Other indoors
Agricultural, forestry, fishery workers(a) 872 2.31 2.67 2.13 2.49
0.000
b,c,d,e,f,g,h Manufacturing workers(b) 1,467 5.69 4.19 5.47 5.90 a,d,e,f,g,h
Construction(c) 620 6.14 4.35 5.80 6.48 a,e,f,g,h
Wholesale or retail(d) 1,344 6.35 3.91 6.14 6.56 a,b,e,f,g,h Transportation business(e) 447 4.72 3.76 4.37 5.07 a,b,c,d,f Lodging or restaurant(f) 687 7.94 4.05 7.64 8.24 a,b,c,d,e,g,h Finance or insurance(g) 278 3.98 3.35 3.59 4.38 a,b,c,d,f Governmental official or manager(h) 415 4.63 3.76 4.27 4.99 a,b,c,d,f
Outdoor
Residential outdoor
Agricultural, forestry, fishery workers(a) 872 0.29 0.58 0.25 0.32
0.000
b,c,d,e,f,g,h
Manufacturing workers(b) 1,467 0.09 0.19 0.08 0.10 a,h
Construction(c) 620 0.07 0.18 0.06 0.09 a,h
Wholesale or retail(d) 1,344 0.09 0.20 0.08 0.10 a,h
Transportation business(e) 447 0.05 0.13 0.04 0.06 a,h,h
Lodging or restaurant(f) 687 0.08 0.16 0.06 0.09 a,h
Finance or insurance(g) 278 0.10 0.17 0.08 0.12 a
Governmental official or manager(h) 415 0.15 0.27 0.12 0.17 a,b,c,d,e
Other outdoors
Agricultural, forestry, fishery workers(a) 872 3.90 2.77 3.72 4.09
0.000
b,c,d,e,f,g,h
Manufacturing workers(b) 1,467 1.40 1.61 1.32 1.48 a,d,f
Construction(c) 620 1.35 1.41 1.24 1.46 a
Wholesale or retail(d) 1,344 1.14 1.28 1.07 1.21 a,b,h
Transportation business(e) 447 1.32 1.56 1.18 1.47 a
Lodging or restaurant(f) 687 1.16 1.31 1.06 1.26 a,b,h
Finance or insurance(g) 278 1.40 1.44 1.23 1.57 a
Governmental official or manager(h) 415 1.60 1.51 1.46 1.75 a,d,f
Transport
Agricultural, forestry, fishery workers(a) 872 1.59 1.18 1.51 1.67
0.000
b,c,d,e,g,h
Manufacturing workers(b) 1,467 2.01 1.66 1.93 2.10 a,f,g
Construction(c) 620 2.18 1.69 2.05 2.32 a,e,f
Wholesale or retail(d) 1,344 1.95 1.56 1.87 2.03 a,e,f
Transportation business(e) 447 5.23 3.93 4.87 5.60 a,b,c,d,f,g,h Lodging or restaurant(f) 687 1.61 1.32 1.51 1.70 b,c,d,e,g,h
Finance or insurance(g) 278 2.07 1.58 1.88 2.25 a,e,f
Governmental official or manager(h) 415 1.96 1.60 1.80 2.11 a,e,f Table 2. Time-activity pattern analysis of worker using time use survey of the Korea National Statistical Office (KNSO) in weekend
Agricultural, forestry, fishery workers
Manufacturing workers Agricultural, forestry, fishery workers
Manufacturing workers
Construction Wholesale or retail Construction Wholesale or retail
Transportation business Lodging or restaurant Transportation business Lodging or restaurant
Finance or insurance Governmental official or manager
Finance or insurance Governmental official or manager
Weekday Weekend
Figure 1. Time Activity pattern of worker in weekday and weekend
■ : Residential indoor
○ : Other indoors
▲ : Residential outdoor
▽ : Other outdoors
◆ : Transport
M±S.D. (%)
(hr) Sum
(%) Range Interquartile range
25% 50% 75%
Summer (n= 20)
Indoor
Residential indoor 11.12±2.20(46.37%)
84.04
4.83-14.75 9.82 11.33 12.50 Office indoor 7.27±3.56(30.29%) 0.38-13.00 4.94 6.50 10.48
Other indoors 1.77±1.56(7.38%) 0.00-5.17 0.42 1.50 3.00
Outdoor Residential outdoor 0.44±0.52(1.85%)
8.72 0.00-1.75 0.00 0.17 1.00
Other outdoors 1.65±2.07(6.87%) 0.00-7.13 0.17 0.75 2.19
Transport 1.74±1.04(7.25%) 7.25 0.17-3.87 0.97 1.46 2.58
Winter (n= 20)
Indoor
Residential indoor 12.48±1.77(52.02%)
86.68
8.80-15.88 11.34 12.50 13.61 Office indoor 5.77±4.44(24.04%) 0.00-12.13 0.31 6.10 10.07
Other indoors 2.55±3.35(10.61%) 0.00-10.83 0.00 1.35 5.14
Outdoor Residential outdoor 0.57±0.76(2.38%)
6.41 0.00-2.60 0.00 0.25 1.07
Other outdoors 0.97±1.00(4.03%) 0.00-3.80 0.29 0.65 1.40
Transport 1.66±2.14(6.91%) 6.91 0.00-9.20 0.52 1.04 1.80
Table 4. Air pollutants concentrations of microenvironment and personal exposure
Type
Residential
indoor Residential
outdoor I/O
ratio
Office
indoors Personal
exposure M±S.D.
(GM) Range M±S.D.
(GM) Range M±S.D.
(GM) Range M±S.D.
(GM) Range
Summer (N=20)
NO2
(ppb)
22.21±6.54 (21.38)
11.64 -39.87
23.63±6.81 (22.78)
9.38 -47.37
0.98
±0.39
24.69±9.50 (23.09)
11.81 -42.75
28.19±9.12 (26.79)
14.02 -49.78 Benzene
(ppb) 1.08±0.59 (0.91) 0.34
-2.51 1.26±0.60 (1.09) 0.34
-2.44 0.86
±0.19 1.53±0.83 (1.30) 0.34
-3.12 1.44±0.67
(1.27) 0.45 -1.27 Toluene
(ppb)
6.12±3.55 (5.40)
2.47 -15.49
8.38±9.93 (5.50)
0.61 -38.86
1.50.±
2.11
15.17±14.12 (9.93)
0.53 -48.29
6.27±4.27 (5.11)
0.41 -21.25 Ethyl benzene
(ppb)
1.00±1.09 (0.74)
0.35 -5.01
1.25±2.29 (0.72)
0.09 -11.03
1.46
±1.26
2.38±2.75 (1.58)
0.40 -10.44
0.74±0.26 (0.69)
0.34 -1.16 m,p-Xylene
(ppb) 1.97±2.31 (1.18) 0.25
-9.15 1.43±1.43 (0.97) 0.25
-6.32 1.85
±1.70 3.58±4.07 (1.27) 0.25
-17.12 1.93±2.66
(1.27) 0.31 -12.24
WInter (N=20)
NO2
(ppb)
24.99±10.80 (22.89)
9.99 -51.91
24.71±6.98 (23.31)
6.42 -33.83
1.07
±0.49
24.75±13.10 (21.75)
9.28 -50.37
21.79±8.69 (20.14)
8.75 -42.08 Benzene
(ppb)
1.98±0.28 (1.97)
1.60 -2.85
1.96±0.18 (1.95)
1.57 -2.41
1.02
±0.15
2.35±0.99 (2.23)
0.99 -6.12
2.14±0.64 (2.08)
1.57 -4.69 Toluene
(ppb)
8.55±5.93 (6.86)
1.25 -26.82
5.69±4.62 (4.15)
0.33 -21.16
1.98
±1.57
14.90±22.24 (9.39)
1.59 -107.81
16.56±24.86 (9.39)
0.66 -119.11 Ethyl benzene
(ppb)
0.84±0.44 (0.75)
0.24 -2.06
0.52±0.21 (0.48)
0.21 -0.93
0.87
±0.41
0.91±0.44 (0.84)
0.40 -2.53
1.09±0.86 (0.86)
0.17 -4.01 m,p-Xylene
(ppb)
1.79±1.27 (1.44)
0.43 -4.87
0.91±0.35 (0.83)
0.26 -1.40
2.09
±1.44
1.91±0.89 (1.71)
0.59 -3.97
2.27±2.41 (1.59)
0.30 -11.20 Table 3. Time-activity pattern analysis of office worker in this study
2. 공기 오염물질의 실내․외 농도
대상 국소환경에서 NO2, VOCs의 농도를 측정하여 분석한 결과를 Table 4에 나타내었다. 여름에 측정한 NO2의 주택실내・외 평균 농도비(I/O)는 0.98±0.39을
나타내었으며, 겨울은 1.07±0.49를 나타내었다. NO2
의 I/O는 실내 발생원이 없는 경우 0.5~0.6이며, 가스 렌지(Gas range) 등의 발생원이 있는 경우 0.8~1.2를 나타내는 것을 고려하면 주택실내 발생원이 있음을
Spearman r
Personal NO2 Personal Benzene Personal Toluene Personal Ethylbenzene Personal m,p-Xylene Indoor
residential
Indoor office
Indoor residential
Indoor office
Indoor residential
Indoor office
Indoor residential
Indoor office
Indoor residential
Indoor office Summer .181
(.434)
.937**
(.000)
.761**
(.000)
.518*
(.016)
.310 (.171)
.514*
(.017)
.628**
(.002)
.276 (.227)
.512*
(.018)
.600**
(.004) Winter .623**
(.003)
.499 (.021)
.341 (.130)
.632**
(.002)
.303 (.182)
.396 (.075)
.621**
(.003)
.627**
(.002)
.757**
(.000)
.483*
(.026)
* : p>0.05, ** : p>0.01
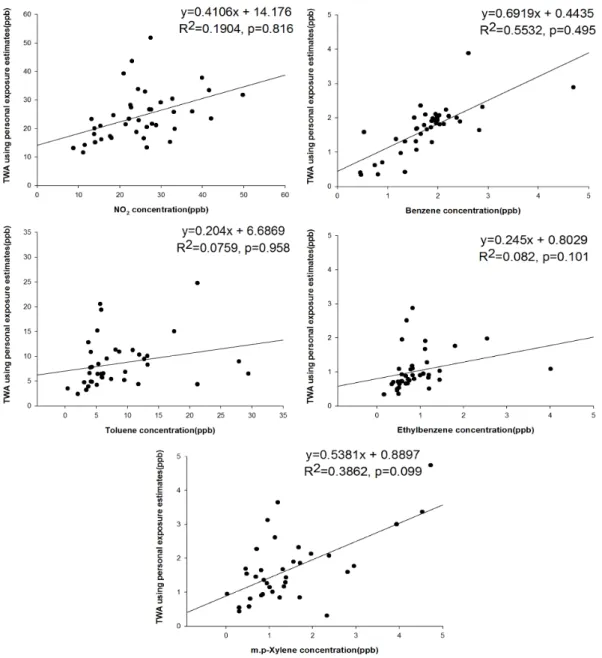
Figure 2. Correlations between estimate and survey of TWA using personal exposure.
Table 5. Correlation among personal exposure and residential indoor & outdoor concentrations in summer and winter
알 수 있다(Yang et al., 2005). 사무실 근로자가 가장 많은 시간을 보내는 가정에서 보내는 시간이 개인노 출에 많은 영향을 주는 것으로 판단된다.
VOCs의 경우 겨울의 에틸벤젠을 제외 하고 모두 I/O가 1이상으로 나타나 실내의 VOCs 발생원이 존 재하는 것으로 판단된다. 특히, 벤젠의 경우 겨울의 실내・외 농도와 여름과 겨울의 사무실 농도가 벤젠 의 대기환경기준(연간 1.5 ppb)을 초과하는 것으로 나타났다. 개인노출의 경우 NO2는 여름에 높은 농도 를 보였으며, VOCs는 모두 겨울에 높은 농도를 나타 내었다. 또한, 각 물질별 실측한 개인노출농도와 직 장인들이 주로 보내는 공간인 사무실 및 가정실내의 국소환경 측정농도와의 상관성 분석 결과를 Table 5 에 나타내었다. 여름과 겨울 개인노출농도는 벤젠의 사무실 농도와 에틸벤젠의 가정실내농도, 자일렌의 사무실 및 가정실내의 농도와 유의한 상관성을 보였 고, 특히 여름의 가정 NO2농도는 개인노출농도와 상 관성이 가장 높은 것으로 나타났다(r=0.937, p<0.01).
3. TWA 농도와 개인노출 비교
본 연구 참여자(사무실 근로자)의 시간활동 양상과 측정된 국소환경의 농도를 TWA모델에 적용하여 예 측한 개인노출농도와 직접 측정한 개인노출 결과를 이 용하여 상관도를 분석한 결과를 Figure 2에 나타내었 다. 모든 물질에서 양의 상관을 보였으나(R2=0.076~
0.553), 통계적으로 유의하게 나타나지는 않았다(p=
0.099~0.958). 이때, TWA에 적용된 국소환경은 가정 실내, 직장실내, 주택실외가 사용되었다. 대학생의 경우 가정 실내․외 농도와 강의실의 농도를 이용하 여 TWA모델로 개인노출 추정이 가능한 것으로 보 고되었으나(Hong et al, 2012), 직장인의 경우 직장인 들의 특성(소득, 학력 등)에 따라 근무 외 활동시간 이 차이가 있으며, 근로자의 노출평가를 위해 직장 외에 술집, 카페, 식당 등의 기타실내와 이동으로 부 터의 노출이 개인노출에 많은 영향을 주는 것으로 생각된다(Lee et al, 2010). 추후 기타실내에 대한 연 구가 좀 더 필요할 것으로 생각된다.
Ⅴ. 결 론
2009년 통계청의 생활시간조사 자료를 이용한 우 리나라 직장인의 평일과 주말의 시간활동 양상을 조
사한 결과 업종별로 다르게 나타났다. 농업, 임업 및 어업 종사자가 집 인근 실외에서 주로 일을 함으로 다른 직종과 많은 차이를 나타내었으며, 평일과 주말 비슷한 양상을 보였다. 기타실내에 하루 평균 머무는 시간은 제조업이 가장 높았으며, 건설업과 금융 및 보험업이 그 다음 높았다. 통계청 조사에서는 직장실 내와 공기 오염도가 높은 것으로 알려진 식당 및 술 집 등의 기타실내에 대한 구분이 없어 이를 이용하 여 노출평가를 실시할 경우 정확도가 낮아질 것으로 생각된다. 또한 벤젠은 사무실, 에틸벤젠은 가정실 내, 자일렌의 경우 사무실과 가정실내의 농도가 개인 노출에 영향을 주는 것으로 유의한 상관성을 띄었으 며, 여름 가정실내의 NO2농도가 개인노출농도와 상 관성이 높게 나타나 하루 중 많은 시간을 보내는 가 정실내와 직장실내에서의 노출이 개인노출에 영향을 주는 것으로 나타났다. 한편, 측정된 국소환경농도를 시간활동 양상을 이용하여 추정한 TWA모델링 값과 개인노출 실측값과의 상관성에서 모든 물질이 양의 상관성을 보였으나, 통계적으로 유의하지는 않았다.
이것은 직장인의 경우 퇴근 이후 식당 및 술집 등에 서의 활동이 개인노출에 영향을 주는 것으로 판단된 다. 많은 시간을 보내는 주택실내와 직장 내에서의 노출 이외에 기타실내에서의 활동양상 및 유해물질 농도의 평가가 필요하며, 추후 추가적인 연구가 필요 할 것으로 생각된다.
시간활동 양상 평가 및 국소환경 측정농도를 이용 한 TWA 모델링 기법으로 사무실 근로자의 공기오 염물질에 대한 노출경향을 파악할 수 있었으며, 다양 한 인구집단의 시간활동을 이용한 개인노출 예측 및 평가에도 활용할 수 있을 것이다.
감사의 글
이 논문은 2013년도 정부(교육과학기술부)의 재원 으로 한국연구재단의 기초연구사업 지원을 받아 수 행된 것임(NRF 2011-0010197).
References
Daisey JM, Hodgson AT, Fisk WJ, Mendell MJ, Ten Brinke J. Volatile organic compounds in twelve
California office buildings: Classes, concentrations and sources. Atmospheric Environment 1994;28(22):
3557–3562
Hong GY, Kim SS, Kim DK, Lee SY, Seo SG et al.
Estimating Personal Exposures to Air Pollutants in University Students Using Time-Weighted Average Model. J Korean Society for Indoor Environ 2012;9(4):
355-365
Lai HK, Kendall M, Ferrier H., Lindup I., Alm S., Hanninen O, Jantunen M, Mathys P, Colvile R, Ashmore MR, Cullinan P. Nieuwenhuijsen M.J.
Personal exposures and microenvironment concentrations of PM2.5, VOC, NO2 and CO in Oxford, UK.
Atmospheric Environment 2004;38:6399-6410 Lee HS, Shuai J, Woo BL, Hwang MY, Park CH et al.
Assessment of Time Activity Pattern for Workers J Korean Soc Occup Environ Hyg 2010;20(2):102-110 Lee KY, Yang WH, Bofinger ND. Impact of
microenvironmental nitrogen dioxide concentrations on personal exposures in Australia. Journal of the Air
& Waste Management Asso 2000;50(10):1739- 1744 Liu W, Zhang J, Korn LR, Zhang L, Weisel CP, et al.
Predicting personal exposure to airborne carbonyls using residential measurements and time/activity data. Atmos Environ 2007; 41(25):5280-5288 Mccurdy T, Graham SE. Using human activity data in
exposure models: Analysis of discriminating factors.
Journal of Exposure Analysis and Environmental Epidemiology 2003;13:294–317.
Moschandreas DJ, Watson J, D'Abreton P, Scire J, Zhu T, Klein W, Saksena, S. Chapter three: methodology of exposure modeling. Chemosphere 2002;49(9):923-946 Noy, D., Brunekreef, B., Boleu, J., Houthuus, D., Koning,
R., 1990. The assessment of personal exposure to nitrogen dioxide in epidemiological studies. Atmospheric Environment 24(12), 2903-2909.
Ott, WR.(1995) Human exposure assessment: the birth of a new science. Journal of Exposure Analysis and Environmental Epidemiology, 5(4), 449-472.
Schwab M, Steven DC, Spengler JD, and Ryan PB.
Activity patterns applide to pollutant exposure assessment: data from a personal monitoring study in Los Angeles. Toxicology and industrial Health, 1990;6(6):517-532
Sexton K, Mongin SJ, Adgate JL, Pratt GC, Ramachandran G et al. Estimating volatile organic compound concentrations in selected microenvironments using time-activity and personal exposure data.
Journal of Toxicology and Environmental Health, Part A 2007;70:465-476
US. EPA(US Environmental protection Agency) Exposure factor Handbook I, General factor, 1997;EPA/600/
P95/002Fa
WHO(World Health Organization), WHO Guideline for air quality 2000;WHO/SED/OEH,Geneva
Yanagisawa Y, Nishimura H. A badge-type personal sampler for measurement of personal exposures to NO2 and NO in ambient air. Environ Int 1982;8;
235-242
Yang WH, Im SG, Son BS. Indoor, outdoor, and personal exposure to nitrogen dioxide comparing industrial complex area with country area. Journal of Environmental Science 2008;34(3):183-187
Yang WH, Lee KY, Yoon CS, Yu SD, Park KH at al.
Determinants of residential indoor and transportation activity times in Korea., Journal of Exposure Science and Environmental Epidemiology 2009;21:310-316 Yang WH, Son BS, Sohn JR. Estimation of source
strength and deposition constant of nitrogen dioxide using compartment mode. Korean Journal of Environmental Health 2005;31(4): 260-265