정부출연연구기관의 기술이전 영향 요인 분석:
국가 R&D 과제 특성을 중심으로
Analysis of the Determinants Influencing Technology Transfer in Government Funded Research Institutes: Focusing on Features of National R&D Projects
김슬기*, 연승민*, 강인제*, 이병희**
과학기술연합대학원대학교*, 한국과학기술정보연구원/과학기술연합대학원대학교**
Seulki Kim([email protected])*, Seungmin Yeon([email protected])*, Inje Kang([email protected])*, Byeong-Hee Lee([email protected])**
요약
공공연구기관들 중 과학기술개발에 핵심적 역할을 담당하고 있는 정부출연연구기관(이하 정출연)은 많 은 연구비와 지식을 보유하고 있음에도 불구하고 기술이전 성과 활용에는 한계를 보이고 있다. 본 논문은 2009∼2013년 사이에 수행된 1,163개의 연구과제 데이터를 기반으로 분석을 실행하였다. 이를 위해 본 논 문에서는 국가과학기술지식정보서비스(NTIS)에 있는 국가 R&D 데이터를 활용하여 정량적 통계분석을 통해 가설들을 검증하였을 뿐만 아니라 논문들과 정성적 비교를 하였다. 분석 결과 특허출원 유,무에 따라 기술이전료에 차이가 있는 것으로 나타났으며, 연구개발단계, 연구자 수 그리고 연구개발비의 다른 범주에 따라 기술이전료에 차이가 나는 것으로 나타났다. 마지막으로 분석에 사용된 변수들 중 특허출원, 연구자 수, 연구개발비의 규모가 기술이전료에 통계적으로 유의미한 관계가 존재하는 것으로 분석되었다. 위에 제 시된 연구결과를 토대로 과제특성을 고려한 정책적 시사점을 제시한다.
■ 중심어 :∣기술이전∣연구개발 단계∣NTIS∣정부출연연구기관∣
Abstract
Among various types of public research institutes (PRI), the government-funded research institutes (GRIs) are having a difficult time in enhancing the efficiency of technology transfer.
This study specifically analyzed 1,163 projects conducted by GRIs from 2009∼2013 to ascertain the determinants that affect technology transfer process. Along with conducting qualitative analysis on relevant researches, we examined the hypotheses by relying on quantitative analysis, using national R&D data from National Science and Technology Information Service (NTIS). As a result of the analysis, we found that whether or not the project generated applied patent, the royalty varied. Also, depending on different R&D development stage, a number of researchers and the amount of R&D funding, the royalty varied. Finally, we derived that out of all the independent variables, a number of applied patents, a number of researchers and the amount of R&D funds can affect the royalty generated from technology transfer. Based on such results we suggest several policy implications.
■ keyword :∣Technology Transfer∣R&D Phase∣NTIS∣Government-funded Research Institute∣
*본 연구는 2016년도 한국과학기술정보연구원의 국가 R&D 정보의 공유/협력 강화로 국가과학기술가치 극대화 사업으로 수행되었습니다.
*This research was supported by “Maximizing the Value of National Science and Technology by Strengthening the Sharing/collaboration of National R&D information” project, funded by Korea Institute of Science and Technology Information (KISTI).
접수일자 : 2016년 07월 11일 수정일자 : 2016년 08월 08일
심사완료일 : 2016년 08월 11일
교신저자 : 이병희, e-mail : [email protected]
I. Introduction
In contemporary society, many scholars around the world are emphasizing the importance of creating a knowledge-based economy, and many developed countries are investing a lot of effort in gaining competitive advantage by capitalizing heavily in R&D.
Following such trend, in the year 2000 Korean government enacted Technology Transfer Promotion Act in order to increase the efficiency of outputs generated from public research institutes1) (PRIs).
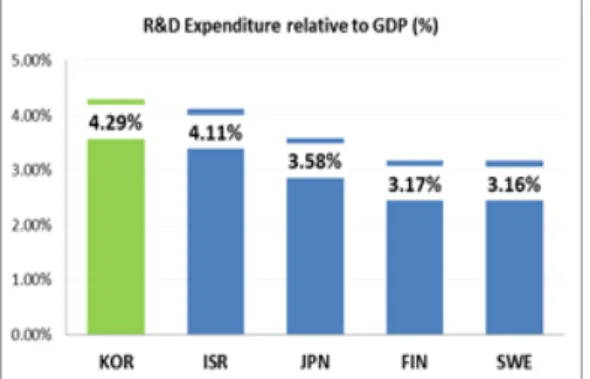
Moreover, as seen in [fig. 1], in 2015 relative to GDP, Korea has invested 4.29% of its total expenditure in R&D, ranking the country in number one spot for spending the most amount of money among all the OECD countries[1].
Fig. 1. 2015 R&D Expenditure OECD countries, oecd.org
Nevertheless, Korea is struggling to fully make use of patents and papers generated from PRIs. Especially government-funded research institutes (GRIs), roughly taking about 4.5 trillion won out of 17 trillion won of the total R&D expenditure along with having
1) Public Research Institute : The term refers to 153 universities (national and private universities) and 148 public research centers (national testing and research laboratories, government-funded research institutes as well as other national research labs).
Source: Ministry of Trade, Industry & Energy
copious amount of knowledge available, are having a difficult time in increasing the efficiency of technology transfer[2]. Moreover, although GRI has greatly contributed in helping Korea to advance in the field of science and technology, there is a continuous demand for the organization to increase the efficiency of investment made in technology development.
However, relative to GRI’s R&D budget, royalty generated from them in the last 10 years is less than 3%[3].
In order to rectify the problems above-mentioned, various R&D programs were implemented and one of well-known system is National Science &
Technology Information Service (NTIS). In specifics, NTIS’s primary purpose is to systematically monitor the efficacy of the entire national R&D projects as well as encourage one to increase the number of output and outcome. In addition, it provides a wide range of information from R&D planning to status of individual researcher’s project. To further explain, the information provided by NTIS enables an individual to openly access the entire national R&D cycle as well as the progress of various national R&D projects.
Moreover, starting from 2008, NTIS has been amassing data and information by offering one stop service system providing numerous refined data regarding national R&D project[4].
Like this, Korean government has been applying various policies and methods in order to increase the usage of knowledge available in PRIs. Moreover, it is extremely crucial to expand the usage of patents and paper generated from PRIs, as well manage the intangible assets emerged from them as they can help a nation to gain competitiveness as well as help the nation to establish creative economy[5].
Accordingly, via NTIS, this study specifically selects Korea’s GRI as a subject of analysis. In details, 1,163 data from 2009 to 2013 were selected as
final samples for this analysis. The purpose of the test is to verify the determinants that affect technology transfer process. We thought this experiment would be meaningful since, it is evident that the productivity of technology transfer in GRI is insufficient. In addition, not a lot of preceding researches rely on up-to-date quantitative national R&D data to analyze GRI as their main subject of analysis.
Ⅱ. Preceding Research
Lee and Kim[12] investigated 668 of R&D project called, “Competitiveness Enhancement of the Parts and Materials Industry” from year 2000 to 2012. To conduct the experiment they divided the determinants that affect technology commercialization process into national R&D projects, type of institution, research performance, project structure and researcher’s competency and technical field to accomplish the study objective. By using logit statistical method they concluded that patent, scale of government R&D expenditure, and technical field etc. influence the technology commercialization process. However, competency of researcher showed no relevancy towards technology commercialization process.
Min and Kim[13] conducted a survey on businesses that received technologies from 16 research universities and 13 PRIs that were part of ‘Connect Korea’ program. Out of 5,411 surveys collected, 684 responses were selected as final samples to be used in statistical analysis. For investigation, technology transfer or commercialization model was divided into three categories, technology provider’s ability in transferring technology, technology intermediator’s role in creating a value, and technology licensee’s absorptive capacity. The test was conducted in order
to determine whether the factors aforementioned influence the success or failure of technology commercialization. The result showed that in order for a business to implement the technologies, active participation from the inventor during the process of transfer is imperative. Moreover, there needs to be an improvement in contractual agreement where intermediator can enable one to apply the technologies in places that are necessary.
Khayat[14] aims to find relevant factors that influence technology transfer by analyzing Republic of the Philippines’ food processing industry. Out of 300 surveys 157 of surveys were employed for statistical analysis to draw factors that affect technology transfer process. The study specifically used VARIMAX rotation with principle axis factor analysis to examine the collected data. From the analysis it was recognized that namely, relation building and technology transfer value added were two areas that highly effect technology transfer process in food processing industry.
Nah et al.[15] relied on data provided by “Higher Education in Korea” to investigate the factors that affect technology transfer and commercialization process. What is interesting about this test is the fact that the researchers looked at the causal relationship between universities’ competency and technology transfer or commercialization outcome, and between university competency and start-up outcome respectively. The test utilized 154 data sets provided by Higher Education in Korea and relied on multiple regression statistical method. From the analysis, it was noticed that number of full-time professor, patent applications and retention of technology holding company could have positive effect in technology transfer. For startups, however, providing incessant education and number of personnel in technology licensing office (TLO) showed significance in
Researcher Subject of Analysis Results
Lee and Kim[12]
National R&D project, Competitiveness Enhancement of the Parts and Materials Industry (2000~2012)
Patent(+) scale of government R&D expenditure(+) and technical field(+) etc.
Min et al.
[13]
16 research universities and 13 public research institutes from Connect Korea program
Active participation from the inventor is crucial
Nah et al.
[15]
Collected data from “Higher Education of Korea” to investigate the causal relationship between university competency factors and technology transfer · commercialization / Start-up
Technology transfer: number of full-time professor(+), applied patent(+)
Start-up: Education(+),TLO personnel(+)
Kim et al.[16]
Analyzed factors that affect technology transfer in Universities, government research institute and industry using NTIS (2007~2012)
technology transfer outcome (Royalty):
R&D funds (+), government research institute-location (+)
technology transfer outcome (number of cases): government research institute, universities-development stage of R&D(+), industry-applied (+)
Khayat[14] Technology transfer of philippines food processing industry, 125 survey
building relationship between transferee and transferor is important, increasing transfer value added
Audretsch et al.[26] Analyzed Key notes and selection of papers, Technology Transfer Society in 2011
global network important, focus on intellectual property rights, focus on policies regarding entrepreneurship
Table 1. Preceding research and result
technology transfer. Interestingly, there were no common competency factors between technology transfer and startup.
Kim et al.[16] extracted 1,222 data from 2007∼2012 using NTIS to perform analysis on factors that affect technology transfer. The primary subjects were universities, government research institute and industry. They utilized multiple regression analysis and analysis of variance to conduct the empirical study. When royalty was used as dependent variable it was recognized that the common factor that positively influenced all three subjects was R&D funds. Based on the results, they suggest that endowing universities to conduct autonomous research is necessary. In addition for government research institute, it would be beneficial to concentrate in areas like Seoul and Daejeon to reinforce and expand science technology R&D.
Audretsch et al.[26] analyze keynotes and selection of papers from Technology Transfer Society in 2011 to stress the importance of global network and technology transfer. The study suggests that it is
important to focus on international intellectual property rights and policies related to entrepreneurship. Also, the study stresses the importance of universities at a country level as they can act as mediator for new entrepreneurial ventures to further develop, explore and employ ideas that can eventually be transform into social and economic initiatives. Moreover, it suggests that forming global network and cluster is important at the regional level in order to establish global innovation networks.
Through such initiatives they believe policy makers can provide feasible response by better comprehending the formation process of international networks.
In this paper, we identify the determinants that influence technology transfer process by selecting GRI as the main subject of the analysis. We thought this experiment would be meaningful since not a lot of preceding researches have conducted studies selecting GRI as their focus of study. Moreover, even though GRIs are using roughly about 44% of government R&D fund, relative to total R&D budget, the technology transfer rate is less than 3%[17].
Furthermore, previous studies either selected research university or one of the small medium enterprises as their primary subject. In addition, many empirical literatures used either surveys or case studies in order to manage their experiment. However, our goal is to draw objective and scientific conclusions by relying on quantitative national R&D data provided by NTIS. In specifics, we depend on t-test, one-way ANOVA and logistic regression statistical methods to analyze the quantitative data.
III. Empirical Analysis
1. Definition of Technology Transfer Commercialization
A myriad of researchers around the world has been recognizing the importance of increasing the efficiency of technology transfer and open innovation.
In addition, they continuously invested a lot of effort in diffusing the theories related to technology transfer and commercialization. However, depending on individual researcher’s background and field of research, the definition of technology transfer can vary. In other words, the meaning of technology transfer can be used differently.
This research specifically focused on technology supplier’s2) side by investigating the technology transfer activities specifically geared towards one of the types of PRI, GRI. When GRI was first established in 1960’s its primary role was to collect knowledge, as well as promote cooperation between domestic and international research institutions.3) In addition, for over 50 years GRIs greatly contributed in
2) Technology Supplier : The term refers to universities and public laboratories, such as government funded research institute.
Source: Korea Institute for Industrial Trade
3) Source: M. H Lee, “Redesigning New Role and Management System of Government Supported Research Institutes, Science and Technology Policy Institute, 2012
developing field of Korea’s science and technology.
However, today as many conglomerates' R&D capacity exceeded R&D capability of PRIs, increasing the efficiency of retained technologies within GRIs became crucial. Moreover, due to constant increase in public R&D funds, government began to pressure GRIs to generate technologies that has both public and commercial value. This way it would be possible for GRIs to create a virtuous cycle of technology transfer and technology commercialization. Hence we thought it would be worth examining the factors affecting technology transfer specifically targeting GRI.
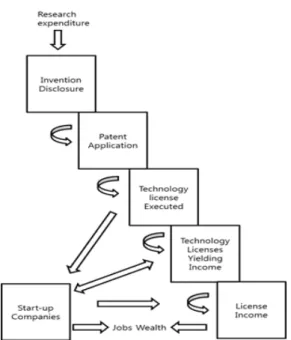
It is important to understand the process of technology transfer. [Fig. 2] describes the general technology transfer practice of research universities by dividing the process into several steps[6]. The initial stage, “invention disclosure” is when affiliated researcher discovers and delivers the innovative technologies generate to TLO. Next, the technology gets patented which grants intellectual property rights to the research university. Then, either an organization or individual obtains the patented technology from the university. Final step includes activities where the licensees can make use of the technology by producing income.
Bercovitz et al.[25] analyzed the causal relationship between technology transfer performance and university organizational structure. They extrapolate that technology transfer involves activities that processes, licenses invention introduced from universities by relying on resources generated from TLO.
Chesbrough[7] was the one who first coined the term ‘open innovation’. It is an activity where it encourages the usage of ideas, knowledge and technologies introduced from research universities and research institutes. The primary purpose of open innovation is to lower the costs that are incurred
Fig. 2. Technology Transfer by Rogers et al.
revised
during innovation process as well as increase the value of technology and efficiency of technology transfer process. Moreover, the study posits that innovation is the primary key in designing a business model as well as a source that can bring about success in technology transfer or commercialization.
In order to implement open innovation there needs to be an increase in number of licenses that are transferred to the industry.
Lim and Lee[8] provide both broad and narrow definitions that describe technology transfer and commercialization process. The theory based on the former describes the entire cycle of technology transfer process from technology transfer to manufacturing of final product. The latter simply describes a process that transfers knowledge and expertise from one organization to another.
Friedman et al.[9] primarily focus on PRI extrapolating that technology commercialization occurs when PRIs transport inventions and
intellectual properties to non-profit organizations.
Hwang and Jung[10] focused on narrow explanation of technology transfer by setting the definition as a process that involves series of processes that allow the technology holders to convey technology related knowledges to technology user.
Research and Business Development (R&BD) is a comprehensive term that describes both technology transfer and technology commercialization process. In addition, looking into the entire cycle of technology transfer process from the perspective of technology innovation, it includes activities that transfers, deals and diffuses technologies generated from the research[10].
Like this, based on preceding researches technology transfer or commercialization process can include wide range of activities. In specifics, some separate the meaning of technology transfer and commercialization process where as some argue that there are overlaps between technology transfer and commercialization process. In this research, we will focus on the narrow definition of technology transfer by stating that technology transfer is a chain of process where knowledge and technology are transferred from technology suppliers to technology users.
2. Research Method and Data
The main goal of this research is to investigate the factors that affect technology transfer process. Thus, we thought it was ideal to use NTIS, a system where it provides information regarding national R&D projects. In order to conduct the analysis we have extracted projects led by ex-Ministry of Education Science and Technology, ex-Ministry of Knowledge Economy and present Ministry of Science, ICT and Future Planning. We specifically extracted data from year 2009 to 2013. Furthermore, total of 19 GRIs were
used for this analysis. As above-mentioned, 1,163 data was used in this experiment. This test uses three primary methods, t-test, one-way ANOVA, and logistic regression analysis. First t-test was employed in order to examine if there would be a difference in amount of royalty generated from technology transfer depending on whether or not the project generated patent and SCI paper. Next for one-way ANOVA, we checked to see if depending on the category of R&D development stage, number of researcher, and amount of R&D there would be a difference in royalty. For one-way ANOVA we also conduced post-hoc test called T-Dunnett. T-Dunnett is one of the post-hoc test methods used when the significance level is less than 0.05. In addition, Levene’s test was used to check for equal variances.
Levene’s test allows one to reject the null hypothesis if the significance level is less than 0.05.
3. The Variables
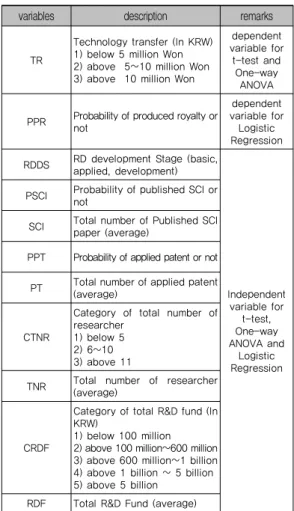
To conduct t-test and one-way ANOVA we divided the royalty into below 5 million won, above 5 million won to 10 million won, and above 10 million won. For logistic regression analysis, we looked at whether they generated royalty or not. Moreover, we divided R&D development stage into basic, applied and development and analyzed if there is a significant difference in technology transfer outcome. Then for SCI we have divided the data based on whether they published SCI or not. Next, we divided the figures based on whether they generated patents or not. To find out if there is any relationship between royalty and number of researchers involved in R&D projects conducted by GRI, we divided the total number of researchers into below 5, 6 to 10 researchers, and above 11 researchers. Lastly, to see if there is any link to technology transfer and R&D fund we have divided the total R&D funds invested into below 100
million, above 100 million to 600 million, above 600 million to 1 billion, above 1 billion to 5 billion and above 5 billion won. For logistic regression analysis, except for R&D phase, we used average number of SCI, applied patent, researcher and R&D funds. The definition used to conduct the analysis is summarized in [table 2].
Table 2. Definition of Variables
variables description remarks
TR
Technology transfer (In KRW) 1) below 5 million Won 2) above 5∼10 million Won 3) above 10 million Won
dependent variable for
t-test and One-way
ANOVA
PPR Probability of produced royalty or not
dependent variable for
Logistic Regression RDDS RD development Stage (basic,
applied, development)
Independent variable for
t-test, One-way ANOVA and
Logistic Regression PSCI Probability of published SCI or
not
SCI Total number of Published SCI paper (average)
PPT Probability of applied patent or not
PT Total number of applied patent (average)
CTNR
Category of total number of researcher
1) below 5 2) 6~10 3) above 11
TNR Total number of researcher (average)
CRDF
Category of total R&D fund (In KRW)
1) below 100 million 2) above 100 million∼600 million 3) above 600 million∼1 billion 4) above 1 billion ∼ 5 billion 5) above 5 billion
RDF Total R&D Fund (average)
4. Hypothesis and model
4.1 Research ActivitiesAs aforementioned many researchers vigorously strived to find ways to upsurge the efficiency of technology transfer.‘Metal Innovation and Technology
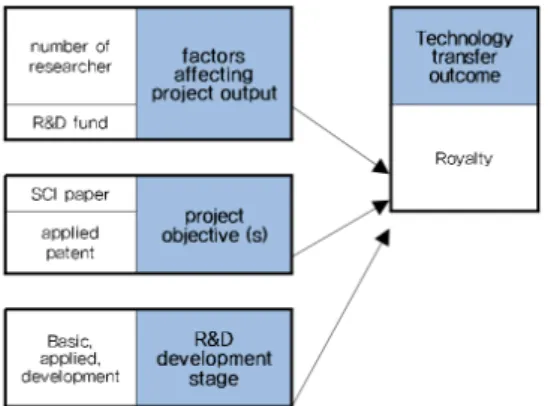
Transfer Centre’ in U.S, researchers rely on number of registered patents, number of start-up companies, number of licensed technologies, and license income to quantitatively measure the efficiency of technology transfer and commercialization[18]. Hence based on preceding researches we have come up with the model mentioned below [fig. 3].
Fig. 3. Model based on feature of R&D projects
Kwan et al.[19] studied R&D project called “21st Century Frontier R&D Program.” They specifically determined the factors that influence the project outcome. They too examined whether there is a noteworthy difference in project outcome between basic, applied and development research. Also, Ngoie[20] relied on Marshallian Macroeconomics Model to compare the return on federal funds and the result showed that among basic, applied and development research, applied research had far better technology transfer outcome than basic or development research. In this test, we examined to see if different stage of R&D; basic, applied, development can have different effect in technology transfer outcome. Based on such theories we have come up with the following hypotheses.
H1a: Depending on the R&D development stage of projects in GRI (basic, applied, development
research), there will be a difference in royalty.
H1b: R&D development stage (basic, applied, development research) of the projects can have an effect on Royalty.
4.2 Output from GRI
Kim and Park[21] used multiple regression analysis to examine how competency of university and 6T (IT, BT, CT, NT, ST, ET) can affect the technology commercialization process. From the test it was determined that total number of personnel and number of applied patents can have positive (+) effect in technology transfer process. However, non-SCI paper and SCI paper did not have positive (-) influence on technology commercialization. In addition, Song[11] used logit model to determine the factors that affect technology transfer process. They divided the R&D projects into types, scale of R&D fund, and outputs. The result showed that SCI paper does not affect technology transfer (-) whereas applied patents can have positive (+) influence . Kim and Lee[24] investigated 61 universities using multiple regression analysis to see the causal relationship between the determinants that affect the capacity of the university as well as the output of collaborative research between industry and university. To implement the research, they used number of technologies licensed, royalty and number of spin-offs as dependent variables and SCI, domestic patent and international patent etc. as independent variables. From the analysis there were various results. In details, number of technologies licensed and royalty showed positive relationship with SCI and patents. However, the spin-off did now show any positive relationship with any of the determinants.
Based on those researches we have come up with the following hypotheses.
H2a: Depending on whether projects from GRI published SCI paper or not, there will be a difference in royalty.
H2b: Total Number of SCI published within GRI will have an effect on royalty.
H3a: Depending on whether GRI projects generated applied patent or not, there will be a difference royalty.
H3b: Total Number of applied patents generated within GRI will have an effect on royalty.
4.3 Research Environment
There are a lot of preceding researches that attempt to measure and determine the efficiency of government R&D funds with the output and outcome.
Shim and Kim[22] employed NTIS R&D data to manage such experiment. In details, they divided the inputs into three categories, which are, for socio-economic purpose, number of papers depending on state of collaboration between the industry, research institutes and university and main agents conducting the research. To determine the relationship between the outputs and inputs using multiple regression analysis, they divided the outputs into number of patents, number of papers, royalty and number of commercialization. Moon[23] specifically selected basic research projects from National Research Foundation of Korea to investigate the relationship between R&D inputs and outputs. To conduct the experiment she relied on correlations coefficient test, one-way ANOVA and logistic regression analysis. Variables such as, outputs from R&D, R&D funds, total number of researchers, total research period were used. Based on such theories we thought it was important to investigate the relationship between technology transfer outcome and research environment. Thus, we have come up with such hypotheses below.
H4a: Depending on the number of researchers participating in the project there will be a difference in royalty.
H4b: Total Number of researchers participating in the project will have an effect on royalty.
H5a: Depending on the amount of R&D funds, there will be a difference royalty.
H5b: Total number of R&D funds will have an effect on royalty.
5. Empirical Results
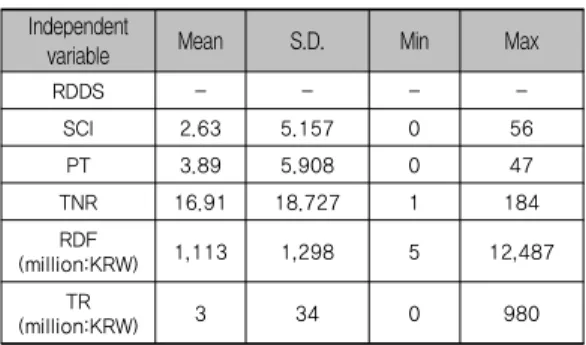
[Table 3] is a descriptive statistic of the sample used in this analysis. As seen in the table, the average number of SCI papers was less than the number of applied patents. To be specific, average number of SCI was around 2.63 and average number of applied patent was around 3.89. This means that GRIs focus more in generating applied patents then publishing SCI papers. Moreover, the highest number of researchers involved in the project was 184 and the highest amount spent on the project was approximately around 12.48 billion won. Moreover, the greatest amount of royalty generated from technology transfer was around 980 million won.
Independent
variable Mean S.D. Min Max
RDDS - - - -
SCI 2.63 5.157 0 56
PT 3.89 5.908 0 47
TNR 16.91 18.727 1 184
RDF
(million:KRW) 1,113 1,298 5 12,487
TR
(million:KRW) 3 34 0 980
Table 3. Descriptive Statistic
Variable N (%) Royalty
t p
Mean±SD
PPT=Y 388
(33.4) 1.03±.202
-2.576 .010
PPT=N 775
(66.6) 1.06±.287
Total 1,163
(100.)
Table 7. Comparing Difference in Technology Transfer Outcome Depending on Retention of Patent
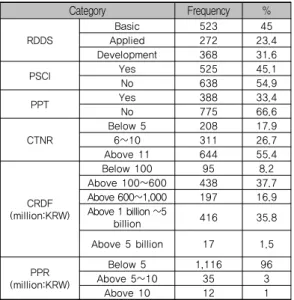
Category Frequency %
RDDS
Basic 523 45
Applied 272 23.4
Development 368 31.6
PSCI Yes 525 45.1
No 638 54.9
PPT Yes 388 33.4
No 775 66.6
CTNR
Below 5 208 17.9
6∼10 311 26.7
Above 11 644 55.4
CRDF (million:KRW)
Below 100 95 8.2
Above 100∼600 438 37.7
Above 600∼1,000 197 16.9
Above 1 billion ∼5
billion 416 35.8
Above 5 billion 17 1.5
PPR (million:KRW)
Below 5 1,116 96
Above 5∼10 35 3
Above 10 12 1
Table 4. Frequency Analysis of Variables
[Table 4] is the frequency table of the variables used in this analysis. First from looking at the statistics of R&D development stage, it was noticed that about 45% of the research conducted from GRIs are geared towards basic research. Moreover, roughly around 55% of the projects did not generate SCI during the research. However, unlike SCI, it was noticed that majority of the projects generated applied patents, roughly around 66% out of the total. Looking at the number of researcher, it was recognized that majority of the projects involved above 11 researchers when operating a research.
5.1 t-test and One-way ANOVA
First, using statistical analysis we examined whether there is a difference in royalty depending on the development stage of R&D. From the analysis, it was noticed that different stage of R&D did show significance with the p-value of .013. Out of the three stages, it was noticed that development stage has the greatest influence in royalty.
Variable R&D phase
Mean (M) S.D.
RDDS
Basic 1.03ª .193
Applied 1.05ab .364
Development 1.09b .256
F-value (p) 4.346***(.013)
Table 5. Comparing Difference of Technology
Transfer Outcome Depending on the Stages of R&D phase
*p<.05,**p<.01,***p<.001 T-Dunnett a<b<c
Secondly we used SCI, one of the outputs from research as one of the independent variables. To determine whether there is difference in royalty, we have divided the projects into those who generated SCI and those who did not generate SCI. The statistical analysis did not show any significance.
Thus the null hypothesis was accepted.
Variable N (%) Royalty
t p
Mean±SD
PSCI=Y 525(45.1) 1.04±.262-.816 .415 PSCI=N 638(54.9) 1.06±.263
Total 1,163(100.)
Table 6. Comparing Difference in Technology Transfer Depending on Retention of SCI Papers
*p<.05,**p<.01,***p<.001
Next, we have examined whether generating applied patent or not will have a different effect on royalty. From the analysis it was recognized that with the p-value .010, there is a significant difference in royalty.
*p<.05,**p<.01,***p<.001
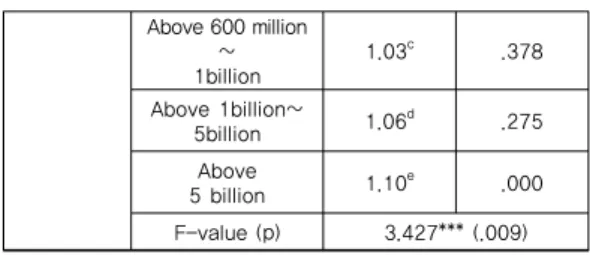
Variable Total amount of R&D funds Mean (M) (S)D
CRDF (KRW)
Below 100 M 1.00ª .103
Above 100 million
∼ 600 million
1.01b .206
Table 9. Comparing Difference in Technology Transfer Depending on Amount of R&D Funds
Above 600 million
∼ 1billion
1.03c .378
Above 1billion∼
5billion 1.06d .275
Above
5 billion 1.10e .000
F-value (p) 3.427*** (.009)
To see if there is any difference in royalty depending on the number of researchers involved, we have categorized the variable into three groups, below 5, 6∼10 and above 11 researchers. For this test we only considered researchers with masters and Ph.D.
degree. The result of the analysis showed that there is a significance difference between the three groups with the p-value of .005, which means that royalty can vary depending on the number of researcher.
Moreover, having above 11 researchers had the greatest influence on the royalty.
Variable Total number of Researcher Mean (M) S.D.
CTNR
Below 5 1.01ª .120
6∼10 1.03ab .218
Above 11 1.07b .309
F-value(P) 5.420***(.005)
Table 8. Comparing Difference in Technology
Transfer Outcome Depending on Number of Researcher
*p<.05,**p<.01,***p<.001 T-Dunnett a<b<c
Lastly, we have divided the total R&D funds into below 100 million won, above 100 million to 600 million won, above 600 million won to l billion won, above 1 billion won to 5 billion won, and above 5 billion won. From the analysis, it was noticed that there is a difference in royalty with p-value of .009. In addition, it was recognized that investing above 5 billion won had the greatest effect in technology transfer outcome.
*p<.05,**p<.01,***p<.001 T-Dunnett a<b<c<d<e
5.2 Logistic Regression Analysis
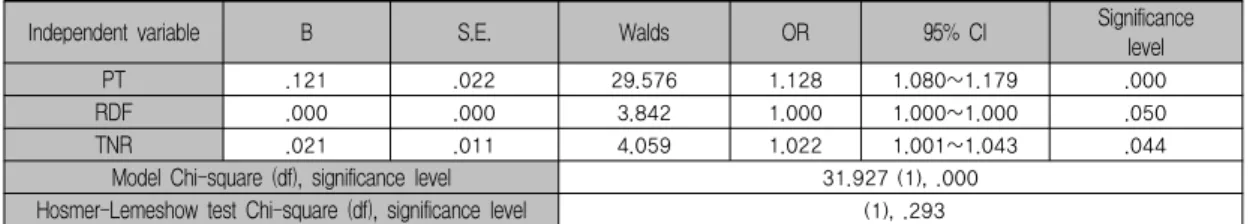
The estimated model equation designed for this analysis is mentioned below (1). As a dependent variable, we have used royalty generated from technology transfer. In specifics, we have divided the dependent variable into projects that generated royalty from the projects that have not. For independent variables, we have used R&D development stage, average number of SCI, average number of applied patent, average number of researchers and average amount of R&D funds. To generate the best model we have used backward likelihood ratio test (LR) to get rid of the independent variables that has the smallest chi-square value. First from the test, Nagelkerke’s R² was around .094.
Moreover, in order to see the goodness of fit for the entire logistic regression model, we’ve conducted Hosmer and Lemeshow test and from the analysis the significance level around .293 which allows the model to accept the null hypothesis. In addition, from comparing predictive value and observed value the model’s accuracy was around 96%.
The result showed that R&D development stage did not have any significant effect on royalty . In addition, from the analysis it was discovered that SCI papers did not show significance compared to other variables. Thus, we eliminated the two variables from the model. This result is similar to Kim and Park’s analysis. They conducted a test focusing primarily on universities to increase the efficiency of technology valuation process. From the test, it was discerned that
Independent variable B S.E. Walds OR 95% CI Significance level
PT
.121 .022 29.576 1.128 1.080∼1.179 .000RDF
.000 .000 3.842 1.000 1.000∼1.000 .050TNR
.021 .011 4.059 1.022 1.001∼1.043 .044Model Chi-square (df), significance level
31.927 (1), .000Hosmer-Lemeshow test Chi-square (df), significance level
(1), .293
(1)
Table 10. Result of Logistic Regression Analysis
SCI papers did not show any significant relationship with technology transfer outcome. Moreover, when Lee and Kim studied “Competitiveness Enhancement of the Parts and Materials Industry” they divided the variables into non-SCI and SCI. Interestingly this analysis also concluded that both non-SCI and SCI do not cause any significant effect on technology transfer[21][12].
Next, we looked at whether number of patents generated from GRI can affect technology transfer process or not. The analysis showed that patents could have 1.128 times more of an effect in royalty at a significance level of .000 compared to other variables used in the model. Next, R&D funds showed that compared to other variables, it could have 1.000 times more of an influence on royalty at a significance level of .050. This result is similar to Shim and Kim[22]
where they investigated the causal relationship between R&D funding and publication of SCI papers using regression analysis. This test also stated that R&D funding could have a positive influence towards outcome of R&D projects. Lastly, from looking at the total number of researcher, it was recognized that compared to rest of the variables having more researchers could have 1.022 times more of an effect in royalty at significance level .044. The result of logistic regression analysis is summarized in [table 10]4).
Category Statistical Significance
Hypothesis accepted or rejected
H1a + Accepted
H1b - Rejected
H2a - Rejected
H2b - Rejected
H3a + Accepted
H4b + Accepted
H4a + Accepted
H4b + Accepted
H5a + Accepted
H5b + Accepted
Table 11. Result of hypothesis testing
[Table 11] summarizes the results of the analysis demonstrating whether each hypothesis was accepted or rejected based on t-test, one-way ANOVA, and logistic regression analysis. We designed total of 10 hypotheses, and from the hypotheses, we rejected 3 hypotheses and accepted 7 hypotheses.
6. Summary of Empirical Analysis
From one-way ANOVA, it was determined that depending on different stage of R&D the amount of royalty can vary. This test also showed that GRIs are strong at generating efficient technologies that are geared towards development research. However from logistic regression analysis, R&D development stage
4) In the beginning of the analysis all 5 variables were used in the logistic regression analysis. However backward likelihood ratio test eliminated SCI papers and R&D development stage variables for having the smallest chi-square value. Thus [table 10] only includes 3 variables.
did not have an effect in generating royalty. Hence, in the future, it is crucial to implement a policy that can enhance the productivity of basic and applied research in GRI to avoid inefficiency of IPs. Next, from both t-test and logistic regression analysis, SCI papers did not show any significant effect in royalty. The primary reason for publishing SCI paper is for researchers to disclose their results as well as get an official approval of their research progress. Moreover, SCI paper is published mainly for academic purposes.
Due to such reasons, we believe that SCI papers do not positively influence technology transfer. However, number of applied patents, number of researchers and amount of R&D funds showed a significant effect on the royalty. This means that it is crucial for GRIs to generate applied patents to increase the outcome of technology transfer. Patents not only protect researcher’s invention, it is related to the incentives that they receive from the royalty. However, we have to keep in mind that due to current project based system; many researchers tend to focus on meeting the criteria for obtaining R&D funds instead of concentrating on generating technologies for commercial purposes. Thus, it is important to implement better management system to reinforce the role of TLOs in order to maximize the efficiency of IPs available within GRIs. Next, it was recognized that the number of researcher and providing R&D funds can help the institutions to increase the amount of royalty. Hence, government should come up with a policy for GRIs to better manage the pool of labor as well as distribute the right amount of R&D funding into the project. This way, GRIs can introduce technologies that can be utilized for generating profits as well as establish a virtuous cycle of technology transfer process.
Ⅵ. Conclusion
In knowledge-based society, many researchers are seeking to determine factors that can spur the technology transfer and commercialization process.
This test primarily focused on determining the factors that affect technology transfer outcome in GRIs. To conduct the test, we have built hypothesis based on preceding researches and have relied on quantitative R&D data provided by NTIS. To be specific, we extracted data from 2009-2013 and utilized 1,163 data to conduct the analysis. Then to verify the hypotheses, this study utilized t-test, one-way ANOVA, and logistic regression analysis. The result showed that applied patent, number of researcher, and R&D funds are statistically significant. Based on the analysis we suggested that generating more applied patent is imperative as it can protect researchers’
rights as well as help the institute to increase the efficiency of technology transfer. Moreover, increasing R&D funds and number of researchers are beneficial since they can create a stable research environment which in turn can generate more royalty.
The drawback of this research is the fact that currently the system obliges researchers to register and report national R&D data voluntarily. Thus, the information provided by NTIS regarding technology transfer can lack a little credibility. Moreover, in the future research it needs to include additional data from 2014 to provide a more up to date information as well as include more variables that may affect technology transfer outcome. The reason why this test did not include 2014 data was because the confirmation regarding analysis of investigation on R&D data occurred after this test completed the analysis.
참 고 문 헌
[1] Organisation for Economic Co-operation and Development, http://www.oecd.org
[2] National research council of science and technology, http://www.nst.re.kr
[3] C. H. Choi, Korea Institute of Science &
Technology Evaluation and Planning Issue Paper, 2011-19.
[4] M. S. Kim, A Study on Efficiency Plan of
Technology Transfer of National R&D Projects, Science and Technology Management
policy, University of Science and Technology, 2015.[5] K. J. Lee and S. S. Kim, Korea Institute of
Science & Technology Evaluation and Planning Issue paper, Vol.2015, No.05, 2015.
[6] E. M. Rogers, S. Takegami, and J. Yin, Lessons
Learned about Technology Transfer,
Technovation, 2001.[7] H. Chesbrough, W. Vanhaverbeke, and J. West,
Open Innovation: Researching a New Paradigm, Oxford University Press, p.373, 2006.
[8] C. Y. Lim and Y. J. Lee, “An Analysis for Success Factors of Technology Transfer,”
Science & Technology Evaluation and Policy Institute, Vol.11, pp.1-183, 2007.
[9] J. Friedman and J. Silberman “University Technology Transfer: Do Incentives, Management, and Location Matter?,” Journal of Technology Transfer, Vol.28, pp.17-30, 2003.
[10] H. D. Hwang and S. Y. Jung, “Ways to spur the technology transfer process: Focusing specifically on researcher K,” Korea Technology Innovation Journal Vol.18, No.2, pp.318-337, 2015.
[11] J. K. Song, Science and Technology Policy
Institute, Vol.21, No.3, 2011.
[12] S. J. Lee and T. Y. Kim. “A Study on Determinants of National R&D projects: With the Focus on the National R&D for the Competitiveness Enhancement of the Parts and Materials Industry,” Journal of Korea Technology Innovation Society, Vol.18. No.12, pp.590-620, 2015.
[13] J. W. Min and Y. J. Kim, “A Study of Success Factors in Public Technology Transfer: The Implications of Licensee’s Motivation,” doctoral dissertation, Department of Management of Technology, Journal of Intellectual Property, Vol.10, No.2, pp.225-256, 2015.
[14] S. M. Khayat, “Factors Affecting Technology Transfer in the Philippines Food Processing Industry,” J Food Process Technology, Vol.6, No.5, 2015
[15] S. M. Nah, C. O. Kim, and H. S. Lee, “A Comparative Study of the Effect of University Competence on Technology Transfer and Commercialization and start-ups,” Journal of the Korean Institute of Industrial Engineers, Vol.40, No.5, pp.462-476, 2014.
[16] M. S. Kim, S. M. Yeon, J. S. Kim, and B. H.
Lee, “Analysis of Factors Influencing the Performance of Technology Transfer on National R&D by Research Actors,” Journal of Korea Contents Association, Vol.15, No.11, pp.559-570, 2015.
[17] G. W Lee, H. B. Lee, and I. H Jang, Korea
Institute of Science and Technology Evaluation Planning: Issue paper, 2012.
[18] Metal Innovation and Technology Transfer Ce ntre, http://ccnb.ca/entrepreneurship-et- innova tion/research-and-industrial-services /centres- and-specialized-services/mittc.aspx
[19] J. C. Kwan, J. B. Moon, W. J. Yoo, and C. G.
Lee, “Achievement Characteristic Analysis for
Large Scale Government R&D projects Focusing on 21st Century Frontier R&DProgram,” Journal of Korea Technology Innovation Society, Vol.15, No.1, pp.185-202, 2012.
[20] J. K. Ngoie, “Federal Research Spending and Innovation in the US Economy,” Journal of Policy Modeling, Vol.36, No.3, pp.492-506, 2014.
[21] C. H. Kim and H. W. Park, “The Role of Technology Valuation in Technology Transfer of Universities,” Korea Technology Innovation Society, Vol.16, No.3, pp.754-783, 2013.
[22] W. J. Shim and E. S. Kim, “Diversified Analysis of the Correlation between Investment and Performance of Korean R&D Programs,”
Korea Technology Innovation Society, Vol.13, No.1, pp.1-27, 2010.
[23] S. Y. Moon, A Study on the Effectiveness of
R&D management of General Research Grant Program Based on the Analysis of Relationship between R&D Input Factors and Outputs,
Department of Business Administration Graduate School, Chungnam National University, 2007.[24] C. H. Kim and S. D Lee, “A Study on Relationships between Performance of University-Industry Cooperation and Competency Factors of University,” Journal of Korea Technology Innovation Society, Vol.10, No.4, pp.629-653, 2007.
[25] J. Bercovitz, M. Feldman, I. Feller, and R.
Burton, “Organizational Structure as a Determinant of Academic Patent and Licensing Behavior: An Exploratory Studin of Duke, Johns Hopkins, and Pennsyvania State Universities,”
Journal of Technology Transfer, Vol.26, pp.21-35, 2001.
[26] D. B. Audretsch, E. E. Lehmann, and M.
Wright, “Technology Transfer In a Global Economy,” Journal of Technology Transfer, Vol.39, pp.301-312, 2014.
저 자 소 개
김 슬 기(Seulki Kim) 준회원
▪2010년 12월 : University of Washington, Business(문학사)
▪2015년 3월 ∼ 현재 : 과학기술 연합대학원대학교 과학기술경 영정책 석사과정
<관심분야> : 과학기술경영정책, 사업화, 기술이전, 기술이전전담조직
연 승 민(Seungmin Yeon) 준회원
▪2013년 2월 : 공주대학교 대기과 학과(이학사)
▪2014년 9월 ∼ 2016년 8월 : 과 학기술연합대학원대학교 과학 기술경영정책(석사)
<관심분야> : 과학기술경영정책, 기술경영, 성과분석, 과학기술정보서비스
강 인 제(Inje Kang) 준회원
▪2016년 2월 : 한동대학교 경영 경제학부(문학사)
▪2016년 3월 ∼ 현재: 과학기술 연합대학원대학교 과학기술경 영정책 석사과정
<관심분야> : 과학기술경영정책, 성과분석, R&D 경제
이 병 희(Byeong-Hee Lee) 종신회원
▪1994년 2월 : 충남대학교 컴퓨터 공학과 (공학석사)
▪2002년 2월 : 충남대학교 컴퓨터 공학과 (공학박사)
▪2002년 9월 ∼ 현재 : 한국과학
기술정보연구원 NTIS센터
R&D정보융합실 책임연구원
▪2012년 9월 ∼ 현재 : 과학기술연합대학원대학교 과 학기술경영정책 교수
<관심분야> : 과학기술경영정책, 시맨틱기반 검색, 과 학기술정보서비스, R&D효율성지표