* Wei-Ze Qin and Seong-Ho Choi were equally contributed as first author
** Corresponding author : Man-Kang Song, Department of Animal Science, Chungbuk National University, Tel: +82-43-261-2545, FAX:
+82-43-273-2240, E-mail address: [email protected]
Effect of Defaunation on In Vitro Fermentation Characteristics and Methane Emission When Incubated with Forages
Wei-Ze Qin
1*, Seong-Ho Choi
1*, Seung-Uk Lee
1, Sang-Suk Lee
2and Man-Kang Song
1**
1
Department of Animal Science, Chungbuk National University, Cheongju, Chungbuk, 361-763 Korea,
2
Department of Animal Science, Suncheon National University, Suncheon, Cheonnam, Korea
ABSTRACT
An in vitro study was conducted to determine the effects of defaunation (removal of protozoa) and forage sources (rice straw, ryegrass and tall fescue) on ruminal fermentation characteristics, methane (CH4) production and degradation by rumen microbes.
Sodium lauryl sulfate, as a defaunation reagent, was added into the mixed culture solution to remove ruminal protozoa at a concentration of 0.375 mg/ml. Pure cellulose (0.64 g, Sigma, C8002) and three forage sources were incubated in the bottle of culture solution of mixed rumen microbes (faunation) or defaunation for up to 24 h. The concentration of ammonia-N was high under condition of defaunation compared to that from faunation in all incubations (p<0.001). Total VFA concentration was increased at 3, 6 and 12 h (p<0.05~p<0.01) but was decreased at 24 h incubation (p<0.001) under condition of defaunation.
Defaunation decreased acetate (p<0.001) and butyrate (p<0.001) proportions at 6, 12 and 24 h incubation times, but increased propionate (p<0.001) proportion at all incubation times for forages. Effective degradability of dry matter was decreased by defaunation (p<0.001). Defaunation not only decreased total gas (p<0.001) and CO2(p<0.01~0.001) production at 12 and 24 h incubations, but reduced CH4 production (p<0.001) at all incubation times for all forages. The CH4 production, regardless of defaunation, in order of forage sources were rice straw > tall fescue > ryegrass > cellulose (p<0.001) up to 24 h incubation.
(Key words : Defaunation, Forages, Effective degradability, Total gas, Methane emission)
. INTRODUCTION
The forages make up a large proportion of the diet in ruminant production systems. The feeding of forages as energy sources to ruminants is highly depended on rumen fermentation of the fiber such as cellulose and hemicelluloses by rumen microbes (Wina et al., 2006).
Rumen protozoa are metabolically active and serve a multifunctional role in metabolizing dietary nutrients through several ways (Morgavi et al., 2010). Protozoa are well known to secrete hydrolytic enzymes (Coleman, 1986) and positively contributed to 20% of fiber degradation (Dijkstra and Tamminga, 1995). In addition to their role in fiber degradation, rumen protozoa are positively related to methane (CH
4) production in the rumen. Finlay et al. (1994) described a symbiotic relationship of ruminal ciliate protozoa with methanogens, which has been proved to allow an interspecies H
2transfer from ciliate protozoa to methanogens
for CH
4synthesis, and the symbiotic methanogens associated with rumen ciliate protozoa may account for 37% of the total CH
4production. Some studies have shown that defuanation (removal of protozoa in the rumen) decreased CH
4production up to 10.8% (Kreuzer et al., 1986) or 24.1%
(Morgavi et al., 2008) when the cattle were fed forage diets. Furthermore, it is well known that ruminants fed forage-based diets produce more CH
4than those fed high level of concentrate diets (Johnson et al, 2000).
Since CH
4emission from ruminants has increasingly
caused widespread attention because of energy loss of the
ingested diets and its contribution to global greenhouse gas
(Johnson and Johnson, 1995) various attempts have been
made to suppress CH
4production. Despite protozoa
comprise more than 50% of rumen microbial biomass
(Harrison and McAllan, 1980), there is little information
about the relationship between various forage feeds and
rumen protozoa in CH
4production from fiber digestion.
Table 1. Chemical composition of the feeds sources
Feeds Chemical composition (%, DM basis)
Crude protein Ether extract Neutral detergent fiber Ash
Rice straw 3.62 2.12 70.36 11.34
Tall fescue 3.19 2.95 73.50 5.49
Ryegrass 4.14 2.05 69.48 5.16
Therefore, the objective of the present study was to investigate the effect of defaunation on fermentation charac- teristics and in vitro CH
4production by forage feed.
. MATERIALS AND METHODS
1. Preparation of culture solution and in vitro incub- ation with rumen microbes
Rumen contents were obtained 2h after the morning feeding (09:00) from three ruminally-cannulated non-lactating Holstein cows fed 9 kg/d total diets daily (2 kg concentrate and 7 kg ryegrass, as fed basis), twice (09:00 and 18:00 h) per day, in an equal volume. The rumen fluid was strained through 12 layers of cheesecloth to remove the feed particles. Carbon dioxide (CO
2) was flushed into the strained rumen fluid for 30 seconds. Culture solution was prepared by mixing 40 ml strained rumen fluid with 40 ml McDougall’s artificial saliva (McDougall, 1948) in 160 ml incubation bottle. Sodium lauryl sulfate (Sigma, L5750) as a defaunation reagent was added into the mixed culture solution to remove ruminal protozoa at concentration of 0.375 mg/ml (Dohme et al., 1999). Pure cellulose (0.64 g, Sigma, C8002) and three forage sources (1.08 g rice straw, 1.0 g ryegrass and 0.94 g tall fescue on an air dried basis) were prepared in a nylon bag (5 × 5 cm; pore size, 50 μm) in order to supply the similar amount of neutral detergent fiber (NDF) between forage sources, and were incubated in the bottle of culture solution of mixed rumen microbes (faunation) or of absence of protozoa (defaunation). The bottles were then sealed with rubber stoppers and were incubated anaerobically in a shaking incubator (VS-8480SR, VISON Science, Bucheon, Korea) at a speed of 135 rpm up to 24 h at 39 . The in
vitro incubation was made 3 times in duplicate, each timeunder the similar conditions. Chemical composition of feed added to the culture solution is shown in Table 1.
2. Measurement and analysis
Incubation was stopped by removing the bottles from the shaking incubator at 3, 6, 12 and 24 h, and pH of culture solution was immediately measured. At the same time an aliquot of culture solution (0.8 ml) was collected from each bottle for ammonia and volatile fatty acid (VFA) analysis.
Ammonia concentration was determined by the method of Fawcett and Scott (1960) using a spectrophotometer. The 0.8 ml culture solution was mixed with 0.2 ml 25% phosphoric acid and 0.2 ml pivalic acid solution as the internal standard for the VFA analysis as described by Li et al (2010). Total gas production was also measured at each incubation time through the 3-way stopcock connected to culture bottles. A gas sample was transferred to a 5 ml vacuum tube and analyzed for methane (CH
4) and carbon dioxide (CO
2) by gas chromatography (YL 6100GC, Young Lin Instrument Co., Korea) equipped with flame ionization detector (FID) and thermal conductivity detector (TCD). A 30 m silica capillary column (Agilent HP-PLQT Q, 19095P- Q04, 0.54 mm i.d., USA) was used to identify CH
4and CO
2peak analysis. The oven and injector temperatures for gas analysis were 100 and 150 , respectively, and temperatures for FID and TCD detector were kept at 230 and 150 , respectively. The nitrogen (N
2) gas was used as carrier gas at a flow rate of 30 ml/min. The nylon bag containing feed residue was washed with tap water and dried at 60 for 48h in the drying oven to measure dry matter (DM) degradation. Crude protein (CP), ether extract (EE), and organic acid (OM) were analyzed according to AOAC (1995). The NDF was analyzed by the methods of Van Soest et al. (1991).
3. Estimation of effective degradability in vitro
Percent disappearance of DM at each incubation time was
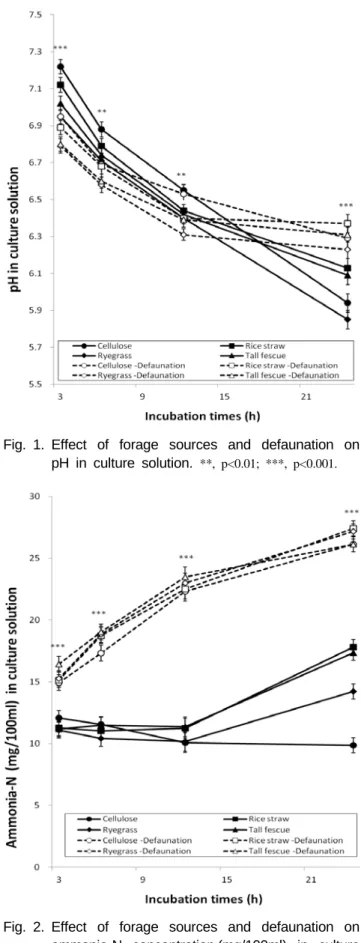
Fig. 2. Effect of forage sources and defaunation on ammonia-N concentration (mg/100ml) in culture solution.
***, p<0.001.Fig. 1. Effect of forage sources and defaunation on pH in culture solution.
**, p<0.01; ***, p<0.001.calculated from the portion remaining after incubation in the rumen. Disappearance rate was fitted to the equation of Ørskov and McDonald (1979):
Y(t) = a + b(1-e
ct)
Where Y
(t)is the proportion of the incubated material degraded at time t; ‘a’ is the water soluble and instantly degradable fraction; ‘b’ is the potentially degradable fraction; ‘c’ is the fractional rate of degradation of fraction
b (h-1). Non-linear parameters a, b and c was estimated byan iterative least square procedure to calculate effective degradability of DM (EDDM) according to the following equation (Ørskov and McDonald, 1979):
Effective degradability = a + (b×c) / (c+r)
Where ‘r’ is the fractional outflow rate and a hypothetical fractional outflow rate (kp) of 0.05/h was used for estimation of effective degradability.
4. Statistical analyses
The present study was conducted as 2 × 4 factorial design that represent two fractions (faunation and defaunation) and four dietary groups (cellulose, rice straw, tall fescue and ryegrass).
Data were analyzed using the general linear models (GLM) procedure of SAS (2002). Eight treatments were replicated twice per time and repeated 3 times. For each variable measured at each time, replicates were averaged, and the total number of observations was 8 (treatments) × 3 (times) = 24 observations. The 24 observations obtained were subjected to least squares analysis of variance according to the following models:
Yij
= μ + τ
i+ S
j + (τi× S
j) + ε
ijWhere Y
ijis observation, μ is the overall mean, τ
iis the effect of forage treatment (i = 1~ 4), S
jis defaunation effect (j = 1 and 2), (τ
i× S
j) = interaction effect between forage feed and defaunation and ε
ijis the error term. Significances were declared at p < 0.05.
. RESULTS
The chemical composition of forage feed sources is
shown in Table 1. At each incubation time, microscopic
examination was carried out to observe protozoa by using a
Table 2. Effects of forage sources and defaunation on total VFA production and molar proportion of VFAs by rumen microbes
Items
Treatments
SEM1)
P‐values
Faunation Defaunation
Feed (F)
Def.2) (D) F×D3) Cellulose Rice
straw Ryegrass Tall
fescue Cellulose Rice straw
Rye- grass
Tall fescue 3 h
Total VFAs (mmoles/100ml) 67.09b 70.12ab 72.03ab 71.47ab 72.56ab 72.90ab 77.31a 76.54a 2.467 * ** NS Molar proportion (mmoles/100mmoles)
Acetate (C2) 66.77ab 68.40a 67.79ab 67.76ab 62.38c 66.07b 66.20b 65.94b 0.891 *** NS ***
Propionate (C3) 15.43d 17.64c 18.58bc 18.46bc 19.90ab 20.95a 20.97a 20.89a 0.736 *** *** NS Butyrate (C4) 10.60bc 11.47a 11.23ab 11.21ab 10.32cd 9.93cd 9.74d 9.98cd 0.592 *** *** * C2/C3 4.33a 3.88b 3.65bc 3.67bc 3.13cd 3.16d 3.16d 3.16d 0.092 *** *** NS
6 h
Total VFAs (mmoles/100ml) 73.42d 77.30cd 85.99ab 81.98bc 87.57ab 88.91ab 92.14a 90.74ab 2.180 *** * NS Molar proportion (mmoles/100mmoles)
Acetate (C2) 68.30a 67.79a 67.63a 67.27a 64.04b 62.27c 62.11c 61.75c 0.739 *** *** NS Propionate (C3) 16.81c 17.67c 18.28c 18.03c 24.03b 25.38a 26.29a 24.40a 0.437 *** *** NS Butyrate (C4) 12.23a 12.11a 11.88a 12.30a 8.68b 9.13b 8.50b 8.63b 0.379 *** *** NS C2/C3 4.06a 3.84b 3.70b 3.73b 2.67c 2.46d 2.36d 2.34d 0.066 *** *** NS
12 h
Total VFAs (mmoles/100ml) 95.78c 105.66b 108.22b 106.75b 96.13c 108.69b 118.41a 110.73b 2.012 *** ** NS Molar proportion (mmoles/100mmoles)
Acetate (C2) 65.11a 65.18a 65.79a 65.91a 59.67b 59.90b 58.97b 59.74b 0.905 *** *** NS Propionate (C3) 20.20c 19.20c 19.32c 19.24c 29.18ab 26.67b 29.86a 27.98ab 0.749 *** *** NS Butyrate (C4) 12.42a 13.33a 12.69a 12.63a 7.61b 9.65b 7.94b 8.69b 0.857 *** *** NS C2/C3 3.22a 3.40a 3.41a 3.43a 2.04b 2.25b 1.98b 2.14b 0.080 *** *** NS
24 h
Total VFAs (mmoles/100ml) 133.70a 126.64bc 134.87a 128.40ab 120.70c 112.88d 124.57bc 119.97c 1.894 *** *** NS Molar proportion (mmoles/100mmoles)
Acetate (C2) 63.31a 64.11a 64.33a 64.21a 58.85b 57.98b 57.07b 58.37b 0.903 *** *** **
Propionate (C3) 22.79b 19.55c 20.42c 19.85c 29.83a 28.62a 30.91a 28.42a 0.724 *** *** NS Butyrate (C4) 11.79ab 13.78a 12.96a 13.45a 7.57c 9.82bc 8.25c 9.55bc 0.711 *** *** NS C2/C3 2.78b 3.28a 3.15a 3.24a 1.97c 2.03c 1.85c 2.07c 0.063 *** *** **
1) SEM, Standard error of means; 2)Def.: defaunation; 3)F×D, interaction between defaunation and various forages.
a,b.c
Means in the same row with different superscripts differ regardless of defaunation.
* p<0.05; ** p<0.01; *** p<0.001; NS = Non significant.
16/0.35 objective, and it showed that sodium lauryl sulfate was effective defaunation agent. After dosing, live protozoa were virtually absent in culture solution. The pH of all treatments in the culture solution tended to decrease with incubation times as shown in Fig. 1. Defaunation decreased pH of culture solution at 3 h (p<0.001) and 6 h (p<0.001) incubations and then increased it at 24 h (p<0.001) when compared with faunation. Among forages, the increased pH was observed in culture solution with cellulose compared with those in culture solutions with other forage sources in
3 h (p<0.001), 6 h (p<0.01) and 12 h (p<0.01) incubation
times, and regardless of defaunation the highest pH from
rice straw and the lowest pH from ryegrass were found at
24 h incubations (p<0.001). Ammonia-N concentration in the
culture solution had a trend to increase for all treatments
regardless of defaunation except for the cellulose from
faunation as the incubation time advanced (Fig. 2). Defaunation
significantly increased ammonia-N concentration in all
incubations compared with faunation (p<0.001). Within the
faunation treatments, ammonia-N concentration was not
Table 3. Effects of forage sources and defaunation on degradation parameters (a, b, and c) and effective degradability of dry matter (EDDM) by rumen microbes
Parameters1) and ED
Treatments
SEM2)
Effects
Faunation Defaunation
Feed (F)
Def.3) (D) F×D4) Cellulose Rice
straw Ryegrass Tall
fescue Cellulose Rice
straw Ryegrass Tall fescue
a 1.545d 1.713d 1.716d 1.726d 1.376d 3.293c 4.429a 3.837b 0.116 *** *** ***
b 79.31a 41.77e 46.57c 44.24d 66.78b 33.35h 38.97f 36.64g 0.747 *** *** * c 0.166c 0.186abc 0.179bc 0.186abc 0.201ab 0.207a 0.192abc 0.174c 0.006 ** ** **
EDDM 62.40a 34.62e 38.13c 36.59d 54.85b 30.16g 35.35de 32.27f 1.161 *** *** ***
1)a, Intercept representing rapidly soluble fraction in the rumen; b, fraction of degradable at time infinity; c, rate constant of disappearance of fraction “b”.
2)SEM, Standard error of means; 3)Def.: defaunation.4)F×D, interaction between defaunation and various forages.
a,b.c
Means in the same row with different superscripts differ regardless of defaunation;* p<0.05; ** p<0.01; *** p<0.001.
influenced by forage sources in all incubations except for 24 h incubation. Aammonia-N concentration was highest in the culture solution of faunation incubated with rice straw and tall fescue at 24 h incubation, then followed by ryegrass and cellulose (p<0.001, Fig. 2).
Defaunation increased total VFA concentration at 3, 6 and 12 h (p<0.05~p<0.01) but decreased it at 24 h (p<0.001, Table 2). Rice straw produced the lowest total VFA concentration (p<0.001) while ryegrass produced its highest concentration (p<0.001) after 24 h incubations regardless of defaunation. Defaunation decreased proportions of acetate (C
2, p<0.001) and butyrate (C
4, p<0.001) at all incubation times except for C
2at 3 h incubation but increased proportions of propionate (C
3) from 3 h incubation (p<0.001).
Meanwhile, defaunation decreased C
2to C
3ratio for all the forages from 3 h incubation (p<0.001).
Degradation parameters (a, b and c) and effective degradability (ED) of major components are presented in Table 3. Defaunation decreased EDDM (p<0.001) for all treatments. Furthermore, mean percent EDDM from faunation or defaunation was uniformly ranked as cellulose > ryegrass
> tall fescue > rice straw (Table 3).
The effect of defaunation for forages on the gas production is shown in Table 4. Accumulated total gas production was decreased by defaunation at 3, 12 and 24 h incubations (p<0.001), and carbon dioxide (CO
2) production was also reduced at 12 h (p<0.01) and 24 h (p<0.001) incubations. Defaunation clearly decreased CH
4production at all the incubation times (p<0.001) compared with faunation.
Meanwhile, emission of total gas (p<0.001), CO
2(p<0.001) and CH
4(p<0.001) was lowest from cellulose, but ryegrass showed the highest amount of total gas (p<0.001), CO
2(p<0.001) and CH
4(p<0.001) regardless of defaunation at all incubation times. In addition, defaunation was associated with a higher percent of CO
2(p<0.001) and a lower percent of CH
4(p<0.001) in total gas than faunation through all the incubation times. Similarly, defaunation resulted in lower ratio of CH
4to CO
2plus CH
4(p<0.001) and CH
4to CO
2(p<0.001) than faunation during the whole incubation time.
After 24 h incubation, interactions between defaunation and forage feeds were observed in total gas (p<0.01), CO
2(p<0.01), CH
4(p<0.05) and EDDM (p<0.001, Table 4).
. DISCUSSION
The effective degradability (ED) in the rumen is generally used to measure forage quality, because it can be considered as an assessment of the energy content from forages and typically predicting from forage fiber content.
Decrease in fiber digestion has been widely reported after removal of protozoa (Ushida and Jouany, 1990). A general explanation for this is that protozoa are actively involved in fiber digestion by ingesting the feed particles (Akin and Amos, 1979) as well as by secretion of hydrolytic enzymes (Coleman, 1986), thus accounting for 20% of the fiber digestion in the rumen (Dijkstra and Tamminga, 1995).
Wolin et al. (1997) reported that fiber degradation is closely
associated with methanogenesis and protozoa can activate
Table 4. Effects of forage sources and defaunation on gas production
Items
Treatments
SEM1)
Effects
Faunation Defaunation
Feed (F)
Def.2) (D) F×D3) Cellulose Rice
straw Ryegrass Tall
fescue Cellulose Rice
straw Ryegrass Tall fescue 3 h
Total gas (ml) 25.33e 36.00bc 42.33a 39.67ab 20.33f 30.67d 36.67bc 33.00cd 1.258 *** *** NS CO2(ml) 17.22d 34.99bc 30.84a 28.66ab 16.18d 23.30c 30.38a 26.90abc 1.149 *** NS NS CH4(ml) 6.82b 8.81a 10.04a 8.87a 3.52d 5.30c 5.30c 4.48cd 0.365 *** *** NS CO2 % in total gas 67.91c 69.40c 72.87bc 72.26bc 79.78ab 76.14abc 82.69a 81.63a 1.942 *** *** NS CH4 % in total gas 26.90a 24.47ab 23.74ab 22.35b 17.54c 17.22c 14.48c 13.60c 1.077 *** *** NS CH4/(CH4+CO2) 0.284a 0.261ab 0.245b 0.237b 0.179c 0.185c 0.149d 0.143d 0.009 *** *** NS CH4/CO2 0.397a 0.353b 0.325b 0.311b 0.219c 0.227c 0.176cd 0.167d 0.014 *** *** NS
6 h
Total gas (ml) 46.33b 66.33a 73.00a 70.67a 44.33b 65.33a 71.33a 66.33a 1.736 *** NS NS CO2(ml) 33.21c 48.04b 53.21ab 51.51ab 36.80c 53.43ab 57.69a 53.66ab 1.872 *** * ***
CH4(ml) 11.92b 16.80a 16.93a 17.89a 6.817c 10.82b 10.03b 10.80b 0.717 *** *** NS CO2% in total gas 71.71b 72.41b 72.89b 72.89b 83.12a 81.73a 80.73a 80.90a 1.560 *** *** NS CH4% in total gas 25.74a 25.33a 25.19a 25.32a 15.42b 16.47b 14.01b 16.29b 0.918 *** *** NS CH4/(CH4+CO2) 0.264a 0.259a 0.241a 0.258a 0.156b 0.167b 0.148b 0.168b 0.006 *** *** NS CH4/CO2 0.359a 0.350ab 0.318b 0.347b 0.185c 0.201c 0.174c 0.201c 0.009 *** *** NS
12 h
Total gas (ml) 92.00c 113.67a 120.33a 118.67a 73.00d 97.00bc 104.00b 98.00bc 2.227 *** *** NS CO2(ml) 66.01c 81.00ab 85.89a 84.55a 60.19d 76.45b 84.91a 80.79ab 1.679 *** ** NS CH4(ml) 23.26b 27.38a 28.56a 28.38a 11.02d 15.47c 14.81c 14.38c 0.711 *** *** NS CO2% in total gas 71.73b 71.25b 71.39b 71.33b 82.44a 78.78a 81.71a 82.44a 1.059 *** *** NS CH4% in total gas 25.32a 24.08a 23.73a 23.90a 15.09b 15.95b 14.24b 14.68b 0.471 *** *** NS CH4/(CH4+CO2) 0.261a 0.253a 0.249a 0.251a 0.155c 0.168b 0.148c 0.151c 0.005 *** *** NS CH4/CO2 0.353a 0.338a 0.332a 0.336a 0.183b 0.203b 0.174b 0.178b 0.008 *** *** NS
24 h
Total gas (ml) 157.67c 167.33b 180.67a 170.00b 93.67e 125.33d 131.33d 124.67d 2.444 *** *** **
CO2(ml) 111.70b 122.88a 128.14a 123.82a 73.46d 99.90c 107.57bc 101.28c 2.259 *** *** **
CH4(ml) 39.62a 40.29a 42.22a 41.31a 14.22c 21.65b 18.72b 20.24b 0.962 *** *** * CO2% in total gas 70.84b 73.44b 70.96b 72.83b 78.43a 79.75a 81.92a 81.23a 1.181 *** *** NS CH4% in total gas 25.13a 24.08a 23.37a 24.30a 15.18cd 17.23b 14.24d 16.24bc 0.531 *** *** NS CH4/(CH4+CO2) 0.262a 0.247a 0.248a 0.250a 0.162bc 0.177b 0.148c 0.167bc 0.005 *** *** * CH4/CO2 0.355a 0.328a 0.330a 0.334a 0.194bc 0.216b 0.174c 0.200bc 0.008 *** *** *
1) SEM, Standard error of means; 2) Def.: defaunation; 3) F × D, interaction between defaunation and various forages.
a,b.c,
Means in the same row with different superscripts differ regardless of defaunation; * p<0.05; ** p<0.01; *** p<0.001; NS = Non significant.
fibrolytic bacteria to stimulate fiber digestion by interspecies hydrogen transfer. The synthesis of methane can effectively avoid an accumulation of H
2in the rumen which in turn can inhibit electron transfer reaction of NADH dehydrogenase, suppressing rumen fermentation and fiber degradation (Morgavi et al., 2010). Thus, it is assumed that defaunation reducing methane production in the present study might be due to indirect shift in an inefficient pathway of H
2metabolism, leading a higher partial pressure of hydrogen,
and this, thereby, inhibiting activities of cellulolytic
enzymes and lowering of fiber degradability. In addition,
the three forages from defaunation group differed in fiber
degradation. As expected, ryegrass and tall fescue had
relatively higher fiber degradability than rice straw. It might
be related to high lignin content in rice straw compared
with ryegrass and tall fescue (Ohet al., 1971). Lignin is a
primary barrier in the ruminal degradation of forage sources by rumen microbes (Baker, 1973). The results of those studies are consistent with ours that pure cellulose used in the present study showed a much high DM degradability than forages irrespective of defaunation. In the present study, defaunation increased pH of the culture solution for both forages and cellulose, and our finding is in line with previous report (Chaudhary et al., 1995).
It is well established that defaunation consistently decreased NH
3-N concentration (Kiran and Mutsvangwa, 2010). However, the result of NH
3-N concentration obtained from this study was completely in contrast to those of the previous reports.
An explanation for this might be due to autolysis of protozoa (Ankrah et al., 1990) or the eliminated protozoa as microbial protein source was believed to be digested by the other rumen microbes, leading to high NH
3-N concentration after defaunation.
Microbial fermentation of forage is mainly converted into energy in the form of volatile fatty acids (VFAs) in ruminant, and VFA concentration is positively related to EDDM. In the present study, defaunation significantly decreased total VFA concentration after 24 h incubation. As mentioned earlier, modification of fermentation pattern by defaunation negativity led to the accumulation of H
2and finally suppressed rumen fermentation, thus the decreased total VFA could mostly be explained by a decreased EDDM up to 24 h of incubation. Simultaneously, defaunation also changed the VFA profile in the culture solution, resulting in a lower molar proportion of C
2and C
4but a higher proportion of C
3and consequently leading to lower C
2to C
3ratio than faunation. The current results were in agreement with earlier study (Eugène et al., 2004), where an increase in C
3was frequently accompanied by a decrease in C
2and C
4. Molar proportions of C
3varied inversely with C
4, and C
2maybe coherent with removal of protozoa which lead to changes in microbial groups and alteration of microbial fermentation, thus led to a shift in the balance of H
2metabolism between C
3and methane production in defaunation group. Furthermore, ryegrass showed similar results in comparison with cellulose, and seemed to be more potent in increasing total VFA concentration than both rice straw and tall fescue. This might be associated with the relatively low degree of lignification and high buffer
solubility in ryegrass (Jin et al., 2012). It can be indicated that degradation of ryegrass is less limited by lignin and more rapidly available for rumen microbes, contribution to more VFA production.
The in vitro gas production technique has been extensively used to estimate nutritive value of forages (Williams, 2000).
Defaunation reduced total gas production from cellulose and forages (Table 4). The strong relationship between total gas production and EDDM has been previously reported (Jin et al., 2012). Regardless of defaunation, more gas was produced from forages than from cellulose (Table 4). This can be explained by the presence of non-fibrous ingredient in the forages which was contributed to the additional gas production. High percent of CO
2but low percent of CH
4in the total gas was found in defaunation group in the current study (Table 4). One of possible reasons for this may be due to the pathway of methanogenesis, which was selected by methanogens for utilizing H
2to reduce CO
2to CH
4(Finlay et al., 1994). Rumen protozoa are known to have symbiotic relationships involving interspecies hydrogen transfer with methanogens in which methanogen reduces carbon dioxide to methane with transferred hydrogen from protozoa (Hook et al. 2010). Thus, it indicated that decrease in methane production might be accompanied with accumulation of CO
2. For the same reason, lower ratios of CH
4/(CH
4+ CO
2) and CH
4/CO
2from defaunation were observed. Hook et al. (2010) suggested that defaunation may also decrease the protozoa-associated methanogen population, and therefore, decrease the methane production within in the rumen. Also, the removal of protozoa from the rumen not only decreased methane emission but had negative effect on fiber digestion (Morgavi et al., 2010), and defaunation has been shown to reduce methane production by 30%~45% (Hegarty, 1999). In the present study, defaunation markedly reduced CH
4production from forages and cellulose compared with
faunation. Inhibition of interspecies H
2transfer by
defaunation may indirectly result in an altered pattern of
hydrogen availability for VFA production, which should
also reduce methane production as an alternative pathway
for electron sink was available for C
3production (Morgavi
et al., 2008). Li et al. (2009) have confirmed that reduced
methane production with increase in C
3production may be
attributed to the competition with methanogens for the
available H
2. These findings are in line with our results that low methane production from defaunation was accompanied by an increased C
3production. Furthermore, reduced methane production by defauntion is closely related to decreased fiber digestion which was in agreement with the previous report (Morgavi et al., 2010). Hungate et al.
(1970) reported that methanogen uses the hydrogen and carbon dioxide produced from carbohydrate fermentation. By removing hydrogen methanogens help the microorganisms involved in fermentation to function optimally and support the complete oxidation of substrate (Sharp et al., 1998).
Finally, if the hydrogen which is fermentation end product is not removed, it can inhibit metabolism of rumen microorganisms (Sharp et al., 1998) or stimulate alternative hydrogen sinks such as C
3production, bio-hydrogenation of unsaturated fatty acids and nitrate reduction (Tandon et al., 2005). Our results demonstrated that reduced methane production might increase the hydrogen in the rumen, then stimulated hydrogen sink toward production of C
3(Table 3 and Table 4).
Based on the results obtained from the present study defaunation modified fermentation pattern and shifted into an inefficient pathway of hydrogen metabolism which negatively affected metabolic activities of rumen microorganisms, thus resulted in a lower ED, changes in the VFA profile, and simultaneously reduction of methane emission.
. ACKNOWLEDGEMENTS
This research was supported by High Value-added Food Technology Development Program (project no: 20111011), Ministry of Agriculture, Food and Rural Affairs.
. REFERENCES
Akin, D.E. and Amos, H.E. 1979. Mode of attack on orchard grass leaf blades by rumen protozoa. Applied and Environmental Microbiology. 37:332-338.
Ankrah, P., Loerch, S.C., Kampman, K.A. and Dehority, B.A. 1990.
Effects of defaunation on in situ dry matter and nitrogen disappearance in steers and growth of lambs. Journal of Animal Science. 68:3330-3336.
AOAC. 1995. Official methods of analsis. 13th ed. Association of official analytical chemists, Washington, DC.
Baker, A.J. 1973. Effect of lignin on the in vitro digestibility of wood pulp. Journal of Animal Science. 36:768-771.
Chaudhary, L.C., Srivastava, A. and Singh, K.K. 1995. Rumen fermentation pattern and digestion of structural carbohydrates in buffalo (Bubalusbubalis) calves as affected by ciliate protozoa.
Animal Feed Science and Technology. 56:111-117.
Coleman, G.S. 1986. The distribution of carboxymethylcellulase between fractions taken from the rumens of sheep containing no protozoa or one of five different protozoal populations. Journal of Agricultural Science.106:121-127.
Dijkstra, J. and Tamminga, S. 1995. Simulation of the effects of diet on the contribution of rumen protozoa to degradation of fiber in the rumen. British Journal of Nutrition. 74:617-634.
Dohme, F., Machmüller, A., Estermann, B.L., Pfister, P., Wasserfallen, A. and Kreuzer, M. 1999. The role of the rumen ciliate protozoa for methane suppression caused by coconut oil.
Letters in Applied Microbiology. 29:187-192.
Eugène, M., Archimède, H., Doreau, B.M. and Fonty, F. 2004.
Effects of defaunation on microbial activities in the rumen of rams consuming a mixed diet (fresh Digitaria decumbens grass and concentrate). Animal. 53:187-200.
Fawcett, J.K. and Scott, J.E. 1960. A rapid and precise method for the determination of urea. Journal of Clinical Pathology.
13:156-163.
Finlay, B.J., Esteban, G., Clarke, K.J., Williams, A.G., Embley, T.M.
and Hirt, R.R. 1994. Some rumen ciliates have endosymbiotic methanogens. FEMS Microbiology Letters. 117:157-162.
Harrison, D.G. and McAllan, A.B. 1980. Factors affecting microbial growth yields in the reticuio-rumen. In: Digestive Physiology and Metabolism in Ruminants (Ed. Y. Ruckebush and P. Thivend).
MTP Press, Lancaster, England. pp. 205-226.
Hegarty, R.S. 1999. Reducing rumen methane emissions though elimination of rumen protozoa. Australian Journal of Agricultural Research. 50:1321-1328.
Hook, S.E., Wright, A.G. and McBride, B.W. 2010. Methanogens:
Methane producers of the rumen and mitigation strategies.
Archaea. doi:10.1155/2010/945785.
Hungate, R.E., Smith, W., Bauchopo, T., Yu, I. and Rabinowitz, J.C.
1970. Formate as an intermediate in the bovine rumen fermentation. Journal of Bacteriology. 102:389-397.
Jin, G.L., Shinekhuu, J., Qin, W.Z., Kim, J.K., Ju, J.K., Suh, S.W.
and Song, M.K. 2012. Effect of protein fractionation and buffer solubility of forage sources on in vitro fermentation characteristics, degradability and gas production. Journal of the
Korean Society of Grassland and Forage Science. 32:59-74.
Johnson, D.E., Johnson, K.A., Ward, G.M. and Branine, M.E. 2000.
Ruminants and other animals. In: Atmospheric Methane (Ed.
M.A.K. Khalil). Springer-Verlag, Berlin, Germany. pp. 112-133.
Johnson, K.A. and Johnson, D.E. 1995. Methane emissions from cattle. Journal of Animal Science. 73:2483-2492.
Kiran, D. and Mutsvangwa, T. 2010. Effects of partial ruminal defaunation on urea-nitrogen recycling, nitrogen metabolism, and microbial nitrogen supply in growing lambs fed low or high dietary crude protein concentrations. Journal of Animal Science.
88:1034-1047.
Kreuzer, M., Kirchgessner, M. and Muller, H.L. 1986. Effect of defaunation on the loss of energy in wethers fed different quantities of cellulose and normal or steam flaked maize starch.
Animal Feed Science and Technology. 16:233-241.
Li, X.Z., Long, R.J., Yan, C.G., Choi, S.H., Jin, G.L. and Song, M.K. 2010. Rumen microbial responses in fermentation characteristics and production of CLA and methane to linoleic acid in associated with malate or fumarate. Animal Feed Science and Technology. 155:132-139.
Li, X.Z., Yan, C.G., Choi, S.H., Long, R.J., Jin, G.L. and Song, M.K. 2009. Effects of addition level and chemical type of propionate precursors in dicarboxylic acid pathway on fermentation characteristics and methane production by rumen microbes in vitro. Asian-Australasian Journal of Animal Science.
22:82-89.
Mathieu, F., Jouany, J.P., Senaud, J., Bohatier, J., Bertin, G. and Mercier, M. 1996. The effect of Saccharomyces cerevisiae and Aspergillus oryzae on fermentations in the rumen of faunated and defaunated sheep; protozoal and probiotic interactions.
Reproduction Nutrition Development. 36:271-287.
McDougall, E.I. 1948. Studies on ruminant saliva. I. The composition and output of sheep’s saliva. Biochemical Journal. 43:99-109.
Morgavi, D.P., Forano, E., Martin, C. and Newbold, C.J. 2010.
Microbial ecosystem and methanogenesis in ruminants. Animal.
4:1024-1036.
Morgavi, D.P., Jouany, J.P. and Martin, C. 2008. Changes in methane emission and rumen fermentation parameters induced by refaunation in sheep. Australian Journal of Experimental Agriculture. 48:69-72.
Moss, A.R., Jouany, J.P. and Newbold, J. 2000. Methane production
by ruminants: Its contribution to global warming. Annual Zootechnology. 49:231-253.
Oh, J.H., Weir, W.C. and Longhurst, W.M. 1971. Feed value for sheep of cornstalks, rice straw and barley straw as compared with alfalfa. Journal of Animal Science. 32:343-347.
Ørskov, E.R. and McDonald, I. 1979. The estimation of protein degradability in the rumen from incubation measurements weighted according to rate of passage. Journal of Agricultural Science. 92:499-506.
SAS. 2002. SAS User’s guide: Statistical analysis system institute, SAS Inc., Cary, NC, USA.
Sharp, R., Ziemer, C.J., Stern, M.D. and Stahl, D.A. 1998.
Taxon-specific associations between protozoal and methanogen populations in the rumen and a model rumen system. FEMS Microbiology Ecology. 26:71-78.
Tandon, M., Pandy, H. and Singh, V. 2005. Methane production, global warming and ozone layer depletion: A challenge for eco-friendly livestock farming. International Conference on Environment and Development: Challenges and Opportunities.
New Delhi. pp. 36.
Ushida, K. and Jouany, J.P. 1990. Effect of defaunation on fibre digestion in sheep given two isonitrogenous diets. Animal Feed Science and Technology. 29:153-158.
Van Soest, P.J., Robertson, J.B. and Lewis, B.A. 1991. Methods for dietary fiber, neutral detergent fiber, and nonstarch polysaccharides in relation to animal nutrition. Journal of Dairy Science. 74:3583-3597.
Williams, B.A. 2000. Cumulative gas-production techniques for forage evaluation. In: Forage Evaluation in Ruminant Nutrition (Ed. D.
I. Givens, E. Owen, R. F. E. Axford and H. M. Omed) CAB Int., Oxfordshire, UK. pp. 189-213.
Wina, E., Muetzel, S. and Becker, K. 2006. The dynamics of major fibrolytic microbes and enzyme activity in the rumen in response to short-and long-term feeding of sapindusrarak saponins. Journal of Applied Microbiology. 100:114-122.
Wolin, M., Miller, T. and Stewart, C. 1997. Microbe-microbe interactions. In: The rumen microbial ecosystem (Ed. P. Hobson and C. Stewart). Chapman & Hall, London. pp. 467-491.
(Received May 30, 2013 / Revised July 19, 2013 / Accepted July 25, 2013)