1)
* 한국건설기술연구원 구조연구부 선임연구원, 교신저자 ** 한국건설기술연구원 구조연구부 수석연구원 *** 한국건설기술연구원 구조연구부 선임연구원
**** 한국건설기술연구원 구조연구부 연구원
E-mail : [email protected] 031-910-0134
•본 논문에 대한 토의를 2007년 4월 30일까지 학회로 보내 주시면 2007년 7월호에 토론결과를 게재하겠습니다.
Abstract
A large number of FRP decks are already in service worldwide because the lighter FRP-based bridge decks are ideal for rapid construction to reduce the dead load of superstructures. And the proper design process is demanded for the effective FRP deck application. In this paper, to get the basic prototype of FRP bridge decks, the ratio of individual parameters, which compose the specification of FRP bridge decks, are determined by a finite element analysis. In addition, optimum FRP deck shapes are determined considering complex constraints and material properties of bi-directional characteristics.
Upon these results, the prototype of FRP bridge decks is validated.
요 지
FRP바닥판은 경량이기 때문에 신속한 시공이 가능하고, 고정하중을 경감시킬 수 있다는 장점이 있어 전 세계적으로 시공 실적이 점차 증가하고 있다. 본 논문에서는 효과적인 FRP바닥판의 적용을 위하여 유한요소해석을 통하여 FRP바닥판을 구성하는 부재별 적정 형상비를 결정하였으며, 향후 FRP바닥판 설계시 기초자료로 활용할 수 있도록 하고자 하였다. 또한, FRP의 이방적 재료 특성과 복잡한 제약조 건을 고려한 FRP바닥판의 최적설계를 수행하였으며, 그 결과를 토대로 제안된 FRP바닥판의 기본 단면 형상에 대한 검증을 수행하였다.
Keywords : Glass fibers, Finite element analysis, Bridge deck, Optimization 핵심 용어 : 유리섬유, 유한요소해석, 교량용 바닥판, 최적화
최적설계 알고리즘을 이용한 교량용 FRP바닥판의 기본 단면형상 제안
Feasibility Verification for the Basic Shape of FRP Bridge Decks Using Optimization Algorithm
박 기 태* 황 윤 국** 이 영 호*** 정 진 우****
Park, Ki Tae Hwang, Yoon Koog Lee, Young Ho Jeong, Jin Woo
1. Introduction
The fiber-reinforced polymer (FRP) is relatively a new material used in bridge construction. In spite of its higher initial costs, the FRP possesses several advantages over conventional materials in terms of high strength, excellent durability, and competitive life cycle costs. A large number of glass fiber-based bridge decks are already in service worldwide. Within a decade, more than 80 FRP decks have been built, and several projects are currently underway (Godwin, 2003).
To get a basic prototype of FRP bridge decks which is composed of glass fiber and vinyl ester, the ratios of web to flange thickness and web interval to deck height are calculated by a finite element analysis in this paper. Also, using the optimization algorithm process proposed by Park et al. (2005), optimum FRP deck shapes are determined and the verification of calculated ratios are performed. The structural analysis program and element adopted in this paper are limited to ABAQUS (Kim, 1989) and S4R element (Shen et al., 2001) that both are commonly used in the structural analysis program and element.
2. Structural performance of subjected shapes
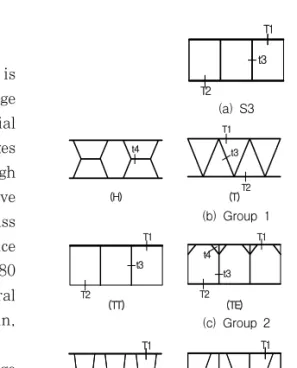
To decide a good sectional shape of FRP decks in terms of structural performance, the sectional shapes proposed by Gan et al.
(1999) and KICT (2002) were analyzed as shown in Fig. 1. To compare the analysis results efficiently, the sectional shapes were
classified into 3 groups.
The thickness of each S3 section –the criterion of the analysis– was set to 12mm, considering various references (Karbhari, 1997;
Lopez-Anido, 1997), and the total width of each section was set to 1,800mm. In the figures, T1, T2, t3, t4, t5, and α were modified to have a similar sectional area to S3 and the height was set to 600mm (Gan et al., 1999; KICT, 2002). Regarding the load, a 45kN load was applied to the contact area at the center point of analysis model, while the span of the decks was set to 8,000mm (Gan et al., 1999).
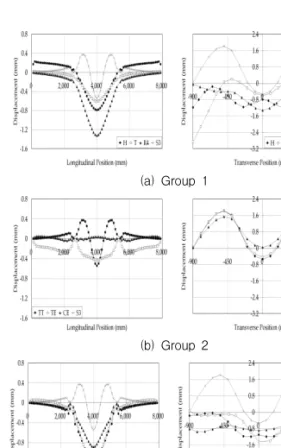
2.1 Displacement analysis results
Fig. 2 shows the displacement distribution in the longitudinal and transverse directions
Fig. 1 Example of FRP bridge deck shape (Gan et al.,1999; KICT, 2002) T2
t3 T1
(a) S3
(H) t4
T1
T2 t3
(T)
T1
T2 t3
(R4) (b) Group 1
T1
T2 t3
(TT)
T1
T2 t3 t4
(TE)
T1
T2 t3 t4
t5
(CE) (c) Group 2
α (TS1) t3
T1
T2 α
(XS) t3
T1
T2 α t3
α (TS2) t4
T1
T2
α
(d) Group 3
on the lower flange by sectional shape groups.
And the analytical displacement results of each section are compared with those of the S3 section of Fig. 1, using the similar method proposed by Gan et al. (1999).
From the analytical displacement results of a FRP deck in the longitudinal direction, the flexure strength of TE, TT and CE sections were found to be better than the S3 section.
In the meantime, the H, R4, TS1, TS2 and XS sections were to have better flexure strength than the S3 section in terms of transverse direction.
2.2 Local buckling analysis results
For the buckling characteristic analysis of an FRP deck section, the eigenvalue analysis was conducted using the subspace iteration method by Eq (1) (Bathe, 1996). And local buckling characteristic were estimated from the modal analysis results. Table 1 shows the eigenvalues from modal analysis.
[ K] Φ = [ M] ΦΛ (1)
According to the Table 1, the TE, TT and S3 sections were considered to have excellent resistance against local buckling.
Considering the high strength of FRP, its cross section to be determined during the FRP deck design is dependent on the displacement rather than its strength. In addition, for the practical purpose of an FRP deck with respect to standardization and mass production, the sectional shape should be able to be made by the pultrusion method. From the analysis results, the T and S3 section were to have good serviceability and easy production by the pultrusion method.
3. Basic shape specifications of FRP bridge decks
It is found that according to the analysis of structural characteristics and easy manufacture for various FRP deck shapes, rectangular (R)
(a) Group 1(b) Group 2
(c) Group 3
<Longitudinal Dir> <Transverse Dir>
Fig. 2 Deformed shape of FRP bridge deck shape
Table 1 Eigenvalues of shapes(×105)
Mode H T R4 S3 TT TE CE TS1 TS2 XS
1 2.89 1.44 2.31 4.13 4.61 6.67 -1.27 2.05 1.25 1.28
2 3.29 1.58 3.88 4.59 4.90 6.72 -1.28 2.15 -1.63 1.58
3 4.82 2.39 4.23 6.94 6.99 6.91 -2.20 3.33 -1.63 2.19
4 5.44 2.57 4.31 7.20 7.02 7.12 -2.27 3.45 2.03 2.30
5 6.25 2.89 4.67 7.40 7.12 -8.14 -3.71 3.50 2.39 -2.43
and triangle (T) typed sections were most effective. So, the parameter study was conducted to gather the basic data required for the decision of approximate specifications of an FRP deck. The factors used in the analysis were limited to the height of the FRP deck, web interval, thickness of flange and web.
3.1 B/H ratio
The structural analysis was conducted by changing the ratio of B/H (web interval/FRP deck height) until it reached 1/2, while the thickness of upper and lower flanges were fixed. For an effective analysis, the deck height (H) was fixed to 1 to make the web space and thickness become dimensionless. In addition, to make equal sectional areas, the web thickness of each shape was changed according to a web interval and described the ratio of web thickness against the deck height as shown in Table 2.
3.1.1 Displacement analysis
The optimal interval between webs was decided from the displacement analysis subject to B/H ratio. For an effective analysis, the displacement of R section was set to be 1 when the B/H ratio is 1.0, and then made the displacement by section and web intervals dimensionless. The relative displacement of each deck section by the B/H ratio is shown in Fig. 3(a). It is observed from the figure that the displacement decreased as the B/H ratio did, and the boundary that the displacement increase rapidly was found when the B/H ratio equals 0.75.
(a) displacement (b) eigenvalue Fig. 3 Relative displacement and eigenvalue by B/H
3.1.2 Local buckling analysis
The 1st mode's relative eigenvalues at the R and T sections according to the B/H ratios are illustrated in Fig. 3(b).
For the T section, the B/H ratio was found to have a little effect on the buckling load compared with the R section. So, it is recommended that the B/H ratio at the R section should be set to 0.75 around to minimize local buckling possibility.
3.2 Thickness of flange and web
For the structural analysis according to the thickness ratio of web to flange, the B/H ratio was fixed to 0.75 and the thickness of the upper and lower flange was changed from
Table 2 Web thickness/deck height ratio of R & Tsection by B/H
B/H t3/H (R-section) t3/H (T-section)
1.0
0.020
1 10.009
1 10.75
0.015
0.751
0.007
0.751
0.6
0.012
1 0.60.006
1 0.60.5
0.010
1 0.50.005
1 0.510mm to 15mm during the structural analysis.
To make equal sectional areas, the web thickness against the flange thickness was decided as shown in Table 3. Parenthesis of this table means the relative value compared to flange thickness.
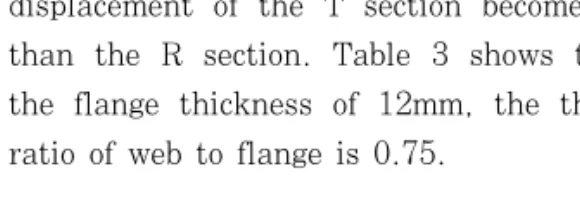
3.2.1 Displacement analysis
For an effective analysis, the maximum displacement of R and T shaped sections was fixed when the flange thickness is set to 10mm. And then, the maximum displacement of each section by the flange thickness was set to be dimensionless and the results are described in Figure 4. According to the figure, the displacement was found to decrease as the flange thickness increased. When the flange thickness was more than 12mm, the displacement of the T section becomes lower than the R section. Table 3 shows that for the flange thickness of 12mm, the thickness ratio of web to flange is 0.75.
Fig. 4 Relative displacement by flange thickness
3.2.2 Local buckling analysis
The relative eigenvalues of the 1st mode at the R and T section computed as varying the flange thickness are illustrated in Fig. 5.
Fig. 5 Relative eigenvalue by section
It is noticed that the thickness ratio between the flange and web has little impact on the buckling load in case of the T section.
But it had a great effect on the buckling load for the R section. As shown in Fig. 5, it was found that the R section has better buckling resistance compared with the T section when considering the same area. So, it is recommended that the thickness ratio of web to flange should be around 1:0.75 in case of the R section in consideration of the analytical results.
4. Verification of the proposed FRP bridge deck prototype
4.1 Bridge model description
In this paper, an optimization process is applied to exemplify a bridge as guided by references (Park et al., 2005; KICT, 2003), considering complex constraints and material properties of bi-directional characteristics of FRP.
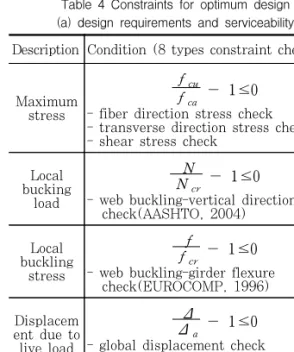
Constraints to the optimum design are shown in Table 4(AASHTO, 2004; EUROCOMP, 1996).
Table 3 Web thickness of R & T section by flange thickness variation (unit: mm)
Flange
thickness R-section T-section
10 (1) 12.0 (1.20) 5.6 (0.56)
11 (1) 10.5 (0.95) 4.9 (0.45)
12 (1) 9.0 (0.75) 4.2 (0.35)
13 (1) 7.5 (0.58) 3.5 (0.27)
14 (1) 6.0 (0.43) 2.8 (0.20)
15 (1) 4.5 (0.30) 2.1 (0.14)
The example bridge for optimization provided in the Design Manuals in Korea (MOCT, 2000) is shown in Table 5. When the optimum design for the example bridge is performed
using the developed optimum FRP deck design algorithm, a pseudo discrete technique is applied because the design variables should be transformed to producible values.
Serviceability was reviewed at the position where the flexure moment reached its maximum by load as shown in Fig. 6.
1,070 2,500 2,500 2,500 2,500 1,070
900 200
Loading Position
Center Line
<Front View>
<Side View>
4,200 4,200
600 24kN 96kN 96kN
(unit: mm) Fig. 6 Loading condition for FRP deck design
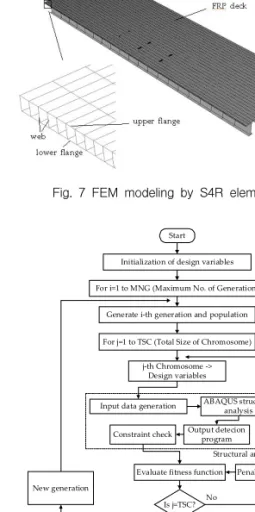
This is because the serviceability part is the most important parameter in the design of FRP deck, considering FRP material characteristics, and the standard design truck load DB-24 specified in the specifications was applied as live load (MOCT, 2005). Regarding the application of the exampled bridge, the finite element modeling girder and bridge deck to the S4R element was conducted as shown in Fig. 7. And the optimization algorithm of FRP deck shapes proposed by Park et al. (2005) is shown in Fig. 8.
Table 4 Constraints for optimum design (a) design requirements and serviceability
Description Condition (8 types constraint check)
Maximum stress
fcu
fca
- 1 ≤0 - fiber direction stress check - transverse direction stress check - shear stress check
Local bucking
load
N
Ncr
- 1 ≤0 - web buckling-vertical direction
check(AASHTO, 2004) Local
buckling stress
f
fcr
- 1 ≤0 - web buckling-girder flexure
check(EUROCOMP, 1996) Displacem
ent due to live load
Δ Δ
a- 1 ≤0 - global displacement check - local displacement check Material
failure
F11f21
+F
22f22+F
66f26+2F
12f1f2+ 2F
16f1f6+2F
26f2f6+F
1f1+F
2f2+F
6f6-1≤0 - Tsai-Wu failure criterion check
Table 4. Constraints for optimum design (continued) (b) fabrication limits
Description Condition
Thickness of
components
tmint
- 1 ≤0, 1 -
t maxt
≤0
Number of ply
n9 - 1 ≤0 Fiber volume
ratio (min., max.)
Vfmin Vf
-1 ≤0,
Vf Vfmax-1 ≤0
First ply failure
PPFPF
-1 ≤0 Strength ratio
fyieldfeq
>1
Ply angle
-90° ≤θ≤90°
In case of this study,
0° or 90° (unidirectional roving)
±45° (woven mat)
Random (continuous strand mat)
Table 5. Specifications of bridge for FRP deck design
Description Specification
Total length 40m
Total width 12.14m
Girder span 2.5m
Number of girder 5
Support condition Simple
Fig. 7 FEM modeling by S4R element
Start Initialization of design variables For i=1 to MNG (Maximum No. of Generation)
Generate i-th generation and population For j=1 to TSC (Total Size of Chromosome)
j-th Chromosome ->
Design variables
Input data generation ABAQUS structural analysis Output detecion
program Constraint check
Is j=TSC? No
Yes Select superior chromosome (Design variables, Constraint check
results, Objecitve function results) Evaluate fitness function
Is i=MNG?
Crossover, reproduction and
mutation New generation
Structural analysis
No
End
Penalty function
Yes
Fig. 8 FRP deck shape optimization algorithm(Park et al., 2005)
4.2 Optimum FRP deck shape specifications
Considering that there is no design standard for FRP bridge decks, the FRP deck shape optimization was performed as shown in Table 6 considering the following factors; the upper and lower flanges are of the same thickness or not, the FRP deck height is fixed at 200mm or not, and the slope angle of web is restricted or not.
The safety factor of design parameters were applied as shown in Table 7(Park et al., 2005).
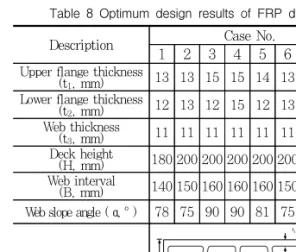
The results of the optimum design are illustrated in Table 8. Table 9 shows the results of the safety factor based on the permissible basis for each constraining condition and structural analysis in the optimal design cross section. The value in parentheses represents the ratio of each safety factor divided by the considered safety factor of Table 7.
4.3 Verification of proposed prototype of FRP deck
From the analysis to determine the FRP deck prototype, it was set to 0.75 as the ratio of web to flange thickness and web interval to deck height.
Table 6 Types of limitation for optimization
Case
No. Height of FRP deck
Slope angle of
web
Upper/lower flange thickness (t
1, t
2)
1 Free Free
t1≠t
22 Free Free
t1=t
23 Free vertical
t1≠t
24 Free vertical
t1=t
25 200mm Free
t1≠t
26 200mm Free
t1=t
27 200mm vertical
t1≠t
28 200mm vertical
t1=t
2Table 7 Safety factor for FRP deck design
Description Safety factor Stress
f1, f
2, f
125.0 Buckling Local buckling 2.0
Displacement
Global
displacement 1.0 (=L/800, L: span
length) Local
displacement
Failure Material failure 5.0
Table 10 shows the results of the thickness ratio of web to flange and the web interval to deck height calculated at the optimization process.
The value in parentheses represents the ratio of each value divided by 0.75. These results indicate that these ratios are nearby 0.75 and this value can be applied to a
simple estimation to outline FRP deck shape specifications.
5. Conclusions
In this paper, the prototype of FRP decks is proposed by the FEM analysis and the ratio calculation is verified. The following summarizes what has been discussed in the paper.
1) According to the analysis on structural characteristics and easy manufacture by the pultrusion method for various FRP deck shapes, rectangular and triangle type sections were found to be most effective.
2) It is concluded based on the results from the parameter study on rectangular and triangle type sections that the rectangular
Table 8 Optimum design results of FRP deckDescription Case No.
1 2 3 4 5 6 7 8
Upper flange thickness
(t1, mm) 13 13 15 15 14 13 15 15 Lower flange thickness
(t2, mm) 12 13 12 15 12 13 12 15 Web thickness
(t3, mm) 11 11 11 11 11 11 11 11 Deck height
(H, mm) 180 200 200 200 200 200 200 200 Web interval
(B, mm) 140 150 160 160 160 150 160 160 Web slope angle ( α, ° ) 78 75 90 90 81 75 90 90
Legend
t1
t2 B
α t3
t3 α
H
B
Table 9 Results of safety factor assessment by constraint
Description S.F Case No.
1 2 3 4
Stress in fibrer Direction ( f
1)
5.05.12 (1.02)
5.19 (1.04)
5.80 (1.16)
5.84 (1.17)
Stress in transverse
Direction ( f
2)
5.0 5.06 (1.01)5.08 (1.02)
5.17 (1.03)
5.18 (1.04)
In plane shear
stress ( f
12)
5.0 5.34 (1.07)5.38 (1.08)
5.45 (1.09)
5.52 (1.10)
Failure criteria
(Tsai-Wu)
5.0 5.15 (1.03)5.18 (1.04)
5.26 (1.05)
5.26 (1.05)
Buckling strength-
web
vertical direction
( N
cr)
2.0 2.96 (1.48)
2.56 (1.28)
2.71 (1.36)
2.86 (1.43)
horizontal
direction ( f
w)
2.0 18.9 (9.45)
18.3 (9.15)
31.9 (15.95)
30.3 (15.15)
Global displacement
1.0 2.12(2.12) 2.21 (2.21)
2.28 (2.28)
2.38 (2.38)
Local displacement
1.0 1.06(1.06) 1.05 (1.05)
1.04 (1.04)
1.04 (1.04)
Description S.F Case No.
5 6 7 8
Stress in fiber Direction ( f
1)
5.05.56 (1.11)
5.19 (1.04)
5.80 (1.16)
5.84 (1.17)
Stress in transverse
Direction ( f
2)
5.0 5.25 (1.05)5.08 (1.02)
5.17 (1.03)
5.18 (1.04)
In plane shear
stress ( f
12)
5.0 5.30 (1.06)5.38 (1.08)
5.45 (1.09)
5.52 (1.10)
Failure criteria
(Tsai-Wu)
5.0 5.24 (1.05)5.18 (1.04)
5.26 (1.05)
5.26 (1.05)
Buckling strength-
web
vertical direction
( N
cr)
2.0 2.42 (1.21)
2.56 (1.28)
2.71 (1.36)
2.86 (1.43)
horizontal
direction ( f
w)
2.016.0 (8.00)
18.3 (9.15)
31.9 (15.95)
30.3 (15.15)
Global displacement
1.0 2.10(2.10) 2.21 (2.21)
2.28 (2.28)
2.38 (2.38)
Local displacement
1.0 1.01(1.01) 1.05 (1.05)
1.04 (1.04)
1.04 (1.04)
Table 10 Thickness ratio of web to flange and web interval to deck height
Description Case No.
1 2 3 4 5 6 7 8
Web thickness/
Average flange thickness
0.88 (1.17)
0.85 (1.13)
0.81 (1.08)
0.73 (0.97)
0.85 (1.13)
0.85 (1.13)
0.81 (1.08)
0.73 (0.97)
Web interval/
Deck height
0.78 (1.04)0.75 (1.00)
0.80 (1.07)
0.80 (1.07)
0.80 (1.07)
0.75 (1.00)
0.80 (1.07)
0.80 (1.07)