960
Copyright © 2015 The Korean Society of Fisheries and Aquatic Science pISSN:0374-8111, eISSN:2287-8815
서 론
동중국해는한국
,
일본,
중국에둘러싸인해역으로쓰시마난 류,
양자강유출수,
그리고황해저층냉수가유출입하여다양한 해양환경이나타나는해역이다.
또한이해역은국내주요수산 어종의주요산란장및성육장이며,
어업생산량이국내연근해 와비교시상대적으로높은해역으로알려져있다(FRA, 2013;
Liu, 2013).
따라서동중국해와같은국내주요어장의관리를위해서수산자원의시
·
공간적인분포및현존량에대한기초적 인연구가지속적으로수행되고있다.
국내에서수산자원의분포및현존량파악을위한조사는주
로트롤
,
자망등의어획기법을통해서진행되고있다(Kim et
al., 2010; Choi et al., 2012; Seo et al., 2013).
이러한조사는다 양한어종이혼재되어분포하는우리나라연근해어류의종조성을명확하게규명할수있다는장점을가지고있지만상대적 으로많은시간과비용
,
노동력등이소요된다고알려져있다(Kim, 1991).
반면수중음향을이용한수산자원조사는어획기법을이용하는조사에비해단기간에적은노동력과비용으로 넓은해역을조사할수있다는장점을가지고있다
.
또한음향 조사는연구자의주관을배제시키고사전에설정된조사정선으 로부터연속적이며수층전체에대한객관적인자료를얻을수 있으며,
우점종이분포하는해역에서우점어류의음향반사강 도(Target strength, TS)
특성이제공된다면현존자원량까지산 정이가능하다(Simmonds and MacLennan, 2005).
하지만측 정한음향자료를우점어종의밀도로변환시주요음향변수인 어류의음향산란특성은어종별로편차를보이고,
국내주요어 종중아직연구되지못한어종이많기때문에단독으로수산자원량을산정하기위해서는부족한점이있다
(Hwang, 2015).
따2014년 동계 북부 동중국해 저층 트롤 및 음향학적 조사에 의한 저서어족 생물자원의 분포특성 비교
허유심·이형빈·최정화
1*·차형기
국립수산과학원 연근해자원과, 1국립수산과학원 남동해수산연구소
Comparison of the Distribution of Demersal Fish Biomass Determined by Bottom Trawl and Hydroacoustic Surveys in the Northern East China
Sea in Winter, 2014
Yusim Heo, Hyungbeen Lee, Jung Hwa Choi
1
* and Hyung Kee ChaCoastal Water Fisheries Resources Research Division, National Institute of Fisheries Science, Busan 46083, Korea
1
Southeast Sea Fisheries Research Institute, National Institute of Fisheries Science, Tongyeong 53085, Korea
This study examined the spatiotemporal distribution of demersal fish aggregations in the Northern East China Sea by conducting a trawl survey with hydroacoustic devices. A bottom trawl was used for this survey and fish density was determined from the catch data. Acoustic data were collected at frequencies of 38 and 200 kHz from November to December 2014 and converted into the nautical area scattering coefficient (NASC, m
2/n∙mile
2). In the catch data analysis, the range of catch per unit area by station was 26-8,055 kg/km
2and for the acoustic data, that of the NASC was 0.45-34.80 m
2/n·mile
2. The values were significantly correlated. The combined results of both surveys found that the density was highest at St. 5 (33° 10.3´, 126° 23.3´) and lowest at St. 8 (33° 20.7´, 127° 36.3´). The application of hydroacoustic methods offers a new approach for estimating the biomass of demersal fish aggregations.
Key words: Hydroacoustic survey, Demersal fish aggregation, Acoustic estimated, Bottom trawl
This is an Open Access article distributed under the terms of the Creative Commons Attribution Non-Commercial Licens (http://creativecommons.org/licenses/by-nc/3.0/) which permits unrestricted non-commercial use, distribution, and reproduction in any medium, provided the original work is properly cited.
http://dx.doi.org/10.5657/KFAS.2015.0960 Korean J Fish Aquat Sci 48(6) 960-968, December 2015
Received 13 November 2015; Revised 25 Novemebr 2015; Accepted 11 December 2015
*Corresponding author: Tel: +82. 55. 640. 4720 Fax: +82. 55. 641. 4774
E-mail address: [email protected]
라서전세계적으로어획과음향의두가지기법을병행하여수 산자원연구를진행중에있다
(Von Szalay et al., 2007; Zwo- linski et al., 2012).
국내주요수산자원조사기법중하나인저층어획조사는해 저면부근에분포하는저어류를대상으로연구를진행한다
.
반 면에생물음향기법의경우저층어류에대해서는해저면신호 의분리에대한단점때문에저서어군의군집크기,
분포특성 및군집의안정성파악에는한계를가지고있다.
따라서음향조 사는해저면부근어종식별에한계가있기때문에전세계적 으로중층어류의분포및자원량산정에집중되어있다(Honk- alehto et al., 2011; Zwolinski et al., 2012).
저층어류신호분 석에대한제한점을극복하기위해서획득한음향자료에대한 음향자료처리의중요성이대두되고있다(Kang et al., 2011).
이 러한음향자료처리기술의발달로인하여해저면과분리가가 능한조건에서저서어류의시·
공간적인구조및자원량조사가 제한적으로진행되고있다(McQuinn et al., 2005).
국내에서도 최근들어음향자료처리기술발달과더불어음향과어획기법 을활용하여저층어류분포특성및자원량에대한연구가진행 되고있다(Kang et al., 2008; Lee et al., 2012; Lee et al., 2015).
본연구에서는제주도인근북부동중국해저어류를대상으로 어획과음향기법을이용한수산자원조사를실시하였다
.
저층 트롤조사를통해획득한어획자료와동시에획득한음향자료를 이용하여조사해역내어류밀도를추정하였고,
추정된두기법 의자료를비교하여음향기법을이용한저층어류신호분석및 자원량추정가능성을확인하였다.
재료 및 방법
본연구는제주도남부의북부동중국해해역에서동계시기인
2014
년11
월29
일부터12
월11
일까지국립수산과학원의자원 조사선인탐구20
호(R/V Tamgu 20)
를이용하여트롤어획및 음향학적조사를16
개정점에대해서실시하였다(Fig. 1).
어획조사는저층트롤어구
(Hand rope: 41 m, Net pendant:
96 m, Cod end size: 20 mm)
를이용하여주간시기에진행하였 고,
정점별약3
노트의선속으로30
분동안예망하였다(Table 1).
조사정점별수심은69-141 m (
평균93 m)
이였고,
해저면부Table 1. Detail on the acoustic and bottom trawl surveys
Transect Acoustic & Trawl locations Depth Range
Start End (m) (n·mile)
1 33° 14.6´, 124° 25.5´ 33° 12.6´, 124° 25.8´ 69 1.99
2 33° 12.5´, 124° 49.2´ 33° 11.8´, 124° 47.5´ 76 1.61
3 33° 16.9´, 125° 19.3´ 33° 16.5´, 125° 17.5´ 85 1.67
4 33° 10.8´, 125° 49.0´ 33° 09.1´, 125° 48.9´ 93 1.56
5 33° 10.3´, 126° 23.3´ 33° 09.5´, 126° 24.8´ 99 1.62
6 33° 07.8´, 126° 42.4´ 33° 08.1´, 126° 44.3´ 103 1.63
7 33° 17.5´, 127° 16.7´ 33° 16.5´, 127° 18.3´ 141 1.62
8 33° 20.7´, 127° 36.3´ 33° 21.1´, 127° 37.6´ 117 1.63
9 32° 51.1´, 124° 53.9´ 32° 50.4´, 124° 54.9´ 75 1.14
10 32° 43.0´, 125° 14.0´ 32° 42.1´, 125° 15.8´ 72 1.67
11 32° 44.4´, 126° 18.4´ 32° 45.9´, 126° 17.5´ 109 1.69
12 32° 50.1´, 126° 41.5´ 32° 51.7´, 126° 41.5´ 109 1.60
13 32° 27.8´, 125° 22.8´ 32° 26.1´, 125° 23.1´ 70 1.85
14 32° 17.9´, 125° 37.0´ 32° 18.8´, 125° 38.8´ 73 1.66
15 32° 21.0´, 126° 09.9´ 32° 21.0´, 126° 12.0´ 98 1.64
16 32° 22.5´, 126° 36.3´ 32° 24.1´, 126° 36.0´ 109 1.76
Fig. 1. Location of the hydroacoustic and bottom trawl survey area in the Northern East China Sea.
터약
3.5 m
까지의범위에대해서어획조사가진행되었다.
어 획된어류는조사선내에서Kim et al. (2005)
를기준으로종 수준까지동정하였고,
동정된어류는종별로개체수,
중량(1 g),
길이(0.1 cm)
를측정하였다.
어획자료분석시음향조사결 과와비교를위해어획된어류중음향자료처리가불가능한해저면부근데드존
(dead zone)
에서식하는어류를제외하였다.
조사해역내어류밀도의단위면적당개체수
(inds./km
2)
와생 체량(kg/km
2)
은소해면적법을사용하여산정하였고,
어획효율(q)
은기존연구를토대로0.5
로설정하였다(Prodo, 1990).
환경 조사는어획조사후16
개의정점에대해서CTD (conductivity- temperature-depth; Sea-Bird, SBE 911plus)
를이용하여실시 하였다.
음향조사는조사선에 설치된선저형과학어군탐지기
(EK60 scientific echosounder; Simrad, Norway)
를이용하여실시하 였다.
본조사에사용한음향센서는분할빔방식(split- beam)
의38 kHz
와200 kHz
주파수를사용하였고,
음향자료획득시 신호길이(pulse length)
와송신 간격(pulse duration)
은 각각1.024 ms
와2 pings/s
로설정하여음향자료를획득하였다(Ta- ble 2).
음향조사전음향시스템은교정구(calibration sphere)
를이용하여 교정을실시하였고,
자세한음향시스템변수는Table 2
에정리하였다.
음향자료처리는획득한후방체적산란강도
(Volume backscat- tering strength, SV)
자료중어획조사가실시된음향정선에 대해서분석을실시하였다.
분석은음향자료처리전용프로그 램(Echoview ver 6.1; Myriax software Pty Ltd, Hobart, Tas-
mania, Australia)
을이용하여가상에코그램방식으로진행하였다
.
음향자료처리는조사해역에서획득한신호를해저면,
어 획장비운영등에의해서발생한노이즈제거후,
저층어획자 료와비교를위해음향자료를해저면부터해저면위3.5 m
수 층을분리하였다.
분리된음향 신호내 어류외기타 산란체인 동물플랑크톤 및해파리등기타생물신호의제거를위해서후방체적산란 강도차이법
(Mean Volume Backscattering Strength, MVBS)
을 이용하였다
(Kang et al., 2002). MVBS
기법의활용시두 주파수의신호범위는어류의자원량산정에큰영향을준다. Kang et al. (2002)
은명태(walleye pollock)
에대해서‒1 dB
< MVBS
38-120 kHz< 4 dB, Gauthier and Horne (2004)
은청어(herring)
에대해서3 dB < MVBS
38-120 kHz< 9 dB
의범위를설 정하여자료처리시활용하였다.
본연구에서는저층어류에대한
MVBS
의범위에대한연구는거의이루어지지않았고다양한어종이혼재되어분포하였기때문에최근에연구된
Sato et al. (2015)
의38 kHz
와200 kHz
범위를활용하여기타산란 체의신호를제거하였다.
따라서MVBS
의범위는38 kHz
와200 kHz
의다중주파수로획득한음향자료중어류로판단되는신호인
2 dB < SV
38-200 kHz< 16 dB
로선정하여어류에의한 음향신호만남기고제거하였다(Sato et al., 2015). MVBS
기법을이용한자료처리후
38 kHz
주파수에대한면적산란계수(Nautical Area Scattering Coefficient, NASC, m
2/n·mile
2)
를 추출하였다.
추출된음향자료에대해서MABLAB
프로그램을 이용하여분석을진행하였고,
정점별음향조사결과에대해서 저층어획조사와피어슨상관계수(Pearson correlation)
를이용 하여상관분석을실시하였다.
결과 및 고찰
본조사해역의해양환경은수온과염분각각
15.72-20.25°C
와32.15-34.62 psu
로동계시기이기때문에수온및염분모두 수직적인분포가유사하였다(Fig. 2, Fig. 3).
조사해역의수평 적인해양환경은동쪽해역은서쪽해역에비해서상대적으로높 은수온분포를보였고,
남쪽해역으로갈수록수온이상승하였다
(Fig. 2).
염분또한동쪽해역이서쪽해역에비해서상대적으로높았고
,
남북의염분분포는유사하였다(Fig. 3).
어획조사는총
16
개의정선1.14-1.99 n·mile
범위에대해서 진행되었으며,
수심은69-141 m
였다(Table 1).
트롤조사를진 행한거리를고려한소해면적범위는0.0429-0.0796 km
2였다.
어획된자료와음향자료와의 비교를위해음향데드존에분 포하는가자미목,
홍어목,
아귀목등총10
종을제외한종조성은
Table 3
과같았다.
음향데드존에분포하여제외된어종의개체수는
1%
미만이었다.
어획된어류의정점별출현어종수는
6-32
종으로분류되었고,
단위면적당어획된어류의개체수와생체량은
272-133,040 ind./km
2와26.1-8,055.0 kg/km
2의 범위를보여정점별로큰편차를보였다.
주요어종은조사정 점별로차이를보였지만샛돔(Psenopsis anomala),
꼬치고기(Sphyraena pinguis),
민어(Miichthys miiuy),
달고기(Zeus fa- ber)
가우점하였다.
어획된어종은멸치(Engraulis japonicus),
고등어(Scomber japonicus),
전갱이(Trachurus japonicus)
등 의일부부어류를제외하고대부분저어류가어획되었다.
저인 망은저어류가주로어획되는어구로알려져있지만주간시기 주야수직이동(diel vertical migration)
또는일시적으로유집되는부어류도어획되는것으로알려져있다
(Lee, 1999).
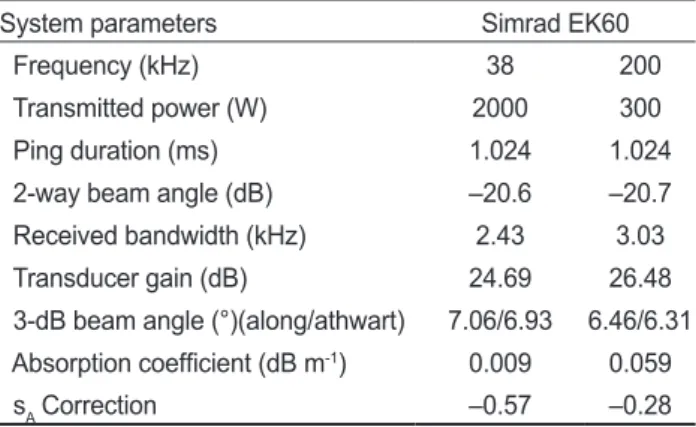
조사Table 2. System parameters calibrated for the acoustic survey
System parameters Simrad EK60
Frequency (kHz) 38 200
Transmitted power (W) 2000 300
Ping duration (ms) 1.024 1.024
2-way beam angle (dB) ‒20.6 ‒20.7
Received bandwidth (kHz) 2.43 3.03
Transducer gain (dB) 24.69 26.48
3-dB beam angle (°)(along/athwart) 7.06/6.93 6.46/6.31 Absorption coefficient (dB m-1) 0.009 0.059
sA Correction ‒0.57 ‒0.28
해역내우점종은
18.0-94.2%
의넓은범위의편차를보였고,
특정정점에서민어성체가어획되어높은우점율을보였다
(Table
3).
Fig. 4
는각각St. 8
과St. 5
에서38 kHz
를이용하여수신된에코그램의예이다
. St. 8
의경우전수층에어류신호가거의없고
,
어획조사가실시된해저면부근또한‒80 ~ ‒60 dB
범위 의낮은강도신호가측정되었다[Fig. 4(a)].
반면St. 5
는어류로판단되는
‒60 dB
이상의범위의강한음향신호가해저면부근에혼재되어수신되었다
[Fig. 4(b)].
본신호들은자료처리를통 해서상대적인음향밀도로추출하여어획결과와비교하였다.
어획기법조사에서가장높은자원밀도와가장낮은자원밀 도를보인정점은각각St. 8
과St. 5
로약300
배이상의큰차이를보였다
[Fig. 5(a)].
음향기법을이용하여저층어류신호에대하여
NASC
를이용한상대적인밀도를분석한결과0.45-
34.80 m
2/n∙mile
2의범위로나타났다[Fig. 5(b)].
조사해역중 가장높은NASC
값을보인지역은St. 5
였고,
반대로가장낮 은NASC
값을보인지역은St. 8
로정점별편차를보였으나최 대와최소음향밀도정점은어획결과와동일하였다.
중층어류의분포및자원량은해양환경에큰영향을받는것
으로알려져있다
.
그예로남해주요중층어종인멸치와오 징어의경우수온의민감한어종으로알려져있다(Kang et al.,
2014; Kim et al., 2014).
반면기존남해에서음향및저층어 Fig. 3. Vertical distribution of salinity along (a) 33.25°N, (b) 32.75°N, and (c) 32.25°N in the Northern East China Sea in winter season, 2014. Each contour interval is 0.5 psu.Fig. 2. Vertical distribution of temperature along (a) 33.25°N, (b) 32.75°N, and (c) 32.25°N in the Northern East China Sea in winter season, 2014. Each contour interval is 0.5°C.
Fig. 4. Example of echograms from volume backscattering strength (SV, dB) at 38 kHz for (a) St.8, and (b) St. 5 in the Northern East China Sea during winter season, 2014.
획조사를통해서연구된저어류의경우수온에큰영향이없었 고
(Lee et al., 2015),
본연구결과또한어획및음향자료를통 한어류의분포와저층수온및염분과의상관성을찾을수없 었다. McConnaughey and Smith (2000)
의연구에서는해저면 퇴적물타입과저층어류분포및밀도와의상관성에대한연구가진행중에있다
.
따라서조사해역내해저면퇴적물타입 과저층어류종조성및자원량에상관성에대하여추가로진 행할것이다.
음향기법을이용하여획득한상대적인밀도인
NASC
결과와 어획결과는높은상관성을보였다(r=0.94, n=16) (Fig. 7).
또 한어획자료와음향자료와의비교시어획된어류의생체량에 비해서상대적으로음향신호가강한정점에서민어가우점하 여어획되었다(Table 3).
민어는경골어류로일반적인저서성 어류와다른형태를가지고있으며부레가잘발달된어종임으 로타어종에비해서강한음향신호가나타난것으로판단된다(Lee et al., 2007).
또한조사해역내에서어획된민어의길이(Total length)
는34.29 cm (±15.47)
로기타어종의길이분포 인15.47 cm (±12.63)
에비해서약2.2
배크기때문에상대적 으로강한음향신호가나타나어획량과의오차에영향을준것 으로판단된다.
국내외적으로민어의음향특성에대한연구가 진행되지않아서조사해역내민어의정확한밀도및자원량산 정이불가능하다.
따라서본해역의저층어류의자원량산정시 민어에대한음향특성연구가선행되어야할것으로판단된다.
음향을이용한저층어류의밀도는기존에연구된조사해역인 제주서쪽연안의경우NASC
가0.2-231.6 m
2/n∙mile
2의범위 로본연구의조사해역내최대밀도인34.8 m
2/n∙mile
2보다약6.7
배크게나타났다(Kang et al., 2008).
이는연안해역의경 우상대적으로어류의변동이많고낮은수심으로인한부어류 의유입가능성때문에본조사결과보다높은자원량이분포 한것으로판단된다.
따라서본조사해역내지속적인음향조사를통해서
NASC
결과를이용한밀도산정에대한연구가진행되어야한다
.
NASC
는음향생물량을나타내는척도로사용된다.
현장에서획득한
SV
는음향빔내에서탐지되는개개어종에대한음 향반사강도함수[TS=20·log
10(fish length, cm)+b
20]
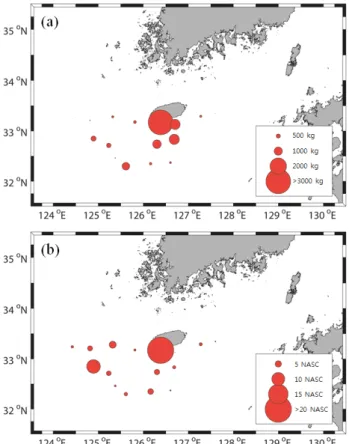
를이용하 여조사해역의어류밀도로변환및현존량산정이가능하여Fig. 6. Spatial variation of trawl catch per unit area (kg2/km2) and NASC (m2/n∙mile2) of demersal fish.
Fig. 7. Relationship between trawl catch per unit area (kg2/km2) and NASC (m2/n∙mile2) of demersal fish.
Fig. 5. Geographical distribution of demersal fish biomass using bottom trawl (a) and acoustic method (b) in the Northern East China Sea in winter season, 2014.
Table 3. Species composition of fish collected by a bottom trawl in the Northern East China Sea, 2014. N and W are number of individuals per unit area (ind./km
2) and wet weight per unit area (kg/km
2), respectively Station 1 2 3 4 5 6 7 8 Species N W N W N W N W N W N W N W N W Acropoma japonicum 31 0.1 30 0.3 2155 7.6 59158 993.0 5843 22.0 370 0.5 Apogon lineatus 31 0.1 3453 14.6 Trachurus japonicus 30 1.0 145 5.9 1794 82.0 26 1.3 27 1.2 Psenopsis anomala 190 23.3 22506 2292.8 1871 226.8 502 73.3 Etrumeus teres 26 1.1 26 1.3 27 1.9 Conger myriaster 50 5.4 123 29.6 26 12.9 Chaeturichthys hexanema 246 0.2 Hoplichthys gilberti 79 1.7 11 0 2.2 Coleorhyncus japonicus 30 0.4 Branchiostegus japonicus 32 11.6 174 67.3 1410 164.4 Thamnaconus modestus 29 10.5 26 12.2 27 12.4 Muraenesox cinereus Miichthys miiuy 75 18.3 31 6.9 212 93.9 Argyrosomus argentatus 31 0.6 182 6.9 26 5.0 26 4.1 Pseudosciaena crocea Scomber japonicus 30 10.4 32 8.6 26 7.9 26 14.8 Scomberomorus niphonius 77 57.2 Pagrus major 1244 414.0 77 48.4 Dentex tumifrons 3269 285.6 2204 139.1 26 9.9 27 5.7 Sphyraena pinguis 30 3.7 11513 2514.3 461 102.9 Pampus echinogaster 51 17.9 26 17.9 Dysomma anguillare 61 8.0 Saurida wanieso 26 23.7 Takifugu chinensis 30 32.1 Zu cristatus 32 29.5 Trichiurus lepturus 738 0.6 121 13.7 412 49.8 984 128.3 26 2.3 Chelidonichthys spinosus 25 6.1 338 32.3 1060 63.7 58 3.8 Zeus faber 30 17.0 444 234.7 3558 1027.8 436 194.9 185 176.9 27 2.7 etc. 1532 5.4 1506 9.8 1363 23.6 63 18.5 30403 31 1.7 1743 136.5 159 3.6 Total 1682 35.2 3136 88.2 6601 281.3 3360 383.6 133041 8055 16149 1257.2 1451 305.3 245 26.1
Table 3. continued Station 9 10 11 12 13 14 15 16 Species N W N W N W N W N W N W N W N W Acropoma japonicum 12937 51.2 201 16 49.8 28 0.1 4524 13.2 Apogon lineatus 1495 6.3 877 2.5 7260 31.3 28 0.0 5691 21.1 138 0.6 Trachurus japonicus 27 1.6 5751 287.8 28 1.0 11 0 9.8 Psenopsis anomala 47 2.1 82 8.8 55 9.9 111 16.0 772 77.9 Etrumeus teres Conger myriaster 47 17.4 94 6.7 109 36.3 28 2.5 Chaeturichthys hexanema 28 0.1 28 0.1 Hoplichthys gilberti Coleorhyncus japonicus 191 3.7 Branchiostegus japonicus 55 2.5 83 10.5 55 3.2 Thamnaconus modestus Muraenesox cinereus 28 41.0 Miichthys miiuy 1121 465.4 1472 484.7 191 117.5 11 3 54.4 2772 901.8 278 102.9 Argyrosomus argentatus 187 4.3 31 0.8 164 36.1 Pseudosciaena crocea 93 15.8 28 5.0 Scomber japonicus 55 14.5 28 5.0 93 17.2 555 135.7 11 0 25.9 Scomberomorus niphonius 55 54.5 Pagrus major 47 15.0 Dentex tumifrons 55 1.1 1789 98.8 Sphyraena pinguis 55 6.0 495 90.9 28 4.7 Pampus echinogaster Dysomma anguillare 47 7.8 56 3.0 Saurida wanieso 165 187.5 Takifugu chinensis 27 25.2 Zu cristatus Trichiurus lepturus 701 1.0 94 3.3 1883 36.7 468 34.9 170 0.1 125 0.2 111 19.5 276 21.2 Chelidonichthys spinosus 1121 56.9 407 45.7 1037 111 .5 57 33.0 156 16.2 28 2.2 55 4.7 Zeus faber 31 22.0 328 137.6 523 335.2 83 43.0 etc. 9576 46.2 2881 10.3 6742 452.6 413 74.4 763 4.1 405 6.2 583 11.7 441 2.6 Total 14389 622.4 5887 576 31 198 1074.2 29913 1234.2 1187 99.1 3644 957.4 7525 318.3 6648 247.9
국내일부해역에서저층어류에대한연구가진행되었다
(Sim- monds and MacLennan, 2005; Kang et al., 2008; Lee et al.,
2012).
음향기법을이용한어류밀도는조사해역우점어류의음향특성과길이분포를이용하여산정이가능하다
.
하지만조 사해역16
개정점에서우점어종별큰편차를보였고,
민어를 제외한어종의우점비율은60%
였다(Table 3).
또한조사해역 내주요어종의음향특성은고등어,
갈치등의중층주요어종 을제외하고는음향특성에대한연구가진행되지않았고,
저층 어종의형태는일반어종과는차이를보이기때문에저층어종 에대한음향특성연구가진행되어야만정확한밀도산정이가 능할것으로판단된다.
2009
년부터국립수산과학원에서는국내모든근해에서저층트롤을이용한어획조사와과학어탐을이용한음향조사가동시 에진행되고있다
.
차후국내근해의저층어류분포및자원량 에대한연구를본결과를바탕으로진행하여국내저층어류의 변동에대한연구에기초자료가될것으로판단된다.
음향기법을통한어류자원량산정을위해서는각대상우점 어종에대한음향산란특성을파악하여야한다
.
하지만국내저 층어류에대한음향특성연구는부어류에비해서상대적으로 거의이루어지지않았다.
따라서향후저층어류에대한음향산 란특성이보안된다면두기법의장점을상호보완적으로활용하 여동중국해는물론우리나라연근해의수산자원을보다정도 높은현존량변동추정이가능할것으로판단된다.
사 사
이 논문은
2015
년 국립수산과학원 수산과학연구사업(R2015024)
의지원으로수행된연구이며연구비지원에감사드립니다
.
References
Choi KH, Han MH, Kang CK,Park JM, Choi JH, Park JH, Sohn MH, Baeck GW, Choi EJ and Lee CI. 2012. Seasonal variations in species composition of fish assemblage col- lected by trammel net in coastal waters of the East Sea. J Kor Soc Fish Tech 48, 415-427. http://dx.doi.org/ 10.3796/
KSFT.2012.48.4.415.
Fisheries Research Agency. 2013. The Current Status of Inter- mational Fishery Stocks. Retrieved from http://kokushi.job.
affrc.go.jp on june 17.
Gauthier S and Horne JK. 2004. Acoustic characteristics of for- age fish species in theGulf of Alaska and Bering Sea based on Kirchhoff-approximation models. Can J Fish Aquat Sci 61, 1839–1850.
Honkalehto T, Ressler PH, Towler RH and Wilson CD. 2011.
Using acoustic data from fishing vessels to estimate walleye pollock (Theragra chalcogramma) abundance in the eastern Bering Sea. Can J Fish Aquat Sci 68, 1231-1242.
Kang DH, Im YJ, Lee CW, Yoo JT and Myoung JG. 2008. Hy- droacoustic survey of spatio-temporal distribution of de- mersal fish aggregations near the west coast of Jeju Island, Korea. Ocean and Polar Res 30, 181-191.
Kang DH, Lee CW, Cho SH and Myung JG. 2008. Hydroacous- tic survey of spatiotemporal stability and distribution of de- mersal fish aggregations in the coastal region. Ocean and Polar Res 30, 79-87.
Kang MH, Furusawa M and Miyashita K. 2002. Effective and accurate use of difference in mean volume backscattering strength to identify fish and plankton. ICES J Mar Sci 59, 794-804.
Kang MH. 2011. Semiautomated analysis of data from an imag- ing sonar for fish counting, sizing, and tracking in a post- processing application, Fish Aquat Sci 14, 218-225. http://
dx.doi.org/ 10.5657/FAS.2011.0218.
Kang MH, Choi SG and Hwang BK. 2014. Acoustic charac- teristics of anchovy schools, and visualization of their con- nection with water temperature and salinity in the South- western Sea and the Westsouthern Sea of South Korea. J Kor Soc Fish Tech 50, 39-49. http://dx.doi.org/ 10.3796/
KSFT.2014.50.1.039.
Kang MH, Seo YI, Oh TY, Lee KH and Jang CS. 2015. Es- timating the biomass of anchovy species off the coast of Tongyeong and Yeosu in South Korea in the spring and win- ter of 2013 and 2014. J Kor Soc Fish Tech 51, 86-93. http://
dx.doi.org/10.3796/KSFT.2015.51.1.086.
Kim IS, Choi Y, Lee CL, Lee YJ, Kim BJ and Kim JH. 2005.
Illustrated book of Korean fishes. Kyo-hak Pub. Ltd., Seoul, Korea, 1-615.
Kim JJ, Kim CH, Lee JS and Kim S. 2014. Seasonal charac- teristics of Todarodes pacificus paralarval distribution in the northern east China Sea. Korean J Fish Aquat Sci 47, 59-71.
http://dx.doi. org/ 10.5657/FAS.2014.059.
Kim YS, Choi JH, Kim JN, Oh TY, Choi KH, Lee DW and Cha HK. 2010. Seasonal variation of fish assemblage in Sacheon marine ranching, the southern coast of Korea. J Kor Soc Fish Tech 46, 335-345. http://dx.doi.org/10.3796/
KSFT.2010.46.4.335.
Lee JB, Oh TY, Yeon IJ, Kim BY, Shin HY, Hwang BK, Lee KH and Lee YW. 2012. Estimation of demersal fish biomass using hydroacoustic and catch data in the marine ranching area (MRA) of Jeju. J Kor Soc Fish Tech 48, 128-136. http://
dx.doi.org/10.3796/KSFT.2012.48.2.128.
Lee KH, Choi JH, Shin JK, Chang DS and Park SW. 2009.
Acoustic backscattering strenth chracteristic and density estimates of Japanese common squid distributed in Yel- low Sea. J Kor Soc Fish Tech 45, 157-164. http://10.3796/
KSFT.2009.45.3.157.
Lee KH, Yang YS, Kim JK, An HC and Shin JK. 2007. Char- acterization of sounds produced by 3 sciaenid species. J Kor Soc Fish Tech 43, 206-211.
Lee TW. 1999. Seasonal variation in species composition of de- mersal fish in Yongil Bay, East Coast of Korea. Kor J Fish Aquat Sci 32, 512-519.
Lee HB, Kang DH, Im YJ and Lee KH. 2014. Distribution and Abundance of Japanese Anchovy Engraulis japonicus and Other Fishes in Asan Bay, Korea, estimated Hydroacous- tic Survey, Korean J Fish Aquat Sci 47, 1055-1062. http://
dx.doi.org/10.5657/KFAS.2014.0103.
Lee HB, Ses YI, Oh TY, Choi JH, Jo HS and Choi KH. 2015.
Distribution of Demersal Fish Based on a Combined Acous- tic and Trawl Survey during Day and Night in Costal of the South Sea, Korea2015. Korean J Fish Aquat Sci 48, 798- 804. http://dx.doi.org/10.5657/KFAS.2015.0798.
Liu JY. 2013. Status of marine biodiversity of the China Sea.
Plos One 8, 1-24.
McConnaughey RA and Smith KR. 2000. Associations between flatfish abundance and surficial sediments in the eastern Ber- ing Sea. Can J Fish Aquat Sci 57, 2410-2419.
McQuinn IH, Simard Y, Stroud TW, Beaulieu JL and Walsh SJ.
2005. An adaptive, integrated “acoustic-trawl” survey de- sign for Atlantic cod (Gadus morhua) with estimation of the acoustic and trawl dead zones. ICES J Mar Sci 62, 93-106.
Prodo, J. 1990. Fisherman’s Workbook. Blackwell Publ. Co., Oxford, U.K., 1-192.
Simmonds J and MacLennan D. 2005. Fisheries acoustics: The- ory and practice, second edition. Blackwell, Oxford, U.K., 217-261.
Sato M, Horne JK, Parker-Stetter SL and Keister JE. 2015.
Acoustic classification of coexisting taxa in a coastal eco- system. Fish Res 172, 130-136.
Seo YI, Lee JH, Oh TY, Lee JB, Choi YM and Lee DW. 2013.
Distribution and seasonal variations of fisheries resources captured by the beam trawl in Namhae island, Korea. J Kor Soc Fish Tech 49, 419-431. http://dx.doi.org/10.3796/
KSFT.2013.49.4.419.
Von Szalay PG, Somerton DA and Kotwicki S. 2007. Corre- lating trawl and acoustic data in the eastern Bering Sea: A first step toward improving biomass estimates of walleye pollock (Theragra chalcogramma) and Pacific cod (Ga
dus macrocephalus). Fish Res 86, 77-83. http://10.1016/j.
fishres.2007.05.005.
Zwolinski JP, Demer DA, Byers KA, Cutter GR, Renfree JS, Sessions TS and Macewicz BJ. 2012. Distributions and abundances of Pacific sardine (Sardinops sagax) and other pelagic fishes in the California Current Ecosystem during spring 2006, 2008, and 2010, estimated from acoustic–trawl surveys. Fish Bull 110, 110-122.