529
Copyright © 2015 The Korean Society of Fisheries and Aquatic Science pISSN:0374-8111, eISSN:2287-8815
서 론
동해는동아시아와일본에둘러싸인반폐쇄구조의대륙주변 해로서
,
총면적이1.01×10
6km
2이고수심은평균1,350 m,
최대
3,700 m
이다.
동해의북쪽은폭이좁은대륙붕에서급경사대륙사면이형성되어심해저로연결되지만
,
남쪽은북쪽에비 해넓은대륙붕이형성되어있으며대한해협을지나동쪽으로평균수심
120 m
정도의평탄한지형으로이루어져있다(Lee
and Kim, 2007).
동해는북한한류가대륙붕연안을따라남하하다가대한해협을통해유입되는고온고염의대마난류와약
37°N
부근에서강한수온전선을형성하는데,
이해역은기초생산력이높고다양한먹이생물이번식하여동해수산자원의중 요한어장과성육장의역할을한다
(Choi et al., 2008; Gong et al., 2010).
또한수온에따라다양한한류성,
난류성,
온대성어 종들이서식하고회유나생활사에따라연안정착성,
심해성,
회 유성어종들이함께출현하고있어,
생물다양성의측면에서도 매우중요한곳이다(Kim and Nam, 2003).
우리나라에서식하는전체해산어류는약
947
종이고,
이중동해구외끌이중형저인망에 의한 동해 중남부 해역 저어류의 종조성 및 군집구조
손명호·박정호*·윤병선·최영민
1·김진구
2국립수산과학원 동해수산연구소 자원환경과, 1국립수산과학원 서해수산연구소 자원환경과, 2부경대학교 자원생물학과
Species Composition and Community Structure of Demersal Fish Caught by a Danish Seine Fishery in the Coastal Waters
of the Middle and Southern East Sea, Korea
Myoung Ho Sohn, Jeong-Ho Park*, Byoung Sun Yoon, Young Min Choi1 and Jin-Koo Kim2
Fisheries Resources and Environment Division, East Sea Fisheries Research Institute, National Fisheries Research and Development Institute, Gangnung 25431, Korea
1
Fisheries Resources and Environment Division, West Sea Fisheries Research Institute, National Fisheries Research and Development Institute, Incheon 22384, Korea
2
Department of Marine Biology, Pukyong National University, Busan 48513, Korea
We examined the species composition and community structure of demersal fish in the middle and southern coastal waters of the East Sea of Korea by surveying a commercial Danish seine fishery from 2010 to 2013. We considered the waters north of 37°N as middle and those south of 37°N as southern waters. A total of 79 demersal fish species belong- ing to 18 families were collected. Of these, 59 species (77.6%) inhabited only the East Sea as opposed to the West and South Seas of Korea, and most were resident species. The species and biomass were similar between the two portions of the study area. The sandfish Arctoscopus japonicus (78.0%) and the blackfin flounder Glyptocephalus stelleri (65.1%) were the most common species and accounted for the most biomass in the middle and southern waters, respectively.
Fish were most abundant at shallow depths (50-100 m) in the middle portion of the East Sea. Using a cluster analysis, we divided the species composition and community structure at the sampling stations into three groups: middle portion (group A), deep area of the southern portion (group B), and shallow areas of the southern portion (group C). A. japoni- cas and G. stelleri were dominant in groups A and B, while G. stelleri and Clupea pallasii were dominant in group C.
Key words: Danish seine fishery, Community structure, Species composition, Demersal fish, East Sea
This is an Open Access article distributed under the terms of the Creative Commons Attribution Non-Commercial Licens (http://creativecommons.org/licenses/by-nc/3.0/) which permits unrestricted non-commercial use, distribution, and reproduction in any medium, provided the original work is properly cited.
http://dx.doi.org/10.5657/KFAS.2015.0529 Korean J Fish Aquat Sci 48(4) 529-541, August 2015 Received 29 April 2015; Revised 18 June 2015; Accepted 8 July 2015
*Corresponding author: Tel: +82. 33. 660. 8524 Fax: +82. 33. 661. 8513
E-mail address: [email protected]
손명호
ㆍ
박정호ㆍ
윤병선ㆍ
최영민ㆍ
김진구530
동해에는약
452
종이출현하여전체의47.7%
가량을차지한다고알려져있으며
,
동해에출현하는어류중에서135
종은동해에만출현하는어종으로알려져있다
(Lee, 2004).
동해는서해나남해에비해수심이깊어심해에서식하는생물들의종조 성이나자원량에대한조사가미비한실정이다
.
최근어업기술 이발달하면서심해에서식하는미기록종이보고되고있지만(Park et al., 2013b, 2014),
동해에는보고되지않은미기록종 들이많은편이다.
본연구에사용된상업어선인동해구외끌이중형저인망은트 롤과유사하지만전개판이없는능동어구를사용하고
,
어선한 척이양측에날개그물이달린자루그물을투망하여저층생물을 그물속에몰아넣는어법으로(NFRDI, 2010b, 2010c),
주요어 획대상종은가자미류,
도루묵,
대구,
벌레문치,
고무꺽정이등 이다(Park et al., 2013a).
동해안에서상업어선을이용한어류군집조사에는크게트 롤
,
자망등의어구를사용하여왔는데,
저서혹은반저서어류를 연구하기에적절한자망조사는포항흥해(Hwang et al., 1997),
영일만(Hong et al., 2008),
왕돌초(Lee et al., 2008),
독도(Lee et al., 2010),
고성아야진과울진후포(Choi et al., 2012),
동 해와양양(Park, 2013)
등많은연구가이루어졌다.
반면본연 구에사용된동해구외끌이중형저인망에관련된연구는어구의 전개성능(Shin et al., 1988)
과투양망조업모니터링(Lee and Byun, 2007)
등어구학과관련된것이고,
이방법을이용한어 류군집조사는보고된바없다.
특정해역의어류군집조사를위해 시험조사선이나상업어선을 이용한조사가이루어지는 데
,
시험조사선은정확한자료를얻을수있는장점이있지만시 공간제약으로인해자료에변동성이크고비용이많이드는단 점이있다.
반면상업어선조사는비상업종폐기,
시기별로어 군이밀집된곳에어장에형성되기때문에정확한어획자료를 얻기는힘들지만,
정확한동정이나어획량기록등의자료수준 만높아진다면시공간제약을받지않는자료를확보할수있고 비용도적게드는장점이있다(Lee et al., 2011).
따라서두가 지조사방법의서로간의단점을보완하기위해시험조사선과 상업어선조사를병행하여자료를비교분석하는것이가장좋 을것으로생각된다.
본연구에서는강원고성에서경북영덕까지의동해중남부 해역에서상업어선인동해구외끌이중형저인망으로채집된저 어류의종조성
,
우점종의변화와군집구조를파악하여효율적 인자원관리방안수립을위한과학적근거자료를제공하는데 목적이있다.
재료 및 방법
본연구는동해를
37°N
을경계로중부해역과남부해역으로구분하여
2011
년부터2013
년까지 동해구외끌이중형저인망어선
(49-76
톤)
을이용하여계절별로2011
년4
회, 2012-2013
년 각각3
회씩총10
회를조사하였다.
동해중부해역은강원고성 에서삼척연안까지,
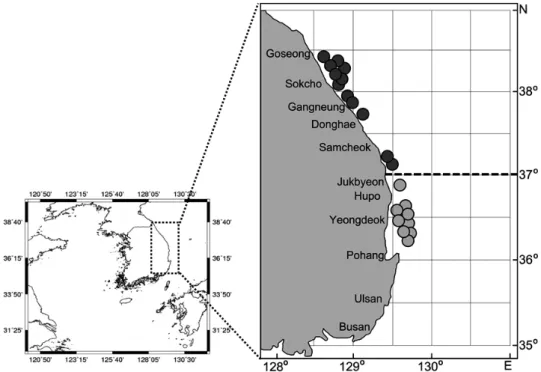
남부해역은죽변에서영덕연안까지시기 별로어장이형성되는곳에서조사를실시하였다(Fig. 1).
Fig. 1. Map showing the stations of Danish seine survey in the East Sea from 2011 to 2013. The dot line denotes the boundary between the middle and the southern areas of the study area.
본연구에사용된어구는날개그물
,
자루그물과어포부로구 성되며길이는뜸줄115-130 m,
발줄120-150 m,
어구90-100
m
이며그물폭은66-85 m
였다.
어구형태는트롤과유사하지만조업방식이달라서투망시부표를띄우고후릿줄과끝줄을마 름모꼴로투하한다음부표를건지고끝줄을어선이끌면서후 릿줄이오므러들면서어군을그물속으로몰아넣는조업방식 이다
.
동해중부해역조사는대륙사면이급경사를이루는
400 m
이 심(
평균수심220 m)
까지,
대륙붕이넓게발달된남부해역에서는평균수심이
130 m
로상대적으로얕은해역에서조사를실시하였다
.
동해구외끌이중형저인망은일반적으로하루에4-5
회투·
양망을하는데,
그중수심과위치를달리해서3
회만채집 하였다.
각투망시1-2
노트의속도로평균60
분을기준으로예 망하였으며,
전체조사수심은60-429 m (
평균174 m)
였고소 해면적은0.085-2.049 km
2(
평균0.195 km
2)
의범위였다.
상업어선의특성상
1
회양망시많을때는갑각류와연체동물 을포함하여1-2
톤까지어획되기때문에어획물중량을바로측 정하기불가능하여,
본조사에서는어획물을동일한박스에넣 어평균무게를측정한후박스의개수를측정하여전체중량 으로환산하였다.
어획물중약60 kg
의정량관찰표본을추 출하였다.
이때개체수가적은어종은전수를조사하였다.
어 획된어류는마리수를계수하였고,
체장은0.1 cm,
중량은1.0 g
단위까지측정하였다.
각정점의마리수와생체량은단위면 적당(km
2)
으로환산하여정량화하였는데,
어획효율(q)
을0.5 (Prado, 1990)
로설정하여소해면적법[
면적당개체수혹은생 체량= N (or B) / SA×q)]
으로추정하였다.
여기서N
은마리 수, B
는생체량, SA (swept area)
는소해면적, q
는어획효율을 각각나타낸다.
또한,
어류군집의생태학적특성을분석하기위 해종수와개체수자료를이용하여종다양도지수(H′, Shannon and Weaver, 1964)
를구하였다.
우리나라의동
·
서·
남해에서출현하는전체해산어류중에서 동해에서만서식하는종을동해종(East Sea species)
이라지칭 하였고,
생활사에따라주거종(resident species)
과회유종(mi- gratory species)
으로구분하였다(Froese and Pauly, 2014).
조사시기와정점별어류군집의유사도분석
(similarity analy-
sis)
은출현종수와정량화된면적당마리수를이용하여 분석하였으며
,
유사도분석시자료간편중을피하기위해네제곱근 변환(fourth root transformation)
을 수행하였고, Bray- Curtis
지수(Bray and Curtis, 1957)
를사용하여정점간유사도를구 하였다.
군집분석을실시할때군집(
그룹)
간의연결방식에는 완전결합법(complete linkage)
을 사용하였고,
그룹간 유사도 를바탕으로수지도(dendrogram)
를작성하고집괴분석(cluster analysis)
을실시하였으며,
집괴분석에는PRIMER (ver. 5.0)
를 사용하였다.
또한각각의조사시기(
정점별)
와분리된그룹간유 사도분포특성을분석하기위해서다원척도분석(MDS, multi- dimensional scaling)
을실시하여2
차원공간에서군집의유사성을파악하였다
.
집괴분석결과분리된그룹사이의생물
·
생태특성차이를비 교하기위해ANOVA test
를실시하였고,
사후검증은Tukey-T test
를이용하였다.
또한동해중부와남부의차이를분석하기 위해paired T-test
를실시하였으며,
모든통계분석에는SPSS (ver. 12.0)
를사용하였다.
결 과
출현종
2011
년부터2013
년까지동해중남부해역에서동해구외끌이중형저인망으로채집된어류는미동정과미기록종을포함하여 총
18
과76
종이었고,
총63
종이출현한중부해역이남부해역의 총54
종보다많았다.
전체어종가운데59
종이동해에만서식하 는동해고유종으로전체의77.6%
를차지하였고,
해역별로나 누어보면중부해역은54
종으로전체의85.7% (
평균89.6%),
남부해역은38
종으로전체의70.4% (
평균69.1%)
를차지하 여중부해역에서동해종이차지하는비율이더높았다(Fig. 2, paired T-test, P=0.006) (Kim and Nam, 2003; Lee, 2004; Park et al., 2013b).
또한회유나생활사에따라주거종과회유종으 로나누어보면,
대부분주거종이었고중부해역과남부해역에 서각각6
종의회유종이출현하였다.
과별로는둑중개과가15
종으로가장많았고,
가자미과10
종,
날개줄고기과9
종,
등가시 치과7
종,
장갱이과7
종순이었다.
Feb.
70 60 50 40 30 20 10 0
100 80 60 40 20
Jun. Aug. 0 2011
All species
No. of species Proportion (%)
East Sea species %
2012 2013
Nov. Mar. Jul. Dec. Apr. Aug. Dec.
Feb.
70 60 50 40 30 20 10 0
100 80 60 40 20
Jun. Sep. 0
2011 2012 2013
Total
Total Nov. Apr. Jul. Dec. Jun. Aug. Dec.
Frequency (No. of inds.)
50-100 100-150 150-200 200-250 250-300 300-350 400-450 100
80 60 40 20 0
A
B
Frequency (No. of inds.)
50-100 100-150
Depth (m)
150-200 100
80 60 40 20 0
Frequency (Biomass)
50-100 100-150 150-200 200-250 250-300 300-350 400-450 100
80 60 40 20 0
A
B
Frequency (Biomass)
50-100 100-150
Depth (m)
150-200 10080 60 40 20 0
B
Frequency (Biomass)
3.00 2.50 2.00 1.50 1.00 0.50 0.00 Feb.
southern East Sea middle East Sea
Jun. Sep.
2011 2012 2013
Nov. Apr. Jul. Dec. Jun. Aug. Dec.
Fig. 2. Variation of number of all and East Sea species by Danish seine survey in the East Sea (A, middle; B, southern).
손명호
ㆍ
박정호ㆍ
윤병선ㆍ
최영민ㆍ
김진구532
종조성의 계절변동
해역별
,
시기별출현어종수를살펴보면,
중부해역에서는평 균29
종이출현하였는데, 2011
년8
월에43
종으로가장많았고2012
년12
월에17
종으로가장적었다.
전체출현종수에대한 동해종의비율은2013
년4
월에91.7%
로가장높았고, 2012
년12
월에76.5%
와2013
년12
월에74.1%
로낮았으며,
나머지시기는동해종비율이
80%
이상으로매우높았으며조사시기별비율차이는적었다
(Table 1, Fig. 2).
동해 남부해역은 평균
20
종,
중부 해역은 평균29
종으로 남부해역에서 출현한 어류의 종수가 적었고(paired T-test, P=0.009),
동해종의비율은2011
년9
월에81.3%, 2012
년7
월 에80.0%
로높았지만, 2012
년12
월에40.0%, 2011
년2
월에50.0%
로낮아시기에따라동해고유종이차지하는비율의차이가많았다
(Table 2, Fig. 2).
우점종의 분포특성
조사기간동안채집된어류중전체개체수및생체량의
2.0%
이상을 차지하는 우점종은 공통적으로 도루묵
(Arctoscopus japonicus),
기름가자미(Glyptocephalus stelleri),
고무꺽정이(Dasycottus setiger),
청자갈치(Allolepis hollandi)
의4
종이었 고,
개체수에서는줄가시횟대(Icelus cataphractus),
청어(Clu- pea pallasii)
가(Fig. 3, 4),
생체량에서는대구횟대,
대구가추가 로우점하여(Fig. 5, 6)
전체개체수및생체량의90.6%, 87.4%
를각각차지하였다
.
단위면적당 개체수
(inds./km
2)
및 생체량(kg/km
2)
의 최우점 종인도루묵은 평균89,448 inds./km
2로, 3,361 kg/km
2로전체의
44.5%, 41.2%
를 차지하였다.
해역별로는 중부해역에서는평균
153,967 inds./km
2, 6,085 kg/km
2,
남부해역에서는24,929 inds./km
2, 638 kg/km
2로대부분중부해역에서출현하 였고,
해역별로큰차이를나타내었다.
중부해역에서는2011
년6
월에337 inds./km
2, 6 kg/km
2로최소였던반면, 2012
년12
월 에는988,310 inds./km
2, 39,975 kg/km
2로최대값을나타내었 다.
남부해역에서는2011
년2
월에211 inds./km
2, 11 kg/km
2로 최소였지만, 2012
년4
월에132,923 inds./km
2, 2,199 kg/km
2로 가장많았다.
기름가자미는
74,458 inds./km
2, 2,207 kg/km
2으로전체개 체수및생체량의37.0%, 27.0%
로차우점하였고,
도루묵과기름가자미개체수및생체량의합이각각전체의
81.5%, 68.2%
를차지하여극우점하였다
.
해역별로는중부해역에서17,260 inds./km
2, 740 kg/km
2,
남부해역에서는131,657 inds./km
2,
3,674 kg/km
2으로남부해역의서식밀도및생체량이더높았다
(p=0.04, P=0.01).
시기별로는중부해역에서2013
년4
월에1,928 inds./km
2, 126 kg/km
2으로가장적은반면, 2012
년7
월 에67,422 inds./km
2, 1,914 kg/km
2으로가장서식밀도가높았 다.
남부해역에서는2012
년7
월에개체수가19,507 inds./km
2 로최소였으나,
생체량은2012
년4
월에1,163 kg/km
2으로가장적었으며
, 2011
년2
월에465,619 inds./km
2, 8,906 kg/km
2으로 가장많은개체수및생체량을나타내었다.
청자갈치는 평균
4,518 inds./km
2, 283 kg/km
2으로전체의2.2%, 3.5%
를각각차지하였고,
중부해역에서는5,442 inds./
km
2, 316 kg/km
2,
남부해역에서는3,592 inds./km
2, 251 kg/
km
2으로해역간차이를보이지않았다(P>0.05).
고무꺽정이는평균
401 kg/km
2으로전체생체량의4.9%
를 차지하였고, 172 kg/km
2인중부해역에비해남부해역이629 kg/km
2으로 더 많았다(P=0.04).
시기별로는중부해역에서는2012
년12
월에4 kg/km
2으로최소였고2011
년6
월에676 kg/
km
2으로최대값을보였다.
남부해역에서는2011
년2
월과2012
년12
월에각각4 kg/km
2, 6 kg/km
2으로최소였고2011
년9
월 과2013
년6
월에각각1,793 kg/km
2, 1,548 kg/km
2으로최대 생체량을나타냈다.
대구횟대
(Gymnocanthus herzensteini)
는평균5,092 inds./
km
2, 707 kg/km
2으로전체의2.5%, 8.7%
를차지하였고, 8,214 inds./km
2, 1,403 kg/km
2인남부해역이중부해역의1,968 inds./
km
2, 11 kg/km
2보다더많이출현하였다(P=0.03).
중부해역에 서는2012
년12
월에148 inds./km
2, 35 kg/km
2로가장높은서 식밀도를보였고,
남부해역에서는2013
년6
월에18,838 inds./
km
2, 8,398 kg/km
2으로가장많이출현하였다.
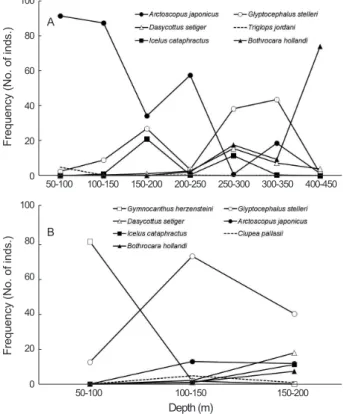
Fig. 3. Abundance of dominant demersal fish species by depth caught Danish seine survey in the East Sea (A, middle; B, south- ern).
Feb.
70 60 50 40 30 20 10 0
100 80 60 40 20
Jun. Aug. 0 2011
All species
No. of species Proportion (%)
East Sea species %
2012 2013
Nov. Mar. Jul. Dec. Apr. Aug. Dec.
Feb.
70 60 50 40 30 20 10 0
100 80 60 40 20
Jun. Sep. 0
2011 2012 2013
Total
Total Nov. Apr. Jul. Dec. Jun. Aug. Dec.
Frequency (No. of inds.)
50-100 100-150 150-200 200-250 250-300 300-350 400-450 100
80 60 40 20 0
A
B
Frequency (No. of inds.)
50-100 100-150
Depth (m)
150-200100 80 60 40 20 0
Frequency (Biomass)
50-100 100-150 150-200 200-250 250-300 300-350 400-450 100
80 60 40 20 0
A
B
Frequency (Biomass)
50-100 100-150
Depth (m)
150-200 100
80 60 40 20 0
B
Frequency (Biomass)
3.00 2.50 2.00 1.50 1.00 0.50 0.00 Feb.
southern East Sea middle East Sea
Jun. Sep.
2011 2012 2013
Nov. Apr. Jul. Dec. Jun. Aug. Dec.
줄가시횟대는평균
4,608 inds./km
2로전체개체수의2.3%
였 고,
중부해역에서는5,228 inds./km
2,
남부해역은3,990 inds./
km
2로해역간차이를보이지않았다(P>0.05).
청어는전체개체수의
2.0%
를차지하였으며,
중부해역보다남부해역에서식밀도가 높았다
.
마지막으로 대구(G. macrocephalus)
는 평균181 kg/km
2으로전체의2.2%
를차지했으며,
중부해역에서는165 kg/km
2,
남부해역에서는196 kg/km
2으로서로차이를보 이지않았다(P>0.05).
군집구조 특성분석
동해중남부해역에서동해구외끌이중형저인망으로조사된 어류군집의특성을파악하기위해종다양도지수
(H´)
를분석한 결과평균1.23
로나타났다(Fig. 7).
해역별로동해중부해역에 서종다양도지수는평균1.29
로2012
년12
월에0.16
으로가장 낮았으며2013
년8
월에2.12
로가장높았다.
남부해역에서는평균
1.16
으로중부와유의한차이를보이지않았고(P>0.05), 2011
년2
월에0.29
로가장낮았고2013
년8
월에1.90
으로가 장높았다.
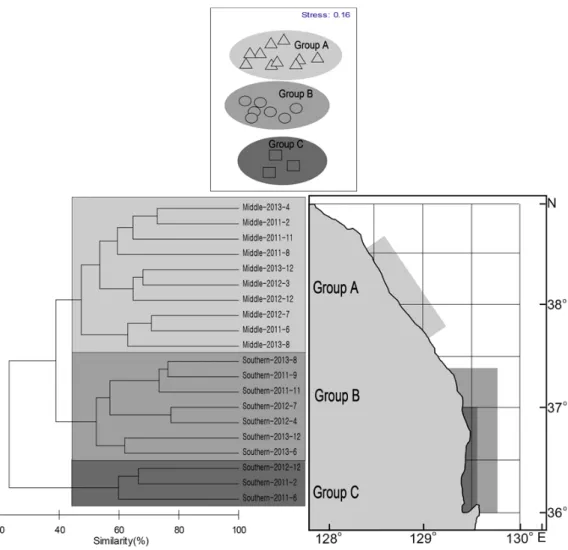
동해구외끌이중형저인망에채집된저어류군집의유사성을 분석한결과크게세그룹으로나누어졌다
.
조사시기에상관없 이동해중부해역에서실시한10
번의조사가그룹A
로구분되 었고,
동해남부해역에서실시한10
번의조사중비교적얕은수 심에서조사한2011
년2
월, 6
월과2012
년12
월이그룹C
로구 분하였으며,
그외깊은수심에서수행된7
번의조사가그룹B
로구분되었다(Fig. 8).
분리된세그룹의개체수및생체량을분석한결과
,
어종수는 그룹A
평균28.8
종,
그룹B
평균21.0
종과그룹C
평균16.0
종으 로그룹A
는B
와C
에비해종수가많았고(P=0.040, P=0.010), B
와C
는서로유의한차이를보이지않았다(P>0.05).
단위면적당개체수
(inds./km
2)
는 그룹A
에서 평균199,866
Fig. 4. Spatial distribution of abundance (inds./km2) of six dominant species caught Danish seine survey in the East Sea (A, Arctoscopus japonicus; B, Glyptocephalus stelleri; C, Gymnocanthus herzensteini; D, Icelus cataphractus; E, Bothrocara hollandi; F, Clupea pallasii).손명호
ㆍ
박정호ㆍ
윤병선ㆍ
최영민ㆍ
김진구534
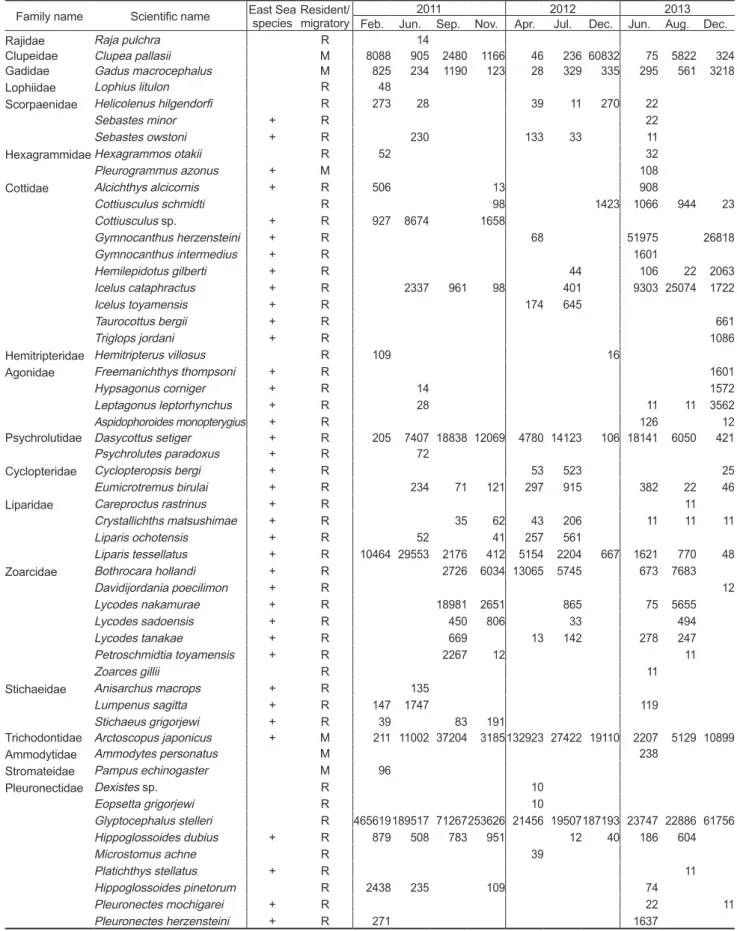
Table 1. Species composition of demersal fishes collected by Danish seine in the middle East Sea from 2011 to 2013 (unit : inds./km2)
Family name Scientific name East Sea
species Resident/
migratory 2011 2012 2013
Feb. Jun. Aug. Nov. Mar. Jul. Dec. Apr. Aug. Dec.
Clupeidae Clupea pallasii M 53 69 32 662 14 18 73
Gadidae Gadus macrocephalus M 86 1178 286 50 362 431 21 2389 236 60
Theragra chalcogramma + M 8 51
Lophiidae Lophius litulon R 63
Scorpaenidae Helicolenus hilgendorfi R 2
Sebastes minor + R 201
Sebastes owstoni + R 432 40 42 825 563 496 28 105
Hexagrammidae Hexagrammos otakii R 12 10 26
Pleurogrammus azonus + M 109 107 106
Cottidae Alcichthys alcicornis + R 2
Cottidae sp.1 + R 13
Cottiusculus schmidti R 5940 1361 1222 454
Cottiusculus sp. + R 63 15
Enophrys diceraus + R 277 1100 273 21
Gymnocanthus herzensteini + R 85 63 71 28 284 14 106
Hemilepidotus gilberti + R 325 134 111 193 755 92 26
Icelus cataphractus + R 6070 74 553 43236 38 1885 421
Icelus ochotensis + R 74 32 14 10
Icelus toyamensis + R 253 26
Myoxocephalus sp. + R 51
Taurocottus bergii + R 13 26 71 51
Triglops jordani + R 103 47953 458 104 936 38 165 621
Triglops scepticus + R 27 265 172
Hemitripteridae Blepsias sp. + R 46
Hemitripterus villosus R 13 233 8 66
Agonidae Agonidae sp. + R 54
Anoplagonus occidentalis + R 15 53
Freemanichthys sp. + R 14
Freemanichthys thompsoni + R 40 218 128 14 862 110 715
Hypsagonus corniger + R 697 34 653 149
Hypsagonus proboscidalis + R 17
Leptagonus leptorhynchus + R 13 1529 84 312 41 520 63 329
Tilesina gibbosa + R 13 187 67 14 193 26 35 13
Psychrolutidae Dasycottus setiger + R 4487 7565 1337 482 1395 1468 148 1396 250 1156
Malacocottus gibber + R 885 58 363 158 9 216
Malacocottus zonurus + R 52
Psychrolutes paradoxus + R 63 8
Cyclopteridae Aptocyclus ventricosus + M 16 88 9
Cyclopteropsis bergi + R 27 8 60
Eumicrotremus birulai + R 1669 348 814 17 2214 180 148 1781 24 147
Liparidae Careproctus rastrinus + R 863 470 26 398 14 111 233 8
Crystallichths matsushimae + R 60 57 246 48 51 11 174 2 13
Liparis agassizii + R 16
Liparis ochotensis + R 181 26 98 74 249 74 303
Liparis tessellatus + R 238 15 147 17 78 14 13 6 26
Zoarcidae Bothrocara hollandi + R 12147 4444 3523 7257 2601 15634 1213 5907 1682 11
Lycodes nakamurae + R 1265 226 501 81 86 127 8
Lycodes sadoensis + R 62 79
Lycodes tanakae + R 514 1729 349 29 946 34 113 37 40
Petroschmidtia toyamensis + R 23 15 96 181 162 4
Stichaeidae Anisarchus macrops + R 13 17
Anisarchus macrops + R 14
Askoldia variegata knipowitschi + R 109 17
Chirolophis snyderi + R 39
Lumpenella longirostris + R 9264 619 972 519 27 1005 1009
Lumpenus sagitta + R 184 21732 128 27
Stichaeus grigorjewi + R 17 17
Trichodontidae Arctoscopus japonicus + M 43656 337 62357 148379 231873 14650 988310 15896 1138 33071
Pleuronectidae Acanthopsetta nadeshnyi + R 155
Glyptocephalus stelleri R 8514 20533 7893 5644 28066 67422 23476 1928 2643 6475
Hippoglossoides dubius + R 285 509 449 392 184 153 11 42 29
Hippoglossoides pinetorum R 311 62 325 117 12 13
Pleuronectes herzensteini + R 40 337
Table 2. Species composition of demersal fishes collected by Danish seine in the southern East Sea from 2011 to 2013 (unit : inds./km2)