INTRODUCTION
The use of transcatheter aortic valve replacement (TAVR) in pa- tients with severe aortic stenosis (AS) who are ineligible for or
are at high risk for surgical aortic valve replacement (sAVR) has increased exponentially since it was first introduced in 2002.1 To date, TAVR has been reported to result in a prompt decrease in left ventricular (LV) afterload2 without the disturbing effects of major surgery and clinical improvement in severe symp- tomatic AS.3-5 Notwithstanding, although the impact of sAVR or TAVR on LV function has been studied using various imag- ing modalities, the effects of TAVR on diastolic function remain controversial,2,6-8 and data are limited on the effect of TAVR on serial changes in LV diastolic function during follow-up imme- diate and early after the procedure. This study aimed to assess and compare the effects of TAVR and sAVR on recovery of LV diastolic function in patients with symptomatic severe AS through serial echocardiographic examinations prior to, im- mediately after, and 3 months after the procedures.
Immediate and Evolutionary Recovery of Left
Ventricular Diastolic Function after Transcatheter Aortic Valve Replacement: Comparison with Surgery
Sang Jin Ha
1, Sang-Yong Yoo
1, Myeong-Ki Hong
2, and Geu-Ru Hong
21Division of Cardiology, Department of Internal Medicine, Gangneung Asan Hospital, University of Ulsan College of Medicine, Gangneung;
2Division of Cardiology, Severance Cardiovascular Hospital, Yonsei University College of Medicine, Seoul, Korea.
Purpose: We aimed to compare the effect of transcatheter aortic valve replacement (TAVR) and surgical aortic valve replacement (sAVR) on recovery of left ventricular (LV) diastolic function and afterload through serial echocardiographic examinations in pa- tients with symptomatic high-risk severe aortic stenosis during early follow-up.
Materials and Methods: We included 38 patients undergoing TAVR (mean age, 80±6 years; male:female=18:20) and 27 patients undergoing sAVR (mean age, 78±3 years; male:female=12:15). We compared changes in the LV diastolic function and afterload before, immediately after, and 3 months after the procedure using serial transthoracic echocardiography.
Results: Immediately after the procedure, 16 (42%) and 3 (11%) patients in the TAVR and sAVR groups, respectively, showed rapid improvement in diastolic filling patterns. E wave to e' ratio (E/e') and right ventricular systolic pressure (RVSP) decreased signifi- cantly in the TAVR group (E/e': TAVR, from 24.6±12.9 to 20±9.5, p=0.048 vs. sAVR, from 21.5±9.4 to 20.64±6.4, p=0.361; RVSP: TAVR, 38.4±17.2 vs. 34±12.4, p=0.032 vs. sAVR, 32.2±11.7 vs. 30±6.8, p=0.27). After 3 months, diastolic grade distribution, E/e', and RVSP were similar. Valvuloarterial impedance significantly decreased immediately after the procedure in both groups (TAVR, from 5.1±1.4 to 3.1±1.0 vs. sAVR, from 4.5±1.5 to 3.1±0.8 mm Hg . mL−1 . m−2, p=0.001), but after 3 months, decreases were greater in the sAVR group (from 3.1±0.8 to 2.2±1.5 mm Hg . mL−1 . m−2, p=0.093).
Conclusion: LV diastolic function improved more rapidly and earlier in patients treatment with TAVR than in patients treated with sAVR. These results might explicate the remarkable clinical improvement in improvements in advanced diastolic dysfunction im- mediately after the TAVR procedure than sAVR.
Key Words: Transcatheter aortic valve replacement, aortic valve stenosis, diastolic function
pISSN: 0513-5796 · eISSN: 1976-2437
Received: July 12, 2019 Revised: November 23, 2019 Accepted: December 2, 2019
Corresponding author: Geu-Ru Hong, MD, PhD, Division of Cardiology, Severance Cardiovascular Hospital, Yonsei University College of Medicine, 50-1 Yonsei-ro, Seodaemun-gu, Seoul 03722, Korea.
Tel: 82-2-2228-8443, Fax: 82-2-393-2041, E-mail: [email protected]
•The authors have no potential conflicts of interest to disclose.
© Copyright: Yonsei University College of Medicine 2020
This is an Open Access article distributed under the terms of the Creative Com- mons Attribution Non-Commercial License (https://creativecommons.org/licenses/
by-nc/4.0) which permits unrestricted non-commercial use, distribution, and repro- duction in any medium, provided the original work is properly cited.
Yonsei Med J 2020 Jan;61(1):30-39 https://doi.org/10.3349/ymj.2020.61.1.30
MATERIALS AND METHODS
Study population
We consecutively enrolled 38 patients with symptomatic se- vere AS who underwent transfemoral TAVR between 2011 and 2013 at our institute (TAVR group). We also enrolled 27 patients who were older than 75 years and underwent sAVR during the same period. The TAVR group consisted of patients treated with TAVR if their aortic valve area was <1 cm2, their European Sys- tem for Cardiac Operative Risk Evaluation score (EuroSCORE) was >20%, or their EuroSCORE was ≤20% and the following criteria were met: contraindicated for surgery, severely reduced pulmonary function (defined as forced expiratory volume in 1 second <1 L), liver cirrhosis (Child A or B), and severe pulmo- nary hypertension (pulmonary systolic pressure > 60 mm Hg).
Exclusion criteria included: known contraindications to anti- platelet agents or anticoagulant therapy, allergic reaction to nitinol or contrast media that could not be premedicated, any sepsis, history of AVR, any condition considered a contraindi- cation to extracorporeal assistance, symptomatic carotid or vertebral artery disease (>70% stenosis), abdominal aortic an- eurysm, bleeding diathesis or coagulopathy, creatinine clear- ance <20 mL/min, and life expectancy <1 year. Patients with significant coronary artery disease were completely revascu- larized by percutaneous coronary intervention before TAVR.
All 38 patients in the TAVR group and 27 patients in the sAVR group exhibited New York Heart Association (NYHA) func- tional class ≥II symptoms, and their echocardiographic find- ings were consistent with severe AS (aortic valve area <1 cm2 with or without a transvalvular mean pressure gradient ≥40 mm Hg).9 The decision for TAVR or sAVR was made for each patient based on clinical symptom severity combined with co- morbid disease, physical performance status, and echocar- diography parameters. The patients were selected for TAVR af- ter they were considered inoperable or at high risk as assessed by a multispecialty team.
TAVR was executed with fluoroscopy and transesophageal echocardiography guidance under general anesthesia using standard techniques.10 Pre-procedural echocardiography and multi-slice computed tomography were used to measure aor- tic annulus size. Immediately after prosthetic valve deploy- ment, transesophageal echocardiography was performed to confirm good motion of the prosthetic valve and identify any paravalvular leakage.
Echocardiographic and doppler measurements
All patients were investigated using two-dimensional trans- thoracic echocardiography (TTE) before the procedure (TAVR or sAVR), immediately after the procedure, and 3 months after the procedure. In the TAVR group, TTE follow-up was per- formed 1 day after the procedure. The short-term effects of sAVR were evaluated using echocardiography 5–7 days after the procedure.Standard two-dimensional pulsed-wave Doppler and pulsed- wave Doppler tissue imaging (DTI) echocardiographic param- eters were collected from parasternal and apical acoustic win- dows based on American Society of Echocardiography (ASE) guidelines11 using an IE33 (Phillips, Andover, MA, USA) or viv- id E9 (Vinmed; General Electric, Milwaukee, WI, USA). All pa- tients were investigated in the left lateral supine position under electrocardiographic monitoring.
M-mode tracing obtained just below the mitral valve leaflets was acquired in the parasternal short-axis view. We measured LV end-diastolic (LVED) and end-systolic (LVES) dimensions, such as interventricular septal wall thickness, posterior wall thickness, and LVED and LVES diameters.12 LVED and LVES volumes were acquired from apical two- and four-chamber views using the biplane modified Simpson’s rule, while LV ejection fraction (EF) was calculated according to ASE recom- mendations.12 LA volume indices (LAVI) were also measured using the biplane Simpson’s method. LV mass was calculated using the Devereux formula and indexed to body surface area calculated using the Mosteller formula. Relative wall thickness (RWT) was calculated as 2×LV diastolic posterior wall thick- ness/LVED diameter and was regarded as abnormal when
>0.42. Relative wall thickness and LV mass index (LVMI) were applied to evaluate LV geometry.
Continuous-wave Doppler examinations were evaluated for peak instantaneous velocity. The mean and maximum aortic valve pressure gradients were assessed for all patients using the modified Bernoulli equation with flow velocity-time inte- grals over the ejection period in continuous-wave Doppler re- cordings with a 100 mm/s time scale. Aortic valve area was calculated using the continuity equation following ASE rec- ommendations.13 Aortic and mitral regurgitation were evalu- ated based on ASE recommendations.14
LV filling variables were achieved from pulsed-wave Dop- pler recordings of transmitral flow velocity. The sample vol- ume was allocated at the tips of the mitral valve leaflets. Dop- pler velocity recordings of three cardiac cycles at a paper speed of 100 mm/s were digitized, and the variables were averaged.
LV diastolic function was evaluated using pulsed-wave Dop- pler and pulsed-wave DTI recordings based on ASE/European Association of Cardiovascular Imaging recommendations.15 Transmitral flow was attained to gather peak early (E) and atri- al (A) flow velocities. We used the mean peak early diastolic (e') velocity obtained from the septal side of the mitral annulus in the four-chamber view with appropriate DTI settings. Systolic (s') and late diastolic velocity (a') and isovolumic relaxation time were computed utilizing pulsed-wave DTI at the septal insertion sites of the mitral leaflets in the apical four-chamber view. The E wave to e’ ratio (E/e') was calculated to determine LV filling pressures. Tricuspid regurgitation pressure gradient was measured on color-flow Doppler imaging using paraster- nal RV inflow view.
Accordingly, diastolic function was determined based on the
2016 recommendations.15 Diastolic function was then classified into grade I, grade II, grade III, and indeterminate/normal grade considering early-late ventricular filling velocities (E/A) ratio, E/e' ratio, tricuspid regurgitation velocity, and LAVI. In patients with indeterminate grade diastolic dysfunction and depressed LV ejection fraction (LVEF), the systolic/diastolic pulmonary venous flow velocity ratio was utilized.
Arterial hemodynamics and global LV afterload
Systolic and diastolic blood pressure was estimated utilizing an arm-cuff sphygmomanometer at the time of the Doppler echocardiography examination. To assess the elastic proper- ties of the ascending aorta, the systolic and diastolic aortic di- ameters were evaluated 1 cm above the sinotubular junction by two-dimensionally guided M-mode transthoracic echocar- diography in the parasternal long-axis view.16 The ratio of stroke volume index to brachial pulse pressure (the difference between systolic and diastolic blood pressure) was utilized as an indirect measure of total systemic arterial compliance (SAC).17 Sys- temic vascular resistance (SVR) was determined by the follow- ing formula: (80×MAP)/CO, where MAP is the mean arterial pressure and CO is the cardiac output.17 To assess global LV af- terload, valvuloarterial impedance (Zva) was computed as the sum of the systolic arterial pressure and the mean transvalvu- lar pressure gradient divided by the stroke volume index.18Statistical analysis
Continuous variables are expressed as means±standard devi- ations, while categorical variables are expressed as frequencies and percentages. Statistics were calculated using SPSS version 19.0 (IBM Corp., Armonk, NY, USA). Intergroup comparisons were undertaken utilizing a two-tailed Student’s t test or Welch test and non-parametric methods depending on the data dis- tribution. Categorical variables were compared utilizing Fisher’s exact test. Since diastolic function grade was an ordinal variable, comparisons involving this variable utilized the exact Jonck- heere-Terpstra test. We performed a repeated-measured anal- ysis of variance to determine differences between groups and over time. p values <0.05 were considered statistically significant.
RESULTS
Baseline clinical characteristics and echocardiography findings
The baseline patient characteristics are presented in Table 1.
We included 38 patients who underwent TAVR (TAVR group:
mean age, 80±6 years, male:female=18:20) and 27 patients who were older than 75 years and underwent sAVR during the same period (sAVR group: mean age, 78±3 years, male:female
=12:15). A CoreValve (Medtronic CoreValve Percutaneous Sys- tem; Medtronic Inc., Minneapolis, MN, USA) was inserted in all patients in the TAVR group. As expected, the Society of Thorac-
ic Surgeons risk score (8.7±4.2 vs. 5.8±4.3, p=0.028) and logis- tic EuroSCORE (25.8±16.9 vs. 13.8±13.0, p=0.011) in the TAVR group were higher than those in the sAVR group. Furthermore, patients in the TAVR group had a lower mean body mass in- dex (TAVR, 21.1±3.3 vs. 23.9±3.3 kg/m2, p=0.002). There were trends toward more patients with chronic lung disease (40% vs.
30%, p=0.290) and chronic kidney disease (estimated glomer- ular filtration rate <60 mL/min/m2) in the TAVR group than in the sAVR group (47% vs. 33%, p=0.179) (Table 1). At baseline ex- amination, the TAVR group consisted of 33 (87%) patients in sinus rhythm and 5 (13%) with atrial fibrillation (AF), whereas the sAVR group had 21 (79%) patients in sinus rhythm and 6 (21%) with AF. The baseline echocardiographic findings are presented in Table 2. No significant intergroup differences were found in chamber size, geometry, and function, except for lower aortic valve area index, in the TAVR group (0.65±0.17 vs. 0.77±0.22 cm2/m2, p=0.017).
In the sAVR group, all patients received a bioprosthesis (Car- pentier Edwards Bioprosthesis in 13; Carpentier Edwards Peri- mount Magna Bioprosthesis in 2; and Saint Jude epic Biopros- thesis in 12). All surgical patients had a favorable postoperative state without any serious 30-day complications.
Hemodynamic improvement after TAVR and sAVR
Early hemodynamic improvement was comparable between Table 1. Baseline Characteristics of the TAVR and sAVR GroupsTAVR group
(n=38) sAVR group
(n=27) p value Clinical variables
Age (yr) 80±6 78±3 0.436
Men 18 (47) 12 (44) 0.612
Body mass index (kg/m2) 21.1±3.3 23.9±3.3 0.002*
NYHA class III or IV 29 (76) 22 (81) 0.548
Diabetes mellitus 13 (39) 8 (30) 0.320
Hypertension 24 (73) 16 (60) 0.551
Coronary heart disease 20 (52) 12(44) 0.511
Previous MI 5 (13) 1 (4) 0.163
Old CVA 6 (16) 2 (7) 0.220
Previous cardiac surgery 3 (8) 1 (4) 0.401
Previous AF Hx 5 (13) 6(19) 0.332
Chronic lung disease 15 (40) 8 (30) 0.290
CKD (eGFR<60 mL/min/m2) 18 (47) 9 (33) 0.179 Predicted operative mortality
STS score (%) 8.7±4.2 5.8±4.3 0.028*
Logistic EuroSCORE (%) 25.8±16.9 13.8±13.0 0.011*
TAVR, transcatheter aortic valve replacement; sAVR, surgical aortic valve re- placement; STS, Society of Thoracic Surgeons; CVA, cerebrovascular accident;
MI, myocardial infarction; PCI, percutaneous coronary intervention; OP, oper- ation; Hx, history; AF, atrial fibrillation; CKD, chronic kidney disease; NYHA, New York Heart Association; eGFR, estimated glomerular filtration rate; EuroSCORE, European System for Cardiac Operative Risk Evaluation score.
Data are presented as means±standard deviations or n (%).
*p<0.05.
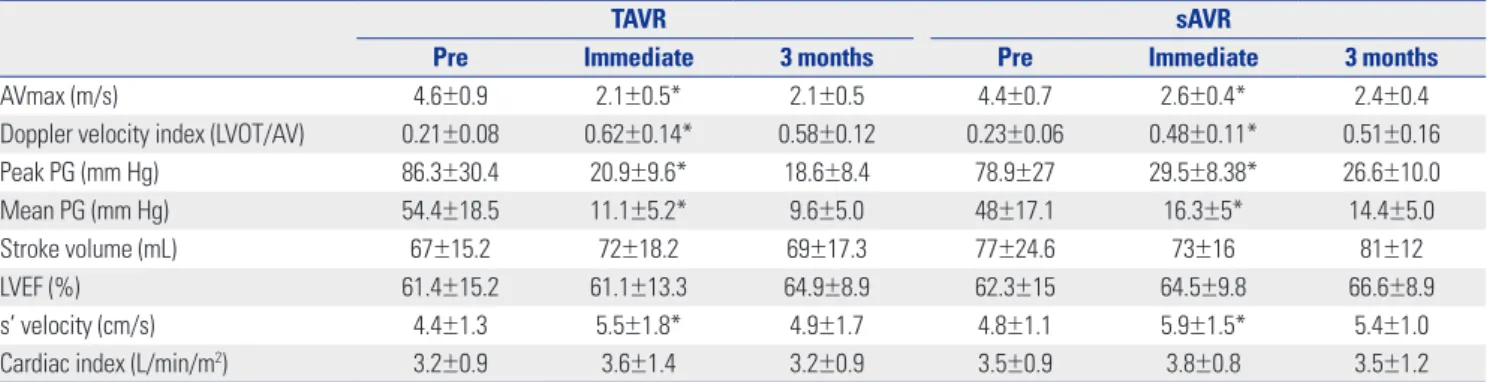
the groups: peak AV velocity (AVmax: TAVR, from 4.6±0.9 to 2.1±
0.5 vs. sAVR, from 4.4±0.7 to 2.6±0.4 m/s, p<0.001) (Table 3, Fig.
1A) and mean systolic pressure gradient (MSPG: TAVR, from 54.4±18.5 to 11.1±5.2 vs. sAVR, from 48±17.1 to 16.3±5 mm Hg, p<0.001) (Table 3, Fig. 1B). Moreover, these improve- ments were maintained after 3 months without significant changes (Table 3, Fig. 1A). In addition, LVEF, SV, and cardiac index tended to increase in both groups over time after 3 months (LVEF: TAVR, from 61.4±15.2% to 64.9±8.9% vs. sAVR, from 62.3±15% to 66.6±8.9%; SV: TAVR, from 67±15.2 to 69± 17.3 vs.
sAVR, from 77±24.6 to 81±12 mL; cardiac index: TAVR, from 3.2±0.9 to 3.2±0.9 vs. sAVR, from 3.5±0.9 to 3.5±1.2 L/min/m2, p=NS) (Table 3). In addition, we noted significant improve- ments in s' velocity immediately after and 3 months after the
procedure in both groups (TAVR, from 4.4± 1.3 to 5.5±1.8 vs.
sAVR, from 4.8±1.1 to 5.9±1.5 cm/s, p=0.001) (Table 3).
Comparison of recovery of diastolic function after TAVR and sAVR during serial follow up
Immediately after AVR, 16 patients (42%) showed improve- ment in LV diastolic function grade in the TAVR group versus only 3 patients (11%) in the sAVR group. Early improvement in diastolic function grade was seen immediately after TAVR (p=
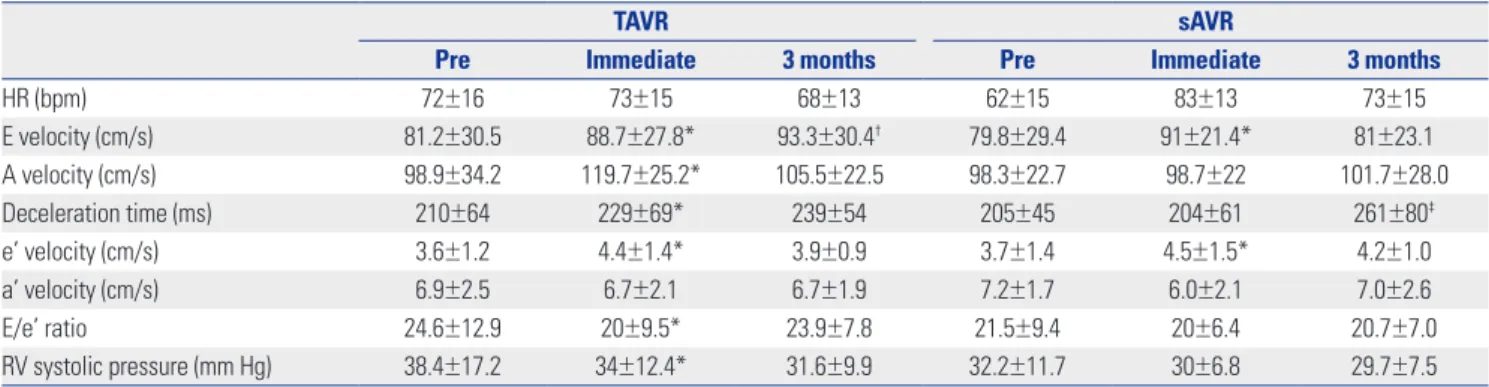
0.018) (Fig. 2), but no further improvement was found after 3 months. However, a small improvement was found immedi- ately after sAVR (p=0.04) (Fig. 2), although no further improve- ment was noted 3 months later (p=0.99) (Fig. 2). E velocity (from 81.2±30.5 to 88.7±27.8 vs. from 79.8±29.4 to 91±21.4 cm/s, p=
0.048) and e' velocity (from 3.6±1.2 to 4.4±1.4 vs. from 3.7±1.4 to 4.5±1.5 cm/s, p=0.048) (Table 4, Fig. 3A and B) were signifi- cantly increased in the TAVR group versus the sAVR group.
Deceleration time (DT) increased significantly immediately after TAVR (from 210±64 to 229±69 ms, p=0.008) (Table 4), but only at 3 months after sAVR (204±61 vs. 261±80 ms, p=0.033) (Table 4). Unlike the sAVR group (from 21.5±9.4 to 20±6.4, p=0.361), E/e' ratio decreased significantly in the TAVR group immediately after the procedure (from 24.6±12.9 to 20 ±9.5, p=0.048) (Table 4, Fig. 3C). Moreover, immediately after the procedure, a significant decrease was found in right ventricu- lar systolic pressure in the TAVR group, compared with the sAVR group (TAVR, 38.4±17.2 vs. 34±12.4, p=0.032 vs. sAVR, 32.2±
11.7 vs. 30±6.8 mm Hg, p=0.27) (Table 4, Fig. 3D).
Changes in global LV afterload after TAVR and sAVR
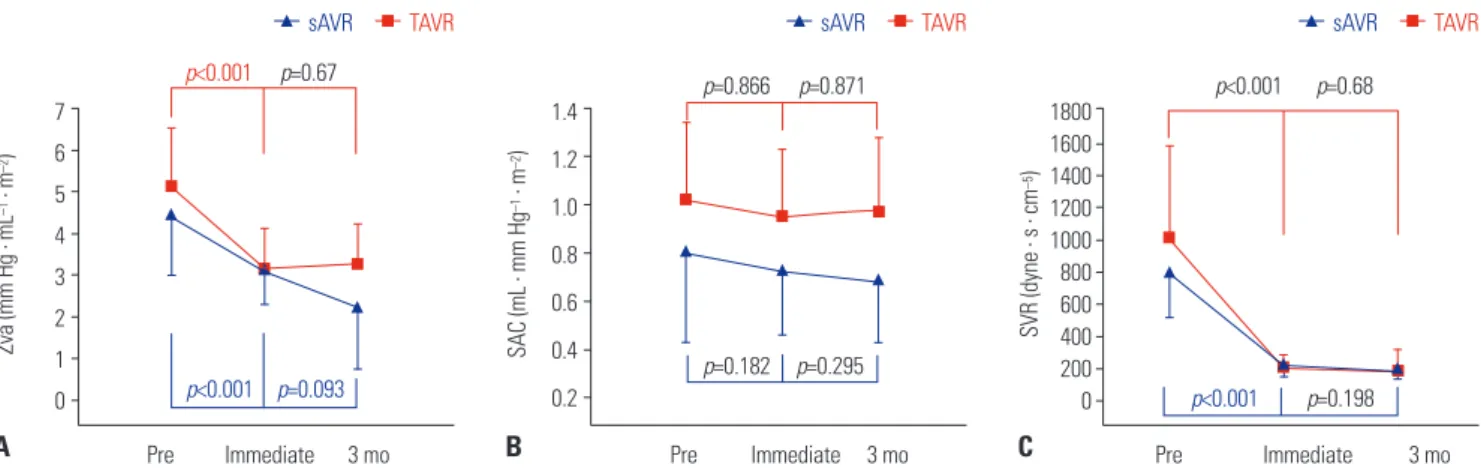
Valvuloarterial impedance (Zva) was significantly decreased immediate after the procedure in both groups (from 5.1±1.4 to 3.1±1.0 vs. from 4.5±1.5 to 3.1±0.8 mm Hg . mL−1 . m−2, p<0.001) (Fig. 4A) but a further decrease was observed only in the sAVR group (from 3.1±0.8 to 2.2±1.5 mm Hg . mL−1 . m−2, p=0.093) (Fig. 4A). In addition, SVR was significantly de- creased immediately after the procedure (from 1044±628 to 198±100 vs. from 747±270 to 214±76 dyne . s . cm−5, p=0.001) (Fig.
4C), although no further decrease was noted 3 months later in either group. Although the SAC of TVAR was greater than that of sAVR at baseline (1.06±0.27 vs. 0.76±0.37 mL . mm Hg−1 . m−2, p=0.02) (Fig. 4B), there was no change in SAC immedi- ately after the procedure or 3 months later in either group (from 0.76±0.37 to 0.7±0.29 vs. from 1.06±0.27 to 0.94±0.29 mL . mm Hg−1 . m−2, p=0.295) (Fig. 4B).
LA and LV structural changes after TAVR and sAVR
In both groups, LV chamber size, including LV end-diastolic diameter (LVEDD), LV end-systolic diameter (LVESD), and the thicknesses of the septum and posterior wall, did not change significantly over time, except for LVEDD and LVESD at 3 months after sAVR (LVEDD, from 49±7.8 to 45.4±4.5 mm;LVESD, from 33 ±8 to 30±4.9 mm, p<0.05, respectively) (Table Table 2. Baseline Echocardiographic Findings of the TAVR and sAVR
Groups
TAVR group
(n=38) sAVR group (n=27) p value
AVAI (cm2/m2) 0.65±0.17 0.77±0.22 0.017*
Doppler velocity index (LVOT/AV) 0.21±0.08 0.23±0.06 0.549
Peak PG (mm Hg) 86.3±30.4 78.9±27 0.294
Mean PG (mm Hg) 54.4±18.5 48±17.1 0.164
Stroke volume (mL) 67±15.2 77±24.6 0.051
LVEF (%) 61.4±15.2 62.3±15 0.806
Cardiac index (L/min/m2) 3.2±0.9 3.5±0.9 0.288
E velocity (cm/s) 83.4±37.1 79.8±29.4 0.682
A velocity (cm/s) 98.9±34.2 98.3±22.7 0.941
Deceleration time (ms) 210±64 205±45 0.584
e’ velocity (cm/s) 3.6±1.2 3.7±1.4 0.152
a’ velocity (cm/s) 6.9±2.5 7.2±1.7 0.724
s’ velocity (cm/s) 4.4±1.3 4.8±1.1 0.216
E/e’ ratio 24.6±12.9 21.5±9.4 0.307
RVSP (mm Hg) 39.8±16.2 34.5±12.4 0.162
HR (bpm) 72±16 73±19 0.825
SBP (mm Hg) 126±23 120±18 0.051
DBP (mm Hg) 68±11 68±11 0.872
LAVI (mL/m2) 43.3±16.7 51.1±22 0.128
LVEDD (mm) 48.7±7.7 49±7.8 0.972
LVESD (mm) 33.5±9.3 33±8 0.889
IVST (mm) 12.7±2.8 12±1.5 0.181
LVPWT (mm) 11.8±2.0 11.8±2.2 0.749
RWT 0.46±0.1 0.49±0.1 0.826
LVMI (g/m2) 159±48 146±40 0.259
TAVR, transcatheter aortic valve replacement; sAVR, surgical aortic valve re- placement; LVOT, left ventricular outflow tract; AVAI, aortic valve area index;
PG, pressure gradient; LVEF, left ventricular ejection fraction; E/e’, E wave to e’ ratio; RVSP, right ventricular systolic pressure; HR, heart rate; SBP, systolic blood pressure; DBP, diastolic blood pressure; LAVI, left ventricular volume in- dex; LVEDD, left ventricular end-diastolic diameter; LVESD, left ventricular end-systolic diameter; IVST, interventricular septal thickness; LVPWT, left ven- tricular posterior wall thickness; RWT, relative wall thickness; LVMI, left ven- tricular mass index.
Data are presented as means±standard deviations.
*p<0.05.
5). LV mass and LVMI were unchanged immediately after the procedures. Meanwhile, however, LVMI decreased significant- ly and RWT tended to be lower 3 months after the procedures (LVMI: TAVR, from 159±48 to 148±48 vs. sAVR, from 146±41 to 125±29 g/m2; RWT: TAVR, from 0.49±0.13 to 0.48±0.1 vs. sAVR, from 0.49±0.1 to 0.48±0.1, p=0.001 vs. p=NS) (Table 5). LAVI significantly changed only immediately after sAVR (from 51.1±22 to 45.9± 17.4 mL/m2, p=0.015) (Table 5).
Clinical outcomes
All sAVR and TAVR patients had a favorable postoperative course without any 30-day mortality. During the 3-year fol- low-up period, 5 patients (13%) died in the TAVR group versus 3 patients (11%) in the sAVR group (p=0.186). Stroke occurred in 3 patients (11%) in the sAVR versus no patients in the TAVR group (p=0.081). Major bleeding events developed in 5 pa- tients (13%) in the TAVR group and 4 patients (15%) in the sAVR
group (p=0.628). Complete atrioventricular block requiring permanent pacemaker insertion developed in 5 patients (13%) in the TAVR group and 2 (7%) in the sAVR group (p=0.341).
There were 3 pericardial effusions (8%) in the TAVR group and 1 episode of ventricular tachycardia requiring defibrillation in the sAVR group. There was a significant intergroup difference in the prevalence of clinically related pleural effusion (80% in the sAVR group vs. 29% in the TAVI group, p<0.001) immedi- ately after the procedure. Post-procedurally, aortic regurgita- tion was observed in 26 patients (68%) in the TAVR group only, the degrees of which were all less than moderate.
DISCUSSION
This study demonstrates the possible contrasting effects of TAVR and sAVR on diastolic function over time, especially those im- Table 3. Hemodynamic Improvement after TAVR and sAVR
TAVR sAVR
Pre Immediate 3 months Pre Immediate 3 months
AVmax (m/s) 4.6±0.9 2.1±0.5* 2.1±0.5 4.4±0.7 2.6±0.4* 2.4±0.4
Doppler velocity index (LVOT/AV) 0.21±0.08 0.62±0.14* 0.58±0.12 0.23±0.06 0.48±0.11* 0.51±0.16
Peak PG (mm Hg) 86.3±30.4 20.9±9.6* 18.6±8.4 78.9±27 29.5±8.38* 26.6±10.0
Mean PG (mm Hg) 54.4±18.5 11.1±5.2* 9.6±5.0 48±17.1 16.3±5* 14.4±5.0
Stroke volume (mL) 67±15.2 72±18.2 69±17.3 77±24.6 73±16 81±12
LVEF (%) 61.4±15.2 61.1±13.3 64.9±8.9 62.3±15 64.5±9.8 66.6±8.9
s’ velocity (cm/s) 4.4±1.3 5.5±1.8* 4.9±1.7 4.8±1.1 5.9±1.5* 5.4±1.0
Cardiac index (L/min/m2) 3.2±0.9 3.6±1.4 3.2±0.9 3.5±0.9 3.8±0.8 3.5±1.2
TAVR, transcatheter aortic valve replacement; sAVR, surgical aortic valve replacement; LVOT, left ventricular outflow tract; AVmax, peak aortic valve velocity; PG, pressure gradient; LVEF, left ventricular ejection fraction.
Data are presented as means±standard deviations.
*Effect between pre-procedure and immediate procedure: p<0.05
6 5 4 3 2 1 0
AVmax (m/s)
p<0.001
p<0.001
p=0.54
p=0.53
Pre Immediate 3 mo
sAVR TAVR
A
80 70 60 50 40 30 20 10 0
MSPG (mm Hg)
p<0.001
p<0.001
p=0.22
p=0.53
Pre Immediate 3 mo
sAVR TAVR
B
Fig. 1. Hemodynamic changes over time. (A) Serial change of aortic valve peak velocity. (B) Serial change of MSPG across the aortic valve. Error bars rep- resent standard deviations, while the error bar of the left ventricular mass index represents the standard error. TAVR: transcatheter aortic valve replace- ment; sAVR: surgical aortic valve replacement; AVmax: peak AV velocity; MSPG: mean systolic pressure gradients; Pre: before the procedure; mo: months.
mediately after the procedure and 3 months later in cases of high-risk AS. We found more significant and earlier improve- ment in diastolic function in the TAVR group versus the sAVR group. We noticed that this improvement was achieved through a marked decreased in PG across AV and led to an increase in E and e' velocity, elongation of DT, and a decrease in E/e' ra- tio in the TAVR, compared the sAVR group. In result, there was an early and rapid recovery of diastolic grade distribution im- mediately after the procedure in the TAVR group.
The major hemodynamic feature of AS is LV pressure over- load. As a result of increased afterload and LV remodeling,19,20 AS leads to LV diastolic dysfunction, increased filling pres- sures, and heart failure symptoms. Diastolic dysfunction occurs even in the early disease course, followed by an increase in LV mass.21 As observed in other previous studies, after TAVR, our patients showed significant increases in effective orifice area with marked reductions in transvalvular pressure gradients equivalent to a reduction in LV afterload.2 Accordingly, E and e' reflecting early diastolic relaxation increased significantly and immediately after TAVR. These results are consistent with previously published data from Gonçalves, et al.2 and Guarrac- ino, et al.,22 who calculated parameters of LV relaxation within minutes after TAVR. In our patients, DT also increased, suggest-
ing that LV chamber compliance improved immediately after TAVR due to a reduction in LV afterload. All of our patients ex- hibited LV diastolic dysfunction before valve implantation, with grade II being the most prevalent (47.3%). Utilizing an integra- tive approach focusing on e', E/A ratio, DT, and E/e' ratio, al- most half of the patients (42%) in the TAVR group improved by at least one grade, compared with 11% in the sAVR group. This is because E wave velocity and DT increased which might be the consequence of increased relaxation and improved LV compliance due to almost complete normalization of the af- terload. Interestingly, these effects were more prominent im- mediately after TAVR than sAVR, and the differences therein may be explained by a higher-pressure gradient across AV and more marked reduction in PG versus sAVR. E/e' ratio, which is a parameter for the evaluation of LV filling pressure,23 slightly, but significantly, improved immediately after the procedure in only the TAVR group. The change in LA volume did not change, which supported the chronicity of diastolic dysfunction, and the procedure had no effect on LA volume in the TAVR group.
In addition, change in LA size reflected the chronicity index for a long-term change. Our study population consisted of rela- tively acute-phase patients (up to 3 months). Therefore, although LA size was one of the parameters of diastolic function, it did not change during the study period, although because our study had a small sample size and had a retrospective design, selection bias might have occurred. Notwithstanding, the acute recovery in diastolic function parameters found in our study is in accord with that seen in a previous study,2 although the previous study measured function parameters during the pro- cedure and did not compare them with a surgical group. Our study aimed to compare the effects of TAVR and sAVR imme- diately after the procedure and 3 months later based on trans- thoracic echocardiography findings in order to reflect the real- world situation of changes immediately after the procedure and the outpatient situation.
Although sAVR is the conventional and reference treatment in patients with symptomatic AS and clinical improvement is Grade 3
Pre Immediate Pre TAVR
3
3 5
5 10
14 16
3 1
9
7 7
8 9 11 7 11 6
18
22 20
sAVR
Immediate
3 months 3 months
Grade 2 Grade 1
Indeterminate/normal
Fig. 2. Distribution of severity of diastolic function changes in TAVR and sAVR groups over time. Comparison between TAVR and sAVR at immedi- ately after the procedure, p=0.018. Comparison between TAVR and sAVR at 3 months later, p=0.88. TAVR, transcatheter aortic valve replacement;
sAVR, surgical aortic valve replacement; Pre, before the procedure.
Table 4. Changes in Diastolic Function over Time
TAVR sAVR
Pre Immediate 3 months Pre Immediate 3 months
HR (bpm) 72±16 73±15 68±13 62±15 83±13 73±15
E velocity (cm/s) 81.2±30.5 88.7±27.8* 93.3±30.4† 79.8±29.4 91±21.4* 81±23.1
A velocity (cm/s) 98.9±34.2 119.7±25.2* 105.5±22.5 98.3±22.7 98.7±22 101.7±28.0
Deceleration time (ms) 210±64 229±69* 239±54 205±45 204±61 261±80‡
e’ velocity (cm/s) 3.6±1.2 4.4±1.4* 3.9±0.9 3.7±1.4 4.5±1.5* 4.2±1.0
a’ velocity (cm/s) 6.9±2.5 6.7±2.1 6.7±1.9 7.2±1.7 6.0±2.1 7.0±2.6
E/e’ ratio 24.6±12.9 20±9.5* 23.9±7.8 21.5±9.4 20±6.4 20.7±7.0
RV systolic pressure (mm Hg) 38.4±17.2 34±12.4* 31.6±9.9 32.2±11.7 30±6.8 29.7±7.5
TAVR, transcatheter aortic valve replacement; sAVR, surgical aortic valve replacement; HR, heart rate; E/e’, E wave to e’ ratio; RV, right ventricle.
Data are presented as means±standard deviations.
*Effect between pre-procedure and immediately after procedure: p<0.05, †Effect between immediate procedure and after 3 months: p<0.05, ‡Significant difference only after 3 months: p<0.05
expected in patients undergoing sAVR, diastolic stiffness along with relaxation normalization are recognized in late follow- up.24 In our study, immediately after sAVR, patients also showed improvements in E and e' velocity, but no increase in DT and no decrease in E/e' ratio. These effects reflected the change in diastolic function grade immediately after the procedure. As a result, only 11% of the sAVR patients improved by at least one grade compared with TAVR (47%). The mean heart rate was faster in the sAVR group than in the TAVR group (83±13 vs. 73±
15 bpm, p=0.003), and pleural effusion and pulmonary edema were more prevalent. After 3 months, the diastolic function dis- tribution in the sAVR group was comparable to that in the TAVR group. A previous study showed that while TAVR did not influ- ence RV function, it worsened in patients undergoing sAVR.25 RSVP did not deteriorate in our sAVR patients, although this does not indicate a lack of RV function deterioration, because we did not measure RV function, such as fractional area change and tricuspid annular plane systolic excursion. In sum, favor- able effects on LV diastolic function could play a major part in
reducing postoperative complications, such as pulmonary in- sufficiency, continued mechanical ventilation, renal insuffi- ciency, myocardial dysfunction with demand for inotropes, and lengthened hospitalization, thus positively influencing the reported favorable short-term morbidity and mortality rates of surgery.26 In contrast, for patients allocated to sAVR, limited as- sumptions can be made. The normalization of LV diastolic function24 and improvements in ejection fraction, volumes, and hypertrophy have been observed in long-term follow-up,27 whereas short-term results appear to be limited by the effects of extracorporeal circulation, positive inotropic drug adminis- tration, and the existence of paradoxical septum.
Immediately after valve replacement, no significant interval change was found in RWT or LVMI, which are representative of ventricular remodeling parameters, in either of the study groups. The sAVR group had more profound LV mass regres- sion after 3 months. Early regression in mass and reverse LV remodeling after TAVR were reported in a previous study.28 In addition, previous 6-month follow-up TTE studies demonstrat- Fig. 3. Changes in diastolic function parameters over time. (A) Serial change of E velocity. (B) Serial change of e' velocity. (C) Serial change of E/e' ratio. (D) Serial change of RVSP. The error bars represent one standard deviation. E/e’: E velocity to e’ ratio; RVSP: right ventricular systolic pressure; TAVR: trans- catheter aortic valve replacement; sAVR: surgical aortic valve replacement; Pre: before the procedure; mo: months.
100 95 90 85 80 75 70
E velocity (cm/s)
p=0.048
p=0.048
p=0.045
p=0.54
Pre Immediate 3 mo
sAVR TAVR
A
5.0 4.5 4.0 3.5 3.0 2.5
e' velocity (cm/s)
p=0.048
p=0.048
p=0.39
p=0.54
Pre Immediate 3 mo
sAVR TAVR
B
29 27 25 23 21 19 17 15
E/e' ratio
p=0.048
p=0.361
p=0.39
p=0.54
Pre Immediate 3 mo
sAVR TAVR
C
45
40
35
30
25
RVSP (mm Hg)
p=0.032
p=0.27
p=0.54
p=0.54
Pre Immediate 3 mo
sAVR TAVR
D
ed that TAVR results in LV and LA reverse remodeling and ame- liorates LV relaxation and LA filling pressure in patients with severe AS and concentric hypertrophy.29,30 However, in our study, LV mass regression occurred earlier, and LV mass tend- ed to be lower immediately after the procedure than after 6 months. LV mass regression can be explained by reduced LV afterload and concomitant change in LV wall thickness. Al- though LVEDD, LVESD, and mitral regurgitation did not differ significantly between groups, smaller LVEDD and LVESD in the sAVR group, especially after 3 months, might be affected by less aortic regurgitation in sAVR than in TAVR, with more pa- tients using diuretics frequently after surgery to manage pleu- ral effusion and pulmonary edema. Other factors that could affect LV remodeling (e.g., hypertension, renal dysfunction, sex) and ventricular function warrant further study.
Limitations
This was a single-center study with a small number of patients and relatively short follow-up period. We found it difficult to find a matched surgical AVR group for head-to-head compar-
ison with TAVI group in the TAVI era among TAVI candidate pa- tients who were old and at high risk. Accordingly, we enrolled sAVR patients during the same period with the criterion of over 75 years of age for comparison with TAVR group. Because this study was not a randomized controlled trial, selection bias may be a factor due to patients with reduced EF not being included and patients with more advanced diastolic function being in- cluded. Furthermore, this was principally an echocardiograph- ic study, and we were unable to manifest differences in clini- cal outcomes between subgroups, possibly due to differences in diastolic dysfunction grade. The potential impact on clinical outcomes must be evaluated in a larger prospective trial with a longer follow-up, and a multi-center, large number registry study will be need in the future.
Conclusion
Our results indicate that LV diastolic function improves more rapidly and immediately after TAVR despite higher baseline risk. In addition, noted improvements persisted for up to 3 months. Thus, in patients with severe AS with advanced Table 5. LA and LV Structural Changes over Time
TAVR sAVR
Pre Immediate 3 months Pre Immediate 3 months
Cardiac index (L/min/m2) 3.2±0.9 3.6±1.4 3.2±0.9 3.5±0.9 3.8±0.8 3.5±1.2
LVEDD (mm) 48.7±7.7 48.1±7.3 49±7.7 49±7.8 48±7.8 45.4±4.5†
LVESD (mm) 33.5±9.3 32.6±8.9 33±8.6 33±8 32.2±8.1 30±4.9†
IVST (mm) 12.8±3.8 12.7±2.9 12±2.2 12±1.5 12.2±1.4 11±1.9
LVPWT (mm) 11.9±1.6 11.8±2.9 11.2±1.8 11.8±2.2 11.4±1.0 11±0.9
RWT 0.49±0.13 0.51±0.11 0.48±0.1 0.49±0.1 0.48±0.1 0.48±0.1
LVMI (g/m2) 159±48 156±50 148±48† 146±41 141±41 125±29†
LAVI (mL/m2) 43.3±16.7 42.8±17.2 44.2±16.1 51.1±22 45.9±17.4* 46.3±21.9
TAVR, transcatheter aortic valve replacement; sAVR, surgical aortic valve replacement; LA, left atrium; LV, left ventricle; LVEDD, left ventricular end-diastolic di- ameter; LVESD, left ventricular end-systolic diameter; IVST, interventricular septal thickness; LVPWT, left ventricular posterior wall thickness; RWT, relative wall thickness; LVMI, left ventricular mass index; LAVI, left atrial volume index.
Data are presented as means±SDs.
*Effect between pre-procedure and immediate procedure: p<0.05, †Significant difference only after 3 months: p<0.05 1.4
1.2 1.0 0.8 0.6 0.4 0.2
1800 1600 1400 1200 1000 800 600 400 200 0
SAC (mL . mm Hg–1 . m–2) SVR (dyne . s . cm–5)
p=0.866 p<0.001
p=0.182
p<0.001
p=0.871 p=0.68
p=0.295
p=0.198
Pre Immediate 3 mo Pre Immediate 3 mo
7 6 5 4 3 2 1 0 Zva (mm Hg . mL–1 . m–2)
p<0.001
p<0.001 p=0.67
p=0.093 Pre Immediate 3 mo
sAVR TAVR sAVR TAVR sAVR TAVR
A B C
Fig. 4. Changes in afterload parameters over time. (A) Serial change of valvuloarterial impedance. (B) Serial change of SAC. (C) Serial change of SVR. Error bars represent one standard error. TAVR: transcatheter aortic valve replacement; sAVR: surgical aortic valve replacement; Zva: valvuloarterial impedance;
SAC: systemic arterial compliance; SVR: systemic vascular resistance; Pre: before the procedure; mo: months.
diastolic dysfunction and at higher surgical risk, TAVR might be a better option than surgery and, potentially, the standard of care for severely symptomatic inoperable patients or for those at high risk of non-cardiovascular mortality after conventional surgery. These results might explicate the remarkable clinical improvement in improvements in advanced diastolic dys- function immediately after the TAVR procedure than sAVR.
AUTHOR CONTRIBUTIONS
Conceptualization: Geu-Ru Hong, Sang Jin Ha. Data curation: Sang Jin Ha. Formal analysis: Sang Jin Ha. Funding acquisition: Geu-Ru Hong.
Investigation: Sang Jin Ha, Geu-Ru Hong, Myeong-Ki Hong. Method- ology: Sang Jin Ha, Geu-Ru Hong. Project administration: Geu-Ru Hong. Resources: Myeong-Ki Hong, Geu-Ru Hong. Software: Sang Jin Ha, Geu-Ru Hong. Supervision: Geu-Ru Hong, Myeong-Ki Hong. Vali- dation: Sang Jin Ha, Sang-Yong Yoo, Geu-Ru Hong, Myeong-Ki Hong.
Visualization: Sang Jin Ha. Writing—original draft: Sang Jin Ha, Geu-Ru Hong. Writing—review & editing: Sang Jin Ha, Sang-Yong Yoo, Geu-Ru Hong, Myeong-Ki Hong.
ORCID iDs
Sang Jin Ha https://orcid.org/0000-0003-4275-6538 Sang-Yong Yoo https://orcid.org/0000-0002-9054-4698 Myeong-Ki Hong https://orcid.org/0000-0002-2090-2031 Geu-Ru Hong https://orcid.org/0000-0003-4981-3304
REFERENCES
1. Bax JJ, Delgado V, Bapat V, Baumgartner H, Collet JP, Erbel R, et al.
Open issues in transcatheter aortic valve implantation. Part 1: pa- tient selection and treatment strategy for transcatheter aortic valve implantation. Eur Heart J 2014;35:2627-38.
2. Gonçalves A, Marcos-Alberca P, Almeria C, Feltes G, Rodríguez E, Hernández-Antolín RA, et al. Acute left ventricle diastolic function improvement after transcatheter aortic valve implantation. Eur J Echocardiogr 2011;12:790-7.
3. Leon MB, Smith CR, Mack M, Miller DC, Moses JW, Svensson LG, et al. Transcatheter aortic-valve implantation for aortic stenosis in patients who cannot undergo surgery. N Engl J Med 2010;363:
1597-607.
4. Kodali SK, Williams MR, Smith CR, Svensson LG, Webb JG, Makkar RR, et al. Two-year outcomes after transcatheter or surgical aortic- valve replacement. N Engl J Med 2012;366:1686-95.
5. Kapadia SR, Tuzcu EM, Makkar RR, Svensson LG, Agarwal S, Ko- dali S, et al. Long-term outcomes of inoperable patients with aortic stenosis randomly assigned to transcatheter aortic valve replace- ment or standard therapy. Circulation 2014;130:1483-92.
6. Gotzmann M, Lindstaedt M, Bojara W, Mügge A, Germing A. He- modynamic results and changes in myocardial function after trans- catheter aortic valve implantation. Am Heart J 2010;159:926-32.
7. Spethmann S, Dreger H, Baldenhofer G, Stüer K, Saghabalyan D, Müller E, et al. Short-term effects of transcatheter aortic valve im- plantation on left atrial mechanics and left ventricular diastolic function. J Am Soc Echocardiogr 2013;26:64-71.
8. Vizzardi E, D’Aloia A, Fiorina C, Bugatti S, Parrinello G, De Carlo M, et al. Early regression of left ventricular mass associated with diastolic improvement after transcatheter aortic valve implanta- tion. J Am Soc Echocardiogr 2012;25:1091-8.
9. Bonow RO, Carabello BA, Chatterjee K, de Leon AC Jr, Faxon DP, Freed MD, et al. 2008 Focused update incorporated into the ACC/
AHA 2006 guidelines for the management of patients with valvu- lar heart disease: a report of the American College of Cardiology/
American Heart Association Task Force on Practice Guidelines (Writing Committee to Revise the 1998 Guidelines for the Manage- ment of Patients With Valvular Heart Disease): endorsed by the So- ciety of Cardiovascular Anesthesiologists, Society for Cardiovascu- lar Angiography and Interventions, and Society of Thoracic Surgeons.
Circulation 2008;118:e523-661.
10. Hahn RT, Abraham T, Adams MS, Bruce CJ, Glas KE, Lang RM, et al. Guidelines for performing a comprehensive transesophageal echocardiographic examination: recommendations from the Ameri- can Society of Echocardiography and the Society of Cardiovascu- lar Anesthesiologists. J Am Soc Echocardiogr 2013;26:921-64.
11. Zoghbi WA, Chambers JB, Dumesnil JG, Foster E, Gottdiener JS, Grayburn PA, et al. Recommendations for evaluation of prosthetic valves with echocardiography and doppler ultrasound: a report from the American Society of Echocardiography’s Guidelines and Standards Committee and the Task Force on Prosthetic Valves, de- veloped in conjunction with the American College of Cardiology Cardiovascular Imaging Committee, Cardiac Imaging Committee of the American Heart Association, the European Association of Echocardiography, a registered branch of the European Society of Cardiology, the Japanese Society of Echocardiography and the Ca- nadian Society of Echocardiography, endorsed by the American College of Cardiology Foundation, American Heart Association, European Association of Echocardiography, a registered branch of the European Society of Cardiology, the Japanese Society of Echo- cardiography, and Canadian Society of Echocardiography. J Am Soc Echocardiogr 2009;22:975-1014.
12. Lang RM, Badano LP, Mor-Avi V, Afilalo J, Armstrong A, Ernande L, et al. Recommendations for cardiac chamber quantification by echocardiography in adults: an update from the American Society of Echocardiography and the European Association of Cardiovas- cular Imaging. J Am Soc Echocardiogr 2015;28:1-39.
13. Baumgartner H, Hung J, Bermejo J, Chambers JB, Evangelista A, Griffin BP, et al. Echocardiographic assessment of valve stenosis:
EAE/ASE recommendations for clinical practice. Eur J Echocar- diogr 2009;10:1-25.
14. Zoghbi WA, Enriquez-Sarano M, Foster E, Grayburn PA, Kraft CD, Levine RA, et al. Recommendations for evaluation of the severity of native valvular regurgitation with two-dimensional and Dop- pler echocardiography. J Am Soc Echocardiogr 2003;16:777-802.
15. Nagueh SF, Smiseth OA, Appleton CP, Byrd BF 3rd, Dokainish H, Edvardsen T, et al. Recommendations for the evaluation of left ven- tricular diastolic function by echocardiography: an update from the American Society of Echocardiography and the European Associ- ation of Cardiovascular Imaging. J Am Soc Echocardiogr 2016;29:
277-314.
16. Stefanadis C, Stratos C, Boudoulas H, Kourouklis C, Toutouzas P.
Distensibility of the ascending aorta: comparison of invasive and non-invasive techniques in healthy men and in men with coronary artery disease. Eur Heart J 1990;11:990-6.
17. Chemla D, Hébert JL, Coirault C, Zamani K, Suard I, Colin P, et al.
Total arterial compliance estimated by stroke volume-to-aortic pulse pressure ratio in humans. Am J Physiol 1998;274:H500-5.
18. Briand M, Dumesnil JG, Kadem L, Tongue AG, Rieu R, Garcia D, et al. Reduced systemic arterial compliance impacts significantly on left ventricular afterload and function in aortic stenosis: implica- tions for diagnosis and treatment. J Am Coll Cardiol 2005;46:291-8.
19. Ikonomidis I, Tsoukas A, Parthenakis F, Gournizakis A, Kassimatis A, Rallidis L, et al. Four year follow up of aortic valve replacement
for isolated aortic stenosis: a link between reduction in pressure overload, regression of left ventricular hypertrophy, and diastolic function. Heart 2001;86:309-16.
20. Orsinelli DA, Aurigemma GP, Battista S, Krendel S, Gaasch WH.
Left ventricular hypertrophy and mortality after aortic valve re- placement for aortic stenosis. A high risk subgroup identified by preoperative relative wall thickness. J Am Coll Cardiol 1993;22:
1679-83.
21. Douglas PS, Berko B, Lesh M, Reichek N. Alterations in diastolic function in response to progressive left ventricular hypertrophy. J Am Coll Cardiol 1989;13:461-7.
22. Guarracino F, Talini E, Landoni G, Petronio S, Giannini C, Di Bello V. Effect of aortic valve surgery on left ventricular diastole assessed by echocardiography and neuroendocrine response: percutane- ous versus surgical approach. J Cardiothorac Vasc Anesth 2010;
24:25-9.
23. Nagueh SF, Appleton CP, Gillebert TC, Marino PN, Oh JK, Smiseth OA, et al. Recommendations for the evaluation of left ventricular diastolic function by echocardiography. J Am Soc Echocardiogr 2009;22:107-33.
24. Villari B, Vassalli G, Monrad ES, Chiariello M, Turina M, Hess OM.
Normalization of diastolic dysfunction in aortic stenosis late after valve replacement. Circulation 1995;91:2353-8.
25. Kempny A, Diller GP, Kaleschke G, Orwat S, Funke A, Schmidt R,
et al. Impact of transcatheter aortic valve implantation or surgical aortic valve replacement on right ventricular function. Heart 2012;
98:1299-304.
26. Covello RD, Maj G, Landoni G, Maisano F, Michev I, Guarracino F, et al. Anesthetic management of percutaneous aortic valve im- plantation: focus on challenges encountered and proposed solu- tions. J Cardiothorac Vasc Anesth 2009;23:280-5.
27. Lund O, Erlandsen M. Changes in left ventricular function and mass during serial investigations after valve replacement for aortic stenosis. J Heart Valve Dis 2000;9:583-93.
28. Fairbairn TA, Steadman CD, Mather AN, Motwani M, Blackman DJ, Plein S, et al. Assessment of valve haemodynamics, reverse ven- tricular remodelling and myocardial fibrosis following transcath- eter aortic valve implantation compared to surgical aortic valve re- placement: a cardiovascular magnetic resonance study. Heart 2013;
99:1185-91.
29. Lindman BR, Stewart WJ, Pibarot P, Hahn RT, Otto CM, Xu K, et al.
Early regression of severe left ventricular hypertrophy after trans- catheter aortic valve replacement is associated with decreased hospitalizations. JACC Cardiovasc Interv 2014;7:662-73.
30. Maayan K, Simon B, Yan T, Yigal A, Ofer H, Eyal BA, et al. Predic- tors of improvement in diastolic function after transcatheter aor- tic valve implantation. J Echocardiogr 2014;12:17-23.