Associations between Sarcopenia and Metabolic Risk Factors: A Systematic Review and Meta-Analysis
Yang Du, Chorong Oh, Jaekyung No*
Department of Food and Nutrition, Kyungsung University, Busan, Korea
Background: Metabolic risk factors can impact sarcopenia, but the direct relationship of metabolic risk factors with sarcopenia has not been examined. Our purpose was to investigate the effects of metabolic risk factors on sarcopenia in older adults.
Methods: Sixteen studies were found through a search of electronic databases and were subjected to a meta- analysis to investigate the differences in metabolic risk factors between patients with sarcopenia and controls.
The random-effects standardized mean difference ±95% confidence interval was calculated as the effect size.
Results: The results showed that body mass index (BMI), fasting glucose, systolic blood pressure (SBP), diastolic blood pressure (DBP), triglycerides (TG), homeostasis model assessment of insulin resistance (HOMA-IR), high- density lipoprotein cholesterol (HDL-C), and total cholesterol (d=3.252, d=2.039, d=2.956, d=2.579, d=2.123, d=1.195, d=–0.991, and d=1.007, respectively) all had relationships with sarcopenia. In addition, the effect siz- es of all male groups for all variables were higher than those of the female groups. However, only the between- sex effect size of HOMA-IR (P<0.01) was significant, while those for BMI, fasting glucose, SBP, DBP, TG, HDL-C, low-density lipoprotein cholesterol, and total cholesterol were not. Finally, the metabolic risk factors appeared to be significantly related to loss of skeletal muscle.
Conclusion: Nutrition and appropriate exercise to enhance muscle strength and quality in the elderly reduce the occurrence of sarcopenia, thereby reducing the incidence of metabolic diseases.
Key words: Sarcopenia, Metabolic diseases, Risk factors, Meta-analysis, Aged
Received March 26, 2018 Reviewed May 18, 2018 Accepted July 30, 2018
* Corresponding author Jaekyung No
https://orcid.org/0000-0003-2433-346X Department of Food and Nutrition, Kyungsung University, 309 Suyeong-ro, Nam-gu, Busan 48434, Korea Tel: +82-51-663-4651 Fax: +82-51-663-4651 E-mail: [email protected]
INTRODUCTION
The World Health Organization has reported that the global population of people older than the age of 65 years will reach at least 2 billion by 2050.
1The aging process can lead to sarcopenia, metabolic diseases, and other chronic diseases. According to the latest annual report on causes of death in the elderly in Korea, the number of patients with sarcopenia is rapidly increasing among those older than 65 years. Sarcopenia is considered to be a com- mon cause of mortality in this age group.
2In particular, sarcopenia has an increasing impact on the elderly, including incidence
3, dis-
ability
4, health management costs
5, and mortality.
6Therefore, sar- copenia is one of the major public health concerns among Korean older adults. It is suggested that the whole world should work to- gether to cope with this health issue and prevent the occurrence of sarcopenia and sarcopenia-related complications (such as hyper- tension and diabetes) in old age.
Sarcopenia is a syndrome associated with impaired muscle and metabolic function characterized by an age-related decline in skele- tal muscle mass and low levels of muscle function (muscle strength and physical activity).
7A number of studies have found
8-10that the diagnostic criteria for sarcopenia mainly consist of systolic blood
Copyright © 2018 Korean Society for the Study of Obesity
This is an Open Access article distributed under the terms of the Creative Commons Attribution Non-Commercial License (http://creativecommons.org/licenses/by-nc/4.0/) which per- mits unrestricted non-commercial use, distribution, and reproduction in any medium, provided the original work is properly cited.
eISSN 2508-7576
2017-03-16 https://crossmark-cdn.crossref.org/widget/v2.0/logos/CROSSMARK_Color_square.svg
Original Article
pressure (SBP), diastolic blood pressure (DBP), body mass index (BMI), and homeostasis model assessment of insulin resistance (HOMA-IR). Although sarcopenia working groups all over the world have introduced sarcopenic diagnostic criteria, sarcopenia is a relatively new concept, and assessment or diagnosis of the indica- tors is still controversial.
With the increase of the global elderly population, sarcopenia will be increasingly common.
11Sarcopenia is prone to increase the mortality rate of the elderly since it can increase the risk of meta- bolic diseases.
12Metabolic diseases refer to clinical syndromes in which risk factors for multiple cardiovascular diseases such as obe- sity, hypertension, hyperglycemia, dyslipidemia, and the like coex- ist in an individual. Insulin resistance is the basis of this clinical syn- drome. Recent studies reported that decreased skeletal muscle mass increases insulin resistance in vivo, which is closely related to the occurrence of metabolic diseases.
13,14For these reasons, increas- ing body mass can improve insulin sensitivity.
15In addition, sarco- penia results in atherosclerosis and triggers high blood pressure.
16With aging, body composition changes, loss of skeletal muscle, and/or increased fat mass may increase the risk of functional im- pairment and chronic metabolic disease.
Therefore, we performed a meta-analysis of the literature to de- termine the relationship between sarcopenia and possible metabol- ic risk factors. The objective of this study was to identify early-stage metabolic risk factors for sarcopenia. The results of this study should support instrumental suggestions for medical institutions and convalescent organizations to carry out corresponding preven- tive nutrition interventions to reduce the occurrence of metabolic diseases as early as possible.
METHODS
Although a meta-analysis is not a primary research method, it does include steps such as formulation of a problem, collection of data (studies), coding of data, and data analysis and interpreta- tion.
17Search strategy
Two investigators (YD, JK No) independently conducted an elec- tronic literature search of papers published from January 1, 1989 to
September 1, 2017. They conducted a thorough search of the four Korean electronic databases, KMbase, KISS, NDSL, and RISS; and of three overseas databases, PubMed, ScienceDirect, and Cochrane Library. For the PubMed search, controlled vocabulary terms and the following keywords were used: (“Sarcopenia”[MeSH] OR Sar- copenia [Title/Abstract]) AND (“Metabolic Diseases”[MeSH]) OR (Metabolic Diseases [Title/Abstract]) OR (Thesaurismosis [Title/Abstract]) OR (Thesaurismoses [Title/Abstract]) OR (Dis- eases, Metabolic [Title/Abstract]) OR (Disease, Metabolic [Title/
Abstract]) OR (Metabolic Disease [Title/Abstract]) and similar search strategy was run in other terms, which was restricted to stud- ies published in English or Korean. In addition, the systematic iden- tification, approval, synthesis, statistical merging, and reporting of the entire process of data extraction and selected studies were con- ducted based on a systematic review and meta-analysis of the Na- tional Evidence-based Healthcare Collaborating Agency.
18Study selection
We included studies that (1) compared data on metabolic risk factors between participants with sarcopenia versus those without, (2) reported on metabolic risk factors such as BMI, fasting glucose, SBP, DBP, triglycerides (TG), HOMA-IR, high-density lipoprotein cholesterol (HDL-C), low-density lipoprotein cholesterol (LDL- C), and total cholesterol, and (3) separated the data from men and women. Studies were excluded if they (1) did not measure or did not report metabolic risk factors in both sarcopenia and no sarco- penia subjects, (2) examined subjects younger than 65 years or used animal models, or (3) did not measure or report metabolic risk factors both in patients with and without sarcopenia.
Data extraction
Two authors (YD, JK No) independently extracted data from the selected studies into a standardized Microsoft Excel spreadsheet.
Any disagreement was resolved by consensus. The following infor-
mation was extracted: (1) study population characteristics (e.g.,
sample size, demographic), (2) survey site at which the study was
performed, (3) parameters related to metabolic risk factors in indi-
viduals with sarcopenia versus no sarcopenia, and (4) compared
data from men and women separately from the overall popula-
tion.
Quality assessment
In meta-analyses, the “file drawer problem” refers to unknown, unpublished research whose results fail to confirm the pattern re- vealed by the published findings.
19If no unpublished research is re- trieved, a publication bias can exist in favor of significant findings, which could distort the results of the meta-analysis. Cooper
20de- veloped a method for determining the magnitude of the file drawer problem: calculating the minimum number of unpublished studies reporting not significant findings that would be necessary to over- turn the conclusion reached in a particular meta-analysis. This number has been defined as the fail-safe number (Nfs).
20Rosenthal and Hall
21have proposed that a reasonable tolerance level of the file drawer problem has been achieved if the Nfs exceeds 5n+10 (n, number of studies included in the meta-analysis).
Statistical analysis
The meta-analysis was performed using comprehensive meta- analysis V2.0 for Windows (https://www.meta-analysis.com/).
Only outcomes from at least two studies can be subjected to meta- analysis, while outcomes from only one study were reported in the descriptive analyses. When combining studies, the random effects model was used to account for study heterogeneity
22by utilizing the standardized mean difference with its 95% confidence interval (CI). Study heterogeneity was measured using the chi-square and I-square statistics, with chi-square P≤0.05 and I-square ≥50% in- dicating the presence of crucial heterogeneity. Publication bias was assessed with a visual inspection of funnel plots and the Egger bias test
23for outcomes within these metabolic risk factors. Further- more, this study also utilized Nfs to verify the reliability of the re- searched nine metabolic risk factors. These factors were used for subgroup analysis based on the analysis of included studies, and the subgroup analysis compared men and women.
RESULTS
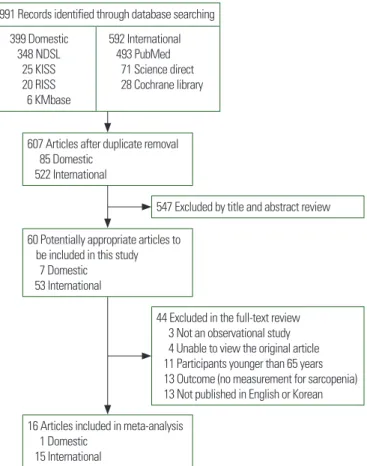
The search identified 991 potentially eligible studies, of which 384 duplicates were excluded. After excluding 547 papers through title and abstract review, 60 full-text articles were examined. After further examination, 16 studies were included in the meta-analysis (Fig. 1).
24-39Study and patient characteristics
Study and patient characteristics are summarized in Table 1. The 16 meta-analyzed studies included a total of 803,022 participants (62,273 with sarcopenia and 740,749 without). The majority of the studies were conducted in Asia and by social survey. All of the studies were published after the year 2000. The ages of the subjects ranged from 65 to 70 years in 11 papers (68.75%) and from 70 to 80 years in 10 papers (62.25%), and there were five papers in which the ages ranged from 65 to 80 years. There were two papers (12.5%) on studies of elderly women, four papers (25%) on elderly men, and 10 papers (62.5%) on both men and women. Among the 16 studies for the meta-analysis, the numbers of instances of the use of BMI, fasting glucose, SBP, DBP, TG, HOMA-IR, HDL-C, LDL-C, and total cholesterol as adjusted variables were 27, 20, 9, 9, 14, 12, 12, 7, and 14, respectively, since there were differences be- tween the male and female groups.
Figure 1. Flow of study analysis through different phases of the meta-analysis (from January 1, 1989 to September 1, 2017).
607 Articles after duplicate removal 85 Domestic
522 International
60 Potentially appropriate articles to be included in this study 7 Domestic
53 International
547 Excluded by title and abstract review
44 Excluded in the full-text review 3 Not an observational study 4 Unable to view the original article 11 Participants younger than 65 years 13 Outcome (no measurement for sarcopenia) 13 Not published in English or Korean 16 Articles included in meta-analysis
1 Domestic 15 International
991 Records identified through database searching 399 Domestic
348 NDSL 25 KISS 20 RISS 6 KMbase
592 International 493 PubMed 71 Science direct 28 Cochrane library
Table 1. Characteristics of the included studies
Author (year), country Sample size
(with/without sarcopenia) Sex (%) Setting Adjusted variable
Lee et al. (2013)24, South Korea 1,535 (510/1,025) M: 54.30 Social BMI, fasting glucose, HOMA-IR F: 45.70
Choi and Park (2016)25, South Korea 780,994 (57,246/723,748) M: 52.85 Social BMI, fasting glucose, SBP, DBP, TG, HDL-C, total cholesterol F: 47.15
Kang et al. (2017)27, South Korea 2,628 (557/2,071) F: 100 Social BMI, fasting glucose, SBP, DBP, TG, HDL-C, total cholesterol
Chung et al. (2013)28, South Korea 2,943 (1,248/1,695) M: 42.47 Social BMI, fasting glucose, SBP, DBP, TG, HOMA-IR, HDL-C, LDL-C, total cholesterol F: 57.53
Isanejad et al. (2016)29, Finland 496 (127/369) F: 100 Community BMI
Kim et al. (2014)30, South Korea 2,264 (540/1,724) M: 41.52 Social BMI, TG, HOMA-IR, HDL-C, LDL-C, total cholesterol F: 58.48
Buchmann et al. (2016)31, Germany 1,402 (280/1,122) M: 51.07 Community BMI, fasting glucose, TG, HOMA-IR, HDL-C F: 48.93
Lim et al. (2010)35, South Korea 565 (235/330) M: 50.80 Social BMI, fasting glucose, TG, HOMA-IR, HDL-C, LDL-C, total cholesterol F: 49.20
Chalhoub et al. (2015)34, United States 3,802 (127/3,675) M: 90.64 Community BMI F: 9.36
Pereira et al. (2015)33, Brazil 173 (20/153) M: 100 Social BMI Ishii et al. (2014)32, Japan 1,971 (359/1,612) M: 49.57 Social BMI
F: 50.43
Kim et al. (2017)26, South Korea 435 (138/297) M: 100 Social BMI, fasting glucose, SBP, DBP, TG, HDL-C,LDL-C, total cholesterol Baumgartner (2000)36, United States 562 (216/346) M: 51.33 Community BMI, fasting glucose, total cholesterol
F: 48.67
Chin et al. (2013)37, South Korea 1,076 (176/900) M: 100 Social BMI, fasting glucose, TG, HOMA-IR, HDL-C, LDL-C, total cholesterol Moon et al. (2015)38, South Korea 674 (35/639) M: 47.16 Social BMI, fasting glucose, SBP, DBP, TG, HDL-C
F: 52.84
Han et al. (2014)39, South Korea 1,502 (459/1,043) M: 100 Social BMI, fasting glucose, SBP, DBP, TG, HOMA-IR, HDL-C, total cholesterol M, male; F, female; BMI, body mass index; HOMA-IR, homeostasis model assessment of insulin resistance; SBP, systolic blood pressure; DBP, diastolic blood pressure; TG, triglycer- ides; HDL-C, high-density lipoprotein cholesterol; LDL-C, low-density lipoprotein cholesterol.
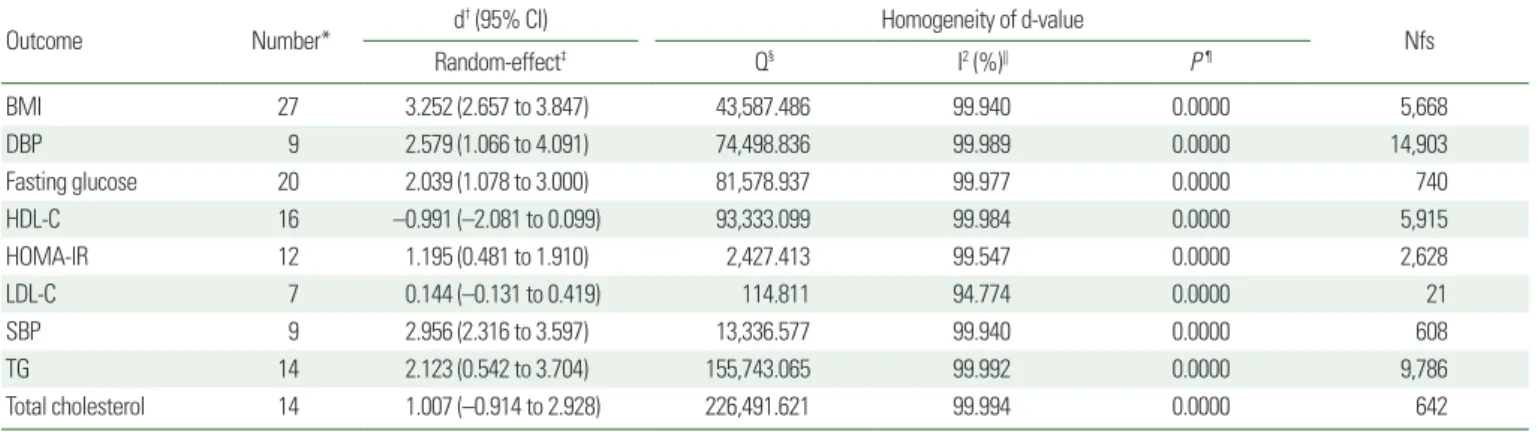
Table 2. Summary of results, overall effect sizes, and homogeneity of d-value
Outcome Number* d† (95% CI) Homogeneity of d-value
Random-effect‡ Q§ I2 (%)|| P ¶ Nfs
BMI 27 3.252 (2.657 to 3.847) 43,587.486 99.940 0.0000 5,668
DBP 9 2.579 (1.066 to 4.091) 74,498.836 99.989 0.0000 14,903
Fasting glucose 20 2.039 (1.078 to 3.000) 81,578.937 99.977 0.0000 740
HDL-C 16 –0.991 (–2.081 to 0.099) 93,333.099 99.984 0.0000 5,915
HOMA-IR 12 1.195 (0.481 to 1.910) 2,427.413 99.547 0.0000 2,628
LDL-C 7 0.144 (–0.131 to 0.419) 114.811 94.774 0.0000 21
SBP 9 2.956 (2.316 to 3.597) 13,336.577 99.940 0.0000 608
TG 14 2.123 (0.542 to 3.704) 155,743.065 99.992 0.0000 9,786
Total cholesterol 14 1.007 (–0.914 to 2.928) 226,491.621 99.994 0.0000 642
*The number of adjusted variables; †Overall effect size; ‡Indicates a significant effect (P< 0.001); §Cochran’s Q indicating significance of heterogeneity; ||The magnitude of heteroge- neity; ¶P-value represents the significance of heterogeneity.
CI, confidence interval; Nfs, fail-safe number; BMI, body mass index; DBP, diastolic blood pressure; HDL-C, high-density lipoprotein cholesterol; HOMA-IR, homeostasis model as- sessment of insulin resistance; LDL-C, low-density lipoprotein cholesterol; SBP, systolic blood pressure; TG, triglycerides.
Effect sizes
After data from the accepted 16 studies were pooled, all nine met- abolic risk factors of interest were found to have a significant rela- tionship with sarcopenia (Table 2), and the corresponding forest plots of these nine effect sizes are demonstrated in Fig. 2. Overall
effect sizes under random-effects assumptions indicate that BMI (d= 3.252; 95% CI, 2.657–3.845; P<0.001), fasting glucose (d=
2.039; 95% CI, 1.078–3.000; P<0.001), SBP (d=2.956; 95% CI, 2.316–3.579; P<0.001), DBP (d=2.579; 95% CI, 1.066–4.091;
P <0.001), TG (d =2.123; 95% CI, 0.542–3.704; P <0.001),
Figure 2. Forest plots of (A) body mass index, (B) fasting glucose, (C) systolic blood pressure, (D) diastolic blood pressure, (E) triglycerides, (F) homeostasis model assess- ment of insulin resistance, (G) high-density lipoprotein cholesterol, (H) low-density lipoprotein cholesterol, and (I) total cholesterol in subjects with sarcopenia vs. without sarcopenia. Std diff, standard difference; CI, confidence interval; M, male; F, female.
A B C
D E F
G H I
Study name
Study name
Study name
Study name
Study name
Study name
Study name
Study name
Study name Std diff in means and 95% CI
Std diff in means and 95% CI
Std diff in means and 95% CI
Std diff in means and 95% CI
Std diff in means and 95% CI
Std diff in means and 95% CI
Std diff in means and 95% CI
Std diff in means and 95% CI
Std diff in means and 95% CI Favours A Favours B
Favours A Favours B
Favours A Favours B
Favours A Favours B Favours A Favours B
Favours A Favours B
Favours A Favours B
Favours A Favours B
Favours A Favours B
HOMA-IR (d= 1.195; 95% CI, 0.481–1.910; P<0.001), HDL-C (d= –0.991; 95% CI, –2.08 to 0.099; P<0.0001), LDL-C (d=
0.144; 95% CI, –0.131 to 0.419; P<0.001), and total cholesterol (d= 1.007; 95% CI, –0.914 to 2.928; P<0.001) had a significant overall effect on sarcopenia. There was a large degree of heteroge- neity among studies, with I
2ranging from 99.547% to 99.994%.
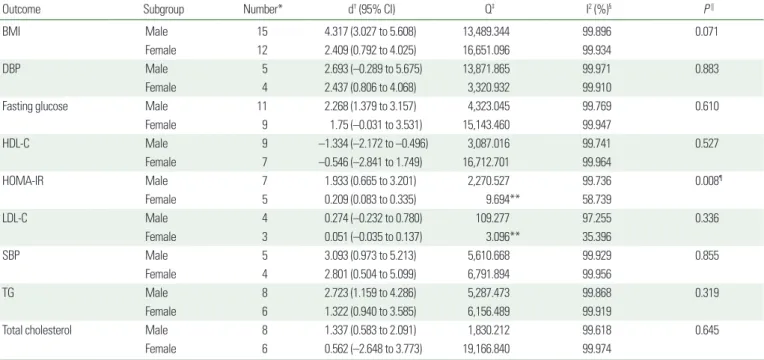
Subgroup analysis
The results of the random-effects categorical analysis by male and female subgroups are illustrated in Table 3. The results for the relationship of sarcopenia with metabolic risk factors in men and women were as follows: (1) the effect sizes of all of the male groups were higher than those of the female groups; (2) however, only the effect size of HOMA-IR (P<0.01) was significant, while the differ- ences of the effect sizes between men and women within each of the other eight risk factor subgroups, namely BMI, fasting glucose, SBP, DBP, TG, HDL-C, LDL-C, and total cholesterol, were not.
Reliability test
The Nfs computed for this meta-analysis regarding the effects of
BMI, fasting glucose, SBP, DBP, TG, HOMA-IR, HDL-C, LDL-C, and total cholesterol on sarcopenia were 5,668, 740, 608, 14,903, 9,786, 2,628, 5,915, 21, and 642 unpublished studies, respectively (Table 2). Only in the case of LDL-C were the Nfs not exceeded, with 45 unpublished studies; therefore, it is difficult to support the effect size.
Publication bias
Publication bias was evaluated to examine the validity of the re- sults of this study. The effect size of the included studies was not vi- sually symmetrical in the funnel plot, which is illustrated in Fig. 3.
An Egger linear regression test inferred the severity of the publica- tion bias.
40As a result, we added no new studies to convert the ef- fect size of the included studies from asymmetry to symmetry.
Therefore, the pooled effect size did not convert. To sum up, we could not ensure that the included studies had no publication bias;
however, there was also no evidence to call the validity of the re- sults into question.
Table 3. Effect sizes by sex
Outcome Subgroup Number* d† (95% CI) Q‡ I2 (%)§ P ||
BMI Male 15 4.317 (3.027 to 5.608) 13,489.344 99.896 0.071
Female 12 2.409 (0.792 to 4.025) 16,651.096 99.934
DBP Male 5 2.693 (–0.289 to 5.675) 13,871.865 99.971 0.883
Female 4 2.437 (0.806 to 4.068) 3,320.932 99.910
Fasting glucose Male 11 2.268 (1.379 to 3.157) 4,323.045 99.769 0.610
Female 9 1.75 (–0.031 to 3.531) 15,143.460 99.947
HDL-C Male 9 –1.334 (–2.172 to –0.496) 3,087.016 99.741 0.527
Female 7 –0.546 (–2.841 to 1.749) 16,712.701 99.964
HOMA-IR Male 7 1.933 (0.665 to 3.201) 2,270.527 99.736 0.008¶
Female 5 0.209 (0.083 to 0.335) 9.694** 58.739
LDL-C Male 4 0.274 (–0.232 to 0.780) 109.277 97.255 0.336
Female 3 0.051 (–0.035 to 0.137) 3.096** 35.396
SBP Male 5 3.093 (0.973 to 5.213) 5,610.668 99.929 0.855
Female 4 2.801 (0.504 to 5.099) 6,791.894 99.956
TG Male 8 2.723 (1.159 to 4.286) 5,287.473 99.868 0.319
Female 6 1.322 (0.940 to 3.585) 6,156.489 99.919
Total cholesterol Male 8 1.337 (0.583 to 2.091) 1,830.212 99.618 0.645
Female 6 0.562 (–2.648 to 3.773) 19,166.840 99.974
*The number of adjusted variables; †Effect size; ‡Cochran’s Q indicating significance of heterogeneity; §The magnitude of heterogeneity; ||P-value represents the significance of het- erogeneity; ¶Indicates a significant effect (P< 0.01); **Indicates fixed-effects.
CI, confidence interval; BMI, body mass index; DBP, diastolic blood pressure; HDL-C, high-density lipoprotein cholesterol; HOMA-IR, homeostasis model assessment of insulin resis- tance; LDL-C, low-density lipoprotein cholesterol; SBP, systolic blood pressure; TG, triglycerides.
Figure 3. Funnel plots of (A) body mass index, (B) fasting glucose, (C) systolic blood pressure, (D) diastolic blood pressure, (E) triglycerides, (F) homeostasis model assess- ment of insulin resistance, (G) high-density lipoprotein cholesterol, and (H) total cholesterol. Std diff, standard difference.
Std diff in means Std diff in means
A 0
0.5
1.0
1.5
2.0
Standard error
–50 –40 –30 –20 –10 0 10 20 30 40 50 Std diff in means
Funnel plot of standard error by Std diff in means
C 0
0.1
0.2
0.3
0.4
Standard error
–5 –4 –3 –2 –1 0 1 2 3 4 5 Std diff in means
Funnel plot of standard error by Std diff in means
E 0
0.1
0.2
0.3
0.4
Standard error
–9 –8 –7 –6 –5 –4 –3 –2 –1 0 1 2 3 4 5 6 7 8 9 Std diff in means
Funnel plot of standard error by Std diff in means
G 0
0.1
0.2
0.3
0.4
Standard error
–6 –5 –4 –3 –2 –1 0 1 2 3 4 5 6
Funnel plot of standard error by Std diff in means
B 0
0.1
0.2
0.3
0.4
Standard error
–8 –7 –6 –5 –4 –3 –2 –1 0 1 2 3 4 5 6 7 8 Std diff in means
Funnel plot of standard error by Std diff in means
D 0
0.1
0.2
0.3
0.4
Standard error
–6 –5 –4 –3 –2 –1 0 1 2 3 4 5 6
Std diff in means
Funnel plot of standard error by Std diff in means
F 0
0.1
0.2
0.3
0.4
Standard error
–7 –6 –5 –4 –3 –2 –1 0 1 2 3 4 5 6 7
Std diff in means
Funnel plot of standard error by Std diff in means
H 0
0.1
0.2
0.3
0.4
Standard error
–20 –10 0 10 20 Funnel plot of standard error by Std diff in means