• 검색 결과가 없습니다.

Risk Factors for Sarcopenia, Sarcopenic Obesity, and Sarcopenia Without Obesity in Older Adults

N/A
N/A
Protected

Academic year: 2021

Share "Risk Factors for Sarcopenia, Sarcopenic Obesity, and Sarcopenia Without Obesity in Older Adults"

Copied!
9
0
0

로드 중.... (전체 텍스트 보기)

전체 글

(1)

Article Info

Received June 24, 2021 Accepted July 8, 2021 Corresponding Author Chung-hwi Yi

E-mail: [email protected]

https://orcid.org/0000-0003-2554-8083

Key Words Aging

Body mass index Exercise

Machine learning Sarcopenia

Background: Muscle undergoes change continuously with aging. Sarcopenia, in which muscle mass decrease with aging, is associated with various diseases, the risk of falling, and the deterioration of quality of life. Obesity and sarcopenia also have a synergy effect on the disease of the older adults.

Objects: This study examined the risk factors for sarcopenia, sarcopenic obesity, and sarcope- nia without obesity and developed prediction models.

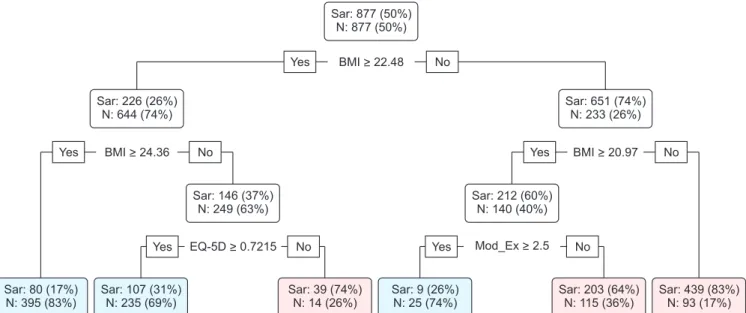
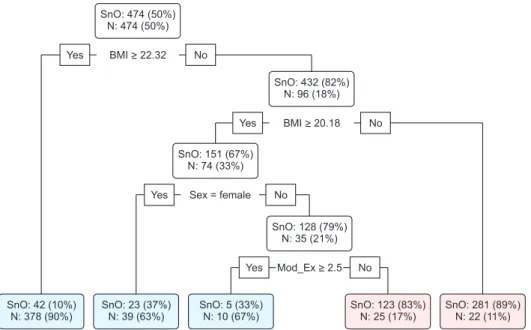
Methods: This machine-learning study used the 2008–2011 Korea National Health and Nu- trition Examination Surveys in the analysis. After data curation, 5,563 older participants were selected, of whom 1,169 had sarcopenia, 538 had sarcopenic obesity, and 631 had sarco- penia without obesity; the remaining 4,394 were normal. Decision tree and random forest models were used to identify risk factors.

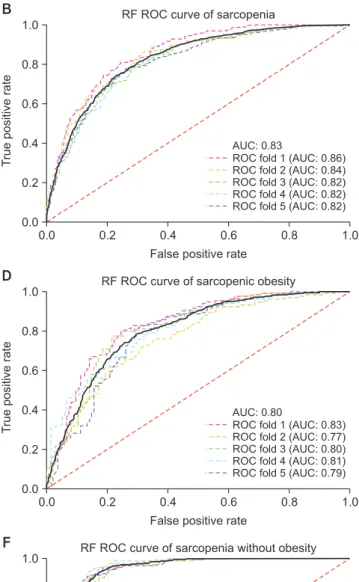
Results: The risk factors for sarcopenia chosen by both methods were body mass index (BMI) and duration of moderate physical activity; those for sarcopenic obesity were sex, BMI, and duration of moderate physical activity; and those for sarcopenia without obesity were BMI and sex. The areas under the receiver operating characteristic curves of all prediction models exceeded 0.75. BMI could predict sarcopenia-related disease.

Conclusion: Risk factors for sarcopenia-related diseases should be identified and programs for sarcopenia-related disease prevention should be developed. Data-mining research using population data should be conducted to enhance the effectiveness of early treatment for people with sarcopenia-related diseases through predictive models.

INTRODUCTION

Human body composition continuously changes with age:

body fat increases and muscle mass decreases, while body weight remains unchanged [1,2]. The loss of muscle mass is related to muscle strength (the force a muscle produces) and endurance (the ability of the muscle to contract continuously) at submaximal levels [3]. Furthermore, the motor units inner- vated in muscles change with age. A reduction in strength per motor unit is indicative of a decline in muscle quality [4]. The changes in muscle contribute to increased body fat because the loss of muscle mass reduces energy expenditures. Thus, changes in body composition lead to age-related impairment and disabilities [5]. In 1989, Rosenberg called this reduction of muscle mass with age “sarcopenia” [6].

Falls and fall-related injuries are common in older adults; the numbers of both increase exponentially with age [7]. The main causes of falls are old age, fear of falling, reduced balance, and impaired cognition and mobility [8,9]. One recently identified risk factor is sarcopenia [10,11], which plays a major role in the frailty and dysfunction of older adults; notably, it can lower their quality of life and affect mortality [12].

The increase in body fat with aging and decrease in physi- cal activity due to sarcopenia are important risk factors for obesity; reduction in physical activity can lead to further loss of muscle mass [13]. Obesity is important in the develop- ment of metabolic syndrome and cardiovascular disease [14].

Therefore, the combination of sarcopenia and obesity (i.e., sarcopenic obesity) in older adults has synergistic effects on physical disability, metabolic disorders, cardiovascular dis-

Copyright ⓒ Korean Research Society of Physical Therapy

This is an Open Access article distributed under the terms of the Creative Commons Attribution Non-Commercial License (http://creativecommons.org/licenses/by-nc/4.0) which permits unrestricted non-commercial use, distribution, and reproduction in any medium, provided the original work is properly cited.

Physical Therapy Korea

PTK https://doi.org/10.12674/ptk.2021.28.3.177 pISSN: 1225-8962 eISSN: 2287-982X Phys Ther Korea. 2021;28(3):177-185

Original Article

Risk Factors for Sarcopenia, Sarcopenic Obesity, and Sarcopenia Without Obesity in Older Adults

Seo-hyun Kim 1 , PT, BPT, Chung-hwi Yi 2 , PT, PhD, Jin-seok Lim 1 , PT, BPT

1

Department of Physical Therapy, The Graduate School, Yonsei University,

2

Department of Physical Therapy, College of Software and Digital

Healthcare Convergence, Yonsei University, Wonju, Korea

(2)

ease, and mortality [15]. Older adults with sarcopenic obesity have higher prevalences of coronary heart and cardiovascular diseases, and higher mortality rates due to these diseases, compared with non-sarcopenic older adults [16]. Therefore, it is necessary to prevent sarcopenia and sarcopenic obesity by identifying the risk factors of both.

Sarcopenia and sarcopenic obesity are affected by various factors, such as age, nutritional imbalance, hormones, me- tabolism, immunological factors, and physical inactivity [7,15].

One large study examined the role of nutritional factors in sar- copenia [17]. The relationships among sarcopenia, sarcopenic obesity, and prevalences of certain diseases have been inves- tigated [14,16,18]. Since various risk factors are interrelated, it is difficult to review them using statistical methods. Moreover, developing cost-effective risk prediction models in clinical settings is challenging. However, no machine-learning studies have yet examined the major risk factors for sarcopenia, sar- copenic obesity, and sarcopenia without obesity.

Therefore, this study examined risk factors for sarcopenia, sarcopenic obesity, and sarcopenia without obesity by means of machine learning; it also evaluated prediction models for these conditions.

MATERIALS AND METHODS

Data from the 2008 to 2011 Korea National Health and Nutrition Examination Surveys (KNHANES) were reviewed.

KNHANES assesses Koreans using a clustered, multistage, stratified, rolling sample; the assessment consists of a medi- cal examination, health questionnaire, and nutrition survey.

More than 800 items are surveyed each year. All assessments are conducted by professional survey teams consisting of nurses, nutritionists, and health researchers. Informed con- sent was obtained from each participant when the 2008 –2011 KNHANES were conducted.

1. Participants

The data used in this study were collected from 37,753 KNHANES participants. However, participants were excluded if they were under 60 years of age, if they had not provided data regarding skeletal muscle mass, or if they had missing val- ues. After exclusion, this study enrolled 5,563 participants. The participants’ characteristics are summarized in Table 1.

2. Sarcopenia and Obesity

The criteria for sarcopenia followed the approach of the 1998 New Mexico Elder Health Survey. Whole-body dual x-ray absorptiometry (QDR 4500A; Hologic, Waltham, MA, USA) was used to measure body lean mass and the appendicular skeletal muscle mass (ASM) was defined the sum of the lean masses of the legs and arms. The skeletal muscle mass index was calcu- lated using the formula ASM (kg)/square of height (m

2

). Sarco- penia was defined in accordance with Asia Working Group for Sarcopenia criteria (<5.4 kg/m

2

in women and <7.0 kg/m

2

in men).

The criterion selected for determination of obesity was a body fat ratio of 30%, because the body mass index (BMI) reflects both muscle and body fat [19]. The sarcopenia and normal groups were classified based on skeletal muscle mass index, with 1,169 and 4,394 participants, respectively. The sarcopenic obesity group comprised 538 participants with sarcopenia and a body fat ratio ≥ 30%; the sarcopenic without obesity group comprised 631 participants with sarcopenia and a body fat ratio < 30% (Figure 1).

3. Risk Factors Using Machine Learning 1) Determination of variables and sampling

Data were collected regarding 865 variables for 5,563 KNHANES participants. Variables for which more than 300 in- dividuals did not respond were excluded; participants who did not respond to the remaining 345 variables were also excluded.

Table 1.

Table 1. Participant characteristics

Characteristics Normal (n = 4,394) Sar (n = 1,169) SO (n = 538) SnO (n = 631)

Sex (male/female) 1,874/2,520 519/650 48/490 471/160

Age (y) 68.62 (5.85) 71.18 (6.15) 70.84 (6.20) 71.48 (6.10)

Height (cm) 157.82 (8.93) 156.74 (8.82) 152.33 (6.63) 160.51 (8.72)

Weight (kg) 61.36 (9.65) 51.56 (7.48) 52.23 (6.47) 50.98 (8.21)

BMI (kg/m

2

) 24.58 (2.94) 20.97 (2.47) 22.48 (2.07) 19.69 (2.02)

Body fat (%) 29.25 (7.82) 28.78 (8.60) 36.54 (4.16) 22.16 (5.22)

Values are presented as number only or mean (standard deviation). Sar, sarcopenia; SO, sarcopenic obesity; SnO, sarcopenia without obesity; BMI, body

mass index.

(3)

The variables removed are ophthalmologic disease, dental dis- ease, childhood-related variables and the variables included in this study are summarized in Table 2.

During the data processing, negative responses (defined as 0 [none] and 88 or 888 [not applicable]) were unified as 0. To confirm risk factors and make prediction models, the following groups were compared: (1) sarcopenia and normal, (2) sarco- penic obesity and normal, and (3) sarcopenia without obesity and normal. Participant numbers in each group were matched by using under sampling.

2) Decision tree

A decision tree is an analysis method that charts decision rules and categorizes groups of interest into several groups or makes predictions. Popular criteria are the Gini and entropy

indexes [20]. This study used the classification and regression trees algorithm to perform separation using the Gini index. A classification tree selects the predictor variables that maximize the reduction in impurity (minimizing the Gini index for cat- egorical variables and the expected sum variances for continu- ous variables as a node impurity criterion).

3) Random forest

Random forest is an ensemble technique that generates many classification trees by randomly selecting subsets of the given data and of the predictor variables, integrating the results of all models to obtain a random forest [20]. The top seven were selected as risk factors by calculating the mean decrease in accuracy and mean decrease in the Gini index through a random forest. Variables in the top seven were excluded if the Table 2.

Table 2. Survey variables used in machine learning

Survey classification Survey items

Health survey General information Sex, age

Education Academic background

Economic information Economic status, reasons for non-employment, employment form, position in the profession, occupation, the longest occupation

Quality of life Subjective health recognition, EQ-5D (mobility, self-care, usual activities, pain/discomfort, and anxiety/depression)

Morbidity Affected disease in the last 2 weeks, morbidity by 38 chronic diseases Activity restrictions Whether activity is restricted, reason for limiting activity

Smoking Lifelong smoking, currently smoking, past smoking, no smoking, second-hand smoke Drinking Lifelong drinking, drinking start age, drinking frequency, alcohol consumption, binge

drinking frequency

Physical activity Vigorous physical activity, moderate physical activity, walking practice, strength training, flexibility exercise

Mental health Sleep time, stress perception, depressive symptoms, suicide, mental problem counseling Obesity and weight control Subjective body recognition, weight control, weight control

Examination survey Body measurement Height, weight, waist circumference

Blood pressure and pulse Systolic blood pressure, diastolic blood pressure, pulse rate Respiratory examination Cough, phlegm, chest pain, difficulty breathing, fever Sarcopenic obesity (n = 538) Sarcopenia without obesity (n = 631)

Sarcopenia (n = 1,169) Normal (n = 4,394) Excluded

Younger than 60 (n = 29,075) No dual X-ray test (n = 2,679) Not responding to the remaining variables (n = 436)

Total (N = 37,753) KNHANESs IV-2 (2008, n = 9,744) KNHANESs IV-3 (2009, n = 10,533) KNHANESs V-1 (2010, n = 8,958) KNHANESs V-2 (2011, n = 8,518)

Figure 1.

Figure 1. Study design. KNHANES, Korea

National Health and Nutrition Examination

Surveys.

(4)

combined score of the mean decrease in accuracy and mean decrease in Gini index exceeded one standard deviation from the mean.

4) Model evaluation

The accuracy, sensitivity, and specificity of six models (i.e., the decision tree and random forest models) were confirmed for each type of sarcopenia. Sensitivity is the probability of accurately identifying people with a disease, while specific- ity is the probability of accurately identifying people without disease. The probability of classification prediction for each model’s test set was assessed with receiver operating charac- teristic (ROC) curve analysis to determine the reliability of the final model. The ROC curve is a graph that shows the trade-off between sensitivity and (1 –specificity) across a series of cutoff points. The area under the ROC curve (AUC) is considered an effective measure of the classification performance of the model.

4. Statistical Analysis

Statistical analyses were performed using RStudio (ver.

1.2.5042; RStudio, Boston, MA, USA). The dataset was split into a 75% training set and a 25% test set for each comparative analysis. Decision tree and random forest models have good prediction capabilities, but have been criticized for overfitting.

Therefore, 5-fold cross validation was used to evaluate the performances of the decision tree and random forest models.

RESULTS

1. Sarcopenia

The risk factors selected for sarcopenia using the decision tree method were BMI, duration of moderate physical activity, and EuroQol – 5 dimension descriptive system (EQ-5D) (Fig- ure 2). Moderate physical activity is defined as “a little more difficult than usual or causing some breathlessness”. For 1 week, participants recorded the duration of moderate physi- cal activity. EQ-5D is the preferred preference-based measure for health technology evaluation, with values ranging from 0 (death) to 1 (perfect health). The risk factors selected for sar- copenia using the random forest method were BMI, waist cir- cumference, age, subjective body recognition (very thin, thin, moderate, slightly plump, and very fat), duration of moderate physical activity, and weight control for 1 year (weight loss, weight retention, weight gain, and none).

The sarcopenia decision tree model had an accuracy (95%

confidence interval [CI]) of 76.2% (74.6 –77.8), sensitivity (95% CI) of 77.6% (74.5–80.7), specificity (95% CI) of 74.8%

(72.3–77.3), and AUC of 0.81. The sarcopenia random forest model had an accuracy (95% CI) of 75.4% (73.9–76.8), sensitiv- ity (95% CI) of 72.2% (68.9 –75.5), specificity (95% CI) of 78.6%

(77.1–80.1), and AUC of 0.83.

2. Sarcopenia Obesity

The risk factors selected for sarcopenic obesity using the

Sar: 80 (17%) N: 395 (83%)

Sar: 107 (31%) N: 235 (69%)

Sar: 39 (74%) N: 14 (26%)

Sar: 9 (26%) N: 25 (74%)

Sar: 203 (64%) N: 115 (36%)

Sar: 439 (83%) N: 93 (17%) Sar: 146 (37%)

N: 249 (63%)

Sar: 212 (60%) N: 140 (40%)

Yes No Yes No

Yes BMI > 24.36 No Sar: 226 (26%)

N: 644 (74%)

No Yes BMI > 20.97

Sar: 651 (74%) N: 233 (26%) Yes BMI > 22.48 No

Sar: 877 (50%) N: 877 (50%)

EQ-5D > 0.7215 Mod_Ex > 2.5

Figure 2.

Figure 2. Decision tree model of sarcopenia. Sar, sarcopenia; N, normal; BMI, body mass index; EQ-5D, EuroQol – 5 dimension descriptive system; Mod_

EX, duration of moderate physical activity.

(5)

decision tree method were sex, BMI, duration of moderate physical activity, and occupational classification (Figure 3).

Occupational classification is defined as “a position in one’

s profession”. 1: administrator, experts; 2: office worker; 3:

service and sales representatives; 4: agriculture, fisheries, and proficiency worker; 5: functional personnel, device and machine operation and assembly personnel; 6: simple labor worker; 7: unemployed (housewives, students, etc.). The risk factors selected for sarcopenic obesity using the random for- est method were BMI, waist circumference, sex, reasons for non-employment (unnecessary, studying, retirement, health problems, searching for a job, and parenting), and occupation (manager, expert, office worker, service worker, agriculture and fisheries worker, mechanic, simple laborer, and military), sleep time, and duration of moderate physical activity.

The sarcopenic obesity decision tree model had an accuracy (95% CI) of 73.6% (72.3–74.9), sensitivity (95% CI) of 76.8%

(72.9–81.1), specificity (95% CI) of 70.6% (66–75.2), and AUC of 0.78. The random forest model of sarcopenic obesity had an accuracy (95% CI) of 74% (72–76), sensitivity (95% CI) of 68%

(65.2–70.8), specificity (95% CI) of 79.8% (75.6–84), and AUC of

0.80.

3. Sarcopenia Without Obesity

The risk factors selected for sarcopenia without obesity us- ing the decision tree method were BMI, sex, and duration of moderate physical activity (Figure 4). The risk factors selected for sarcopenia without obesity using the random forest method were BMI, waist circumference, sex, subjective body recogni- tion, and weight control for 1 year.

The sarcopenia without obesity decision tree model had an accuracy (95% CI) of 87.8% (86.7 –88.9), sensitivity (95% CI) of 85.4% (84–86.7), specificity (95% CI) of 89.8% (87.5–92.1), and AUC of 0.9. The sarcopenia without obesity random forest model had an accuracy (95% CI) of 87.6% (86.6 –88.6), sensitiv- ity (95% CI) of 83.4% (82.4 –84.4), specificity (95% CI) of 92%

(90.4–93.6), and AUC of 0.93. The ROC curves for all models are shown in Figure 5.

DISCUSSION

In this study, we developed prediction models based on

SO: 36 (18%) N: 162 (82%)

SO: 1 (6%) N: 16 (94%)

SO: 15 (23%) N: 51 (77%)

SO: 2 (18%) N: 9 (82%)

SO: 45 (43%) N: 59 (57%)

SO: 305 (74%) N: 107 (26%)

Yes OC_P = 3 No

SO: 47 (41%) N: 68 (59%)

No Yes Age < 67.5

SO: 119 (65%) N: 62 (35%) No Yes Mod_Ex > 2.5

SO: 63 (32%) N: 135 (68%)

Yes BMI > 20.97 SO: 368 (60%)

N: 242 (40%)

Yes Sex = male No

SO: 404 (50%) N: 404 (50%)

No

Figure 3.

Figure 3. Decision tree model of sarcopenic obesity. SO, sarcopenic obesity; N, normal; BMI, body mass index; Mod_Ex, duration of moderate physical

activity; OC_P, occupational classification (a position in one’s profession).

(6)

cross-sectional data to identify risk factors for sarcopenia, sar- copenic obesity, and sarcopenia without obesity, using deci- sion tree and random forest models.

Machine learning has often been used to predict diseases and verify their risk factors. The decision tree classification model is a preferred method because it allows researchers to confirm the resulting model and cutoff values, thus justifying the selection of risk factors. A random forest creates multiple classification trees, each of which is trained on bootstrap samples of the original training data and determines the seg- mentation by searching for a subset of randomly selected input variables. Random forest is a popular method because it cre- ates several classification trees consisting of randomly selected factors and aggregates them to identify risk factors; all factors can be considered.

The overall risk factors for sarcopenia resulting from the de- cision tree and random forest models are BMI and duration of moderate physical activity. BMI is associated with weight and predicts skeletal muscle mass [21]. A previous study found that BMI was an important risk factor in logistic regression, support vector machine, gradient boosting, and random forest models [17]. We found that BMI was an important predictor of sarco- penia, consistent with previous studies.

Physical activity is an important risk factor for sarcopenia [7,22]. Older adults have a greater reduction in muscle mass than younger adults when physical activity is reduced by the same amount, especially with respect to fast-twitch type Ⅱ muscle fibers, which are faster and contract more strongly than

type Ⅰ muscle fibers [23]. This difference greatly influences the effects of sarcopenia in older adults; continuous physical activity is needed to stimulate muscles for healthy aging.

The overall risk factors of sarcopenic obesity determined by the two models were BMI, sex, and duration of moder- ate physical activity. Notably, BMI and duration of moderate physical activity were also risk factors for sarcopenia. While the other models chose BMI as the most important predictor, the decision tree model of sarcopenic obesity chose sex as the most important predictor; male sex had 82% accuracy for the normal group. This was similar to the results of a study that in- dicated a high prevalence of sarcopenic obesity in menopausal women due to an age-related reduction in sex hormones [24].

The risk factors for sarcopenia without obesity from the two models were BMI and sex. The prediction models of sarcope- nia without obesity had fewer risk factors, but performed bet- ter than the other models. The AUCs of the decision tree and random forest models performed well, with values of 0.9 and 0.93, respectively; thus, they are valuable for assessing whether older adults exhibit sarcopenia without obesity.

The accuracy, sensitivity, specificity, and AUC of each model were determined. The prediction models of sarcopenia had ac- ceptable accuracy (decision tree, 76.2%; random forest, 75.4%), sensitivity (77.6% and 72.2%), and specificity (74.8% and 78.6%). The prediction models of sarcopenic obesity exhibited the worst performance, with acceptable accuracy (73.6% and 76.8%), sensitivity (76.8% and 68%), and specificity (70.6% and 79.8%). The sarcopenia without obesity prediction models ex-

SnO: 42 (10%) N: 378 (90%)

SnO: 23 (37%) N: 39 (63%)

SnO: 5 (33%) N: 10 (67%)

SnO: 123 (83%) N: 25 (17%)

SnO: 281 (89%) N: 22 (11%) Yes Mod_Ex > 2.5 No

SnO: 128 (79%) N: 35 (21%) Yes Sex = female No

SnO: 151 (67%) N: 74 (33%)

Yes BMI > 20.18 No SnO: 432 (82%)

N: 96 (18%) Yes BMI > 22.32 No

SnO: 474 (50%) N: 474 (50%)

Figure 4.

Figure 4. Decision tree model of sarco-

penia without obesity. SnO, sarcopenia

without obesity; N, normal; BMI, body

mass index; Mod_Ex, duration of moderate

physical activity.

(7)

hibited the best performance, with high accuracy (87.8% and 87.6%), sensitivity (85.4% and 83.4%), and specificity (89.8%

and 92%). Given that X-ray absorptiometry is essential for di- agnosis of sarcopenia, our prediction models may be very use- ful because they use readily available variables.

Through machine learning, this study examined the major

risk factors of sarcopenia, sarcopenic obesity, sarcopenia with- out obesity, and even completed the evaluation by creating a prediction model. A previous study that examined risk factors associated with nutrition with machine learning showed that AUC was around 0.80 [17]. In this study, AUC of the sarcopenia classification model were better at 0.81, 0.83. We found that

T rue positive rate

0.0 1.0

0.8

0.6

0.4

0.2

1.0 False positive rate

0.0

0.2 0.4 0.6 0.8

DT ROC curve of sarcopenia

ROC fold 1 (AUC: 0.84) ROC fold 2 (AUC: 0.74) ROC fold 3 (AUC: 0.82) ROC fold 4 (AUC: 0.80) ROC fold 5 (AUC: 0.78)

RF ROC curve of sarcopenia

T rue positive rate

0.0 1.0

0.8

0.6

0.4

0.2

1.0 False positive rate

0.0

0.2 0.4 0.6 0.8

ROC fold 1 (AUC: 0.86) ROC fold 2 (AUC: 0.84) ROC fold 3 (AUC: 0.82) ROC fold 4 (AUC: 0.82) ROC fold 5 (AUC: 0.82)

T rue positive rate T rue positive rate

0.0

0.0 1.0

1.0 0.8

0.8 0.6

0.6 0.4

0.4 0.2

0.2

1.0

1.0 False positive rate

False positive rate 0.0

0.0

0.2

0.2

0.4

0.4

0.6

0.6

0.8

0.8 DT ROC curve of sarcopenic obesity

DT ROC curve of sarcopenia without obesity ROC fold 1 (AUC: 0.77) ROC fold 2 (AUC: 0.79) ROC fold 3 (AUC: 0.77) ROC fold 4 (AUC: 0.77) ROC fold 5 (AUC: 0.77)

ROC fold 1 (AUC: 0.90) ROC fold 2 (AUC: 0.90) ROC fold 3 (AUC: 0.89) ROC fold 4 (AUC: 0.89) ROC fold 5 (AUC: 0.92)

RF ROC curve of sarcopenic obesity

RF ROC curve of sarcopenia without obesity

T rue positive rate T rue positive rate

0.0

0.0 1.0

1.0 0.8

0.8 0.6

0.6 0.4

0.4 0.2

0.2

1.0

1.0 False positive rate

False positive rate 0.0

0.0

0.2

0.2

0.4

0.4

0.6

0.6

0.8

0.8 ROC fold 1 (AUC: 0.83) ROC fold 2 (AUC: 0.77) ROC fold 3 (AUC: 0.80) ROC fold 4 (AUC: 0.81) ROC fold 5 (AUC: 0.79)

ROC fold 1 (AUC: 0.93) ROC fold 2 (AUC: 0.94) ROC fold 3 (AUC: 0.91) ROC fold 4 (AUC: 0.93) ROC fold 5 (AUC: 0.94)

AUC: 0.81 AUC: 0.83

AUC: 0.78

AUC: 0.90

AUC: 0.80

AUC: 0.93

A B

C D

E F

Figure 5.

Figure 5. Receiver operating characteristic curve (ROC curve) for all models. (A) Decision tree model of sarcopenia, (B) random forest model of sarcope-

nia, (C) decision tree model of sarcopenic obesity, (D) random forest model of sarcopenic obesity, (E) decision tree model of sarcopenia without obesity,

and (F) random forest model of sarcopenia without obesity. DT, decision tree; RF, random forest; AUC, area under the ROC curve.

(8)

BMI and duration of moderate physical activity are associated with sarcopenia and BMI and duration of moderate physical activity might be an informative predictor in the primary care setting.

This study had several limitations. First, it did not include assessments of muscle strength and function (i.e., gait speed).

Recently, the European Working Group on Sarcopenia in Older People suggested that muscle mass, strength, and func- tion should all be considered during diagnosis of sarcopenia.

Unfortunately, muscle strength and function were not included as variables in the 2008 –2011 KNHANES. Further studies us- ing new sarcopenia criteria are needed. Second, this study was based on cross-sectional data; thus, the causal effects of risk factors on sarcopenia could not be confirmed. Further studies are necessary using longitudinal or cohort data with risk fac- tors.

CONCLUSIONS

This machine learning study confirmed that the risk factors from population data can predict sarcopenia-related diseases.

BMI is important risk factor for sarcopenia-related diseases.

Older adults with low BMI need to be careful to prevent sar- copenia. Moderate-intensity physical exercise prevents sarco- penia and sarcopenic obesity. More special care is needed to prevent sarcopenic obesity among older women. Our results suggest that the risk factors identified in this study can help develop effective sarcopenia-related disease prevention and intervention programs.

ACKNOWLEDGEMENTS

This study was supported by the “Brain Korea 21 FOUR Project”, the Korean Research Foundation for Department of Physical Therapy in the Graduate School of Yonsei University.

CONFLICTS OF INTEREST

No potential conflict of interest relevant to this article was reported.

AUTHOR CONTRIBUTIONS

Conceptualization: SK, CY. Data curation: SK, SY. Formal

analysis: SK, JL. Investigation: SK. Methodology: SK, JL. Project administration: SK. Resources: SK, CY, JL. Software: SK. Su- pervision: SK, CY. Visualization: SK. Writing - original draft:

SK. Writing - review & editing: SK, CY, JL.

ORCID

Seo-hyun Kim, https://orcid.org/0000-0002-6978-200X Jin-seok Lim, https://orcid.org/0000-0002-9965-9619

REFERENCES

1. von Haehling S, Morley JE, Anker SD. From muscle wasting to sarcopenia and myopenia: update 2012. J Cachexia Sarcope- nia Muscle 2012;3(4):213-7.

2. Hughes VA, Frontera WR, Roubenoff R, Evans WJ, Singh MA.

Longitudinal changes in body composition in older men and women: role of body weight change and physical activity. Am J Clin Nutr 2002;76(2):473-81.

3. Shumway-Cook A, Woollacott MH. Motor control: translating research into clinical practice. 4th ed. Philadelphia: Lippincott Williams & Wilkins; 2012.

4. Morley JE, Baumgartner RN, Roubenoff R, Mayer J, Nair KS.

Sarcopenia. J Lab Clin Med 2001;137(4):231-43.

5. Harris T. Muscle mass and strength: relation to function in population studies. J Nutr 1997;127(5 Suppl):1004S-6S.

6. Rosenberg IH. Summary comments. Am J Clin Nutr 1989;50(5):1231-3.

7. Keller K. Sarcopenia. Wien Med Wochenschr 2019;169(7- 8):157-72.

8. Wall BT, Dirks ML, van Loon LJ. Skeletal muscle atrophy dur- ing short-term disuse: implications for age-related sarcopenia.

Ageing Res Rev 2013;12(4):898-906.

9. Siegrist M, Freiberger E, Geilhof B, Salb J, Hentschke C, Lan- dendoerfer P, et al. Fall prevention in a primary care setting.

Dtsch Arztebl Int 2016;113(21):365-72.

10. Menant JC, Weber F, Lo J, Sturnieks DL, Close JC, Sachdev PS, et al. Strength measures are better than muscle mass measures in predicting health-related outcomes in older people: time to abandon the term sarcopenia? Osteoporos Int 2017;28(1):59-70.

11. Landi F, Liperoti R, Russo A, Giovannini S, Tosato M, Capolu-

ongo E, et al. Sarcopenia as a risk factor for falls in elderly

individuals: results from the ilSIRENTE study. Clin Nutr

(9)

2012;31(5):652-8.

12. Cruz-Jentoft AJ, Baeyens JP, Bauer JM, Boirie Y, Cederholm T, Landi F, et al.; European Working Group on Sarcopenia in Older People. Sarcopenia: European consensus on definition and diagnosis: report of the European Working Group on Sar- copenia in Older People. Age Ageing 2010;39(4):412-23.

13. Kim TN, Yang SJ, Yoo HJ, Lim KI, Kang HJ, Song W, et al.

Prevalence of sarcopenia and sarcopenic obesity in Korean adults: the Korean sarcopenic obesity study. Int J Obes (Lond) 2009;33(8):885-92.

14. Ryan AS, Nicklas BJ. Age-related changes in fat deposition in mid-thigh muscle in women: relationships with metabolic cardiovascular disease risk factors. Int J Obes Relat Metab Disord 1999;23(2):126-32.

15. Stenholm S, Harris TB, Rantanen T, Visser M, Kritchevsky SB, Ferrucci L. Sarcopenic obesity: definition, cause and conse- quences. Curr Opin Clin Nutr Metab Care 2008;11(6):693- 700.

16. Atkins JL, Whincup PH, Morris RW, Lennon LT, Papacosta O, Wannamethee SG. Sarcopenic obesity and risk of cardiovascu- lar disease and mortality: a population-based cohort study of older men. J Am Geriatr Soc 2014;62(2):253-60.

17. Kang YJ, Yoo JI, Ha YC. Sarcopenia feature selection and risk prediction using machine learning: a cross-sectional study.

Medicine (Baltimore) 2019;98(43):e17699.

18. Hernández-Ono A, Monter-Carreola G, Zamora-González J, Cardoso-Saldaña G, Posadas-Sánchez R, Torres-Tamayo M, et

al. Association of visceral fat with coronary risk factors in a population-based sample of postmenopausal women. Int J Obes Relat Metab Disord 2002;26(1):33-9.

19. Scott D, Cumming R, Naganathan V, Blyth F, Le Couteur DG, Handelsman DJ, et al. Associations of sarcopenic obesity with the metabolic syndrome and insulin resistance over five years in older men: the Concord Health and Ageing in Men Project.

Exp Gerontol 2018;108:99-105.

20. Esmaily H, Tayefi M, Doosti H, Ghayour-Mobarhan M, Nezami H, Amirabadizadeh A. A comparison between decision tree and random forest in determining the risk factors associated with type 2 diabetes. J Res Health Sci 2018;18(2):e00412.

21. Kenny AM, Dawson L, Kleppinger A, Iannuzzi-Sucich M, Judge JO. Prevalence of sarcopenia and predictors of skeletal muscle mass in nonobese women who are long-term users of estrogen-replacement therapy. J Gerontol A Biol Sci Med Sci 2003;58(5):M436-40.

22. Bae EJ, Kim YH. Factors affecting sarcopenia in Korean adults by age groups. Osong Public Health Res Perspect 2017;8(3):169-78.

23. Bauer JM, Kaiser MJ, Sieber CC. Sarcopenia in nursing home residents. J Am Med Dir Assoc 2008;9(8):545-51.

24. Kim M, Sohn C. Sarcopenia and sarcopenic obesity and their

association with cardiovascular disease risk in postmeno-

pausal women: results for the 2008-2011 Korea National

Health and Nutrition Examination Survey. Korean J Commu-

nity Nutr 2016;21(4):378-85.

수치

Figure 1. Study design. KNHANES, Korea  National Health and Nutrition Examination  Surveys.
Figure 2. Decision tree model of sarcopenia. Sar, sarcopenia; N, normal; BMI, body mass index; EQ-5D, EuroQol – 5 dimension descriptive system; Mod_
Figure 4. Decision tree model of sarco- sarco-penia without obesity. SnO, sarcosarco-penia  without obesity; N, normal; BMI, body  mass index; Mod_Ex, duration of moderate  physical activity.
Figure 5. Receiver operating characteristic curve (ROC curve) for all models. (A) Decision tree model of sarcopenia, (B) random forest model of sarcope- sarcope-nia, (C) decision tree model of sarcopenic obesity, (D) random forest model of sarcopenic obesi

참조

관련 문서

In addition, measurements at 0 and 12 weeks (body composition, α-amylase, metabolic syndrome related factors) were performed twice. For 12 weeks, the

As for the relationship of obesity level to clothing shopping orientation, the underweight boys made up the largest brand-oriented group, and the

A Retrospective Study of Prevalence and Risk factors for Neonatal Occipital

This study aims to identify whether socioeconomic level of parents affects obesity of adolescents and whether the relations between adolescent's obesity

Objective: This study was conducted to identify the association between vitamin D and Sarcopenia among all adults in Korea using data from the National Health and

Therefore, educational factors of general and musical creativity·personality education were examined and application plans for musical plays were identified

In this study, it can be seen that sex and metabolic syndrome are important for biological factors, and occupation, smoking, and exercise are important

This study was conducted to analyze the effects of obesity on the core stability and metabolic syndrome risk factors of middle - aged women.. The effect