pISSN 1738-3544 eISSN 2288-1662
The Differences of Metabolic Syndrome Risk Factors according to Obesity and Abdominal Obesity in Elderly Korean Women
Kyung-A Shin
Department of Clinical Laboratory Science, Shinsung University, Dangjin 31801, Korea
한국 노인여성의 비만, 복부비만 기준에 따른 대사증후군 위험요인의 차이
신경아
신성대학교 임상병리과
The study was performed to examine the metabolic syndrome risk factors in accordance with the obesity types based on body mass index (BMI) and waist circumference cutoffs. The diagnosis of metabolic syndrome closely adhered to the NCEP-ATP III criteria, and obesity was defined using the WHO Asian-Pacific criteria. We used the data from 591 elderly women, all aged over 65 years.
They were divided into four groups: The normal group (n=272), the obesity group (n=124), abdominal obesity group (n=19), and obesity-abdominal obesity group (n=176). The obe- sity-abdominal obesity group was the most prevalent group of low HDL-cholesterol ( p =0.009), hypertriglyceridemia ( p =0.025), abdominal obesity ( p <0.001), and metabolic syndrome ( p <0.001).
Logistic regression analysis demonstrated that the obesity-abdominal obesity group had the highest odds ratio in predicting metabolic syndrome (OR: 10.638, 95% CI: 6.053∼18.697).
Therefore, the obesity-abdominal obesity group was the strongest predictive factor of metabolic syndrome risk in Korean elderly women.
Key words: Metabolic syndrome, Obesity, Abdominal obesity
Corresponding author: Kyung-A Shin Department of Clinical Laboratory Science, Shinsung University, 1 Daehak-ro, Jeongmi-myeon, Dangjin 31801, Korea Tel: 82-41-350-1408
Fax: 82-41-350-1355 E-mail: [email protected]
This is an Open Access article distributed under the terms of the Creative Commons Attribution Non-Commercial License (http://creativecommons.org/licenses/by-nc/4.0) which permits unrestricted non-commercial use, distribution, and reproduction in any medium, provided the original work is properly cited.
Copyright © 2016 The Korean Society for Clinical Laboratory Science. All rights reserved.
Received: October 17, 2016 Revised 1
st: November 11, 2016 Revised 2
nd: November 23, 2016 Accepted: November 23, 2016
서 론
대사증후군은 이상지질혈증, 고혈압, 내당능장애, 비만과 같은 제 2형 당뇨병 및 심혈관질환을 유발하는 위험요인들이 동일한 환 자에게서 동시에 발생하며, 병태생리학적 원인으로 비만과 인슐린 저항성이 제시되고 있다[1,2]. 지방조직은 지방의 저장기관이라는 것 외에도 호르몬 및 사이토카인과 같은 물질을 분비하는 내분비 기관으로 인식되며[2], 비만은 고혈압, 당뇨병, 고지혈증 등의 성인
병 빈도를 증가시켜 관상동맥 및 뇌혈관질환 발생률을 증가시킨다[3].
노인에서는 대사이상으로 인한 비만 및 심혈관질환의 유병률이 높게 보고되며, 특히 여성노인에서 비만 및 복부비만 유병률은 남 성보다 높게 나타난다[4-6]. 여성은 폐경기 이후 에스트로겐 감소 로 지방 조직의 대사변화에 따른 체지방 분포 변화로 복부비만 및 내장지방의 증가가 가속화되고, 인슐린 저항성 및 지질대사 이상을 유발해 대사증후군 유병률이 증가하게 된다[7-11]. 중심성 비만 (central obesity)은 내장지방의 지방분해 활성 증가로 유리지방산
(free fatty acid)을 증가시키고, 이는 간으로 유입되어 간에서의 인 슐린 제거율과 인슐린 감수성이 저하한다[12,13]. 따라서 지방, 근 육 등의 말초조직에서는 유리지방산의 증가로 포도당 이용률이 낮 아져 인슐린저항성이 증가하며, 고인슐린혈증이 야기된다[12,13].
또한 노인 비만의 특징은 체질량지수가 낮음에도 불구하고 복부비 만의 빈도가 높게 나타나며, 특히 여성노인은 남성에 비해 복부비 만 유병률이 두 배 가량 증가하는 것으로 보고된다[6,14].
비만을 측정하는 지표 중 허리둘레는 체질량지수 보다 내장지방 및 대사장애와 더불어 심혈관질환에 대한 위험도 예측에 더 유용한 지표로 알려져 있다[15]. 현재 우리나라는 비만 인구 증가에 따른 대사증후군과 심혈관질환의 유병률이 증가하는 추세에 있으며, 서 양인과 달리 체질량지수가 낮음에도 심혈관질환 이환율이 높은 특 성을 보이고 있다[16,17]. 지속적으로 증가하는 국내 노인 비만에 서 비만과 대사증후군간의 관련성을 파악하고 관리하는 것은 보건 정책에 있어 중요하다고 할 수 있다. 그럼에도 불구하고 국내 노인 에 대한 비만지표들과 대사증후군 위험요인간의 관련성에 대한 연 구는 미비한 실정이다. 특히 체질량지수는 성별, 인종에 따라 체내 성분 분석결과의 차이를 보일 수 있어, 성별과 연령을 고려한 연구 가 필요하다고 생각된다[18,19]. 본 연구에서는 우리나라 노인여 성의 체질량지수와 허리둘레로 평가한 비만, 복부비만의 비만유형 에 따른 대사증후군 위험요인에 차이를 비교하여 그 경향성을 파악 하고자 하였다.
대상 및 방법
1. 연구 대상
연구 대상자는 2012년 1월부터 2014년 12월까지 경기지역 일 개 종합병원에서 건강검진을 실시한 65세 이상 노인여성을 대상으 로 하였다. 전체 대상자 771명 중에서 결측치를 포함한 180명을 제 외한 591명을 최종 대상자로 선정하였다. 비만과 복부비만 기준에 따른 대사증후군 위험요인의 차이를 규명하기 위해 대상자들을 체 질량지수(body mass index, BMI)와 허리둘레 기준에 따라 정상군 (normal group; BMI<25 kg/m
2
, 허리둘레<85 cm), 단순비만군 (obesity group; BMI≥25 kg/m2
, 허리둘레<85 cm), 복부비만군 (abdominal obesity group; BMI<25 kg/m2
, 허리둘레≥85 cm), 비만-복부비만군(obesity-abdominal obesity group; BMI≥25 kg/m2
, 허리둘레≥85 cm)의 4군으로 분류하였다. 비만 기준은 세 계보건기구 아시아 태평양 기준에서 제시한 비만 기준에 따라 BMI≥25 kg/m
2
을 비만으로 정의하였으며[20], 복부비만 기준은 대한 비만학회(Korean Society for the Study of Obesity)에서 제시한 여성의 허리둘레 85 cm 이상을 복부비만으로 적용하였다[21]. 연구 대상자가 복용하는 약물에 대해서는 설문지로 조사하였으며, 본 연구는 기관생명윤리위원회의 승인을 받아 시행되었다(IRB No:
D-1205-008-2460).
2. 연구방법 1) 진단기준
대사증후군은 The National Cholesterol Education Program Adult Treatment Panel III (NCEP-ATP III)의 진단기준에 따라 분 류하였으며, 아래의 5가지 기준 중 3개 이상 해당될 경우 대사증후 군으로 정의하였다. 1) 중성지방 ≥150 mg/dL 또는 고중성지방혈 증 약을 복용하는 경우 2) HDL-콜레스테롤은 여성 <50 mg/dL 3) 혈압 ≥130/85 mmHg 또는 고혈압 약을 복용하는 경우 4) 공복혈 당 >110 mg/dL 5) 허리둘레는 여성 ≥88 cm으로 정의하고 있으 나, 복부비만은 국내 기준에 적합한 대한 비만학회(Korean Society for the Study of Obesity)에서 제시한 기준을 적용하였다 [21,22]. 고혈압 진단기준은 60세 이상의 경우 2014년 미국 고혈압 합동위원회 8차 보고서(eighth joint national committee, JNC 8) 에 따라 ≥150/90 mmHg를 고혈압으로[23], 당뇨 진단기준은 2010년 미국당뇨병협회에서 제시한 공복혈당 ≥126 mg/dL, 당화 혈색소 기준으로는 ≥6.5%을 당뇨병으로 진단하였다[24]. 이상지 질혈증 진단기준은 2015년 제3판 한국지질동맥경화학회 이상지 질혈증 치료지침에 따라 고LDL-콜레스테롤혈증(≥160 mg/dL 또 는 콜레스테롤약을 복용중인 자), 고중성지방혈증(≥200 mg/dL), 저HDL-콜레스테롤혈증(<40 mg/dL)의 3가지 지표 중 한가지라 도 해당되는 경우 이상지질혈증으로 진단하였다[25].
2) 신체계측 및 혈압측정
신장과 체중은 DS-103M (Jenix, Seoul, Korea) 장비로 계측하 였으며, 체질량지수(body mass index, BMI) (kg/m
2
)는 체중 (kg)÷신장의 제곱(m2
)으로 제시하였다. 허리둘레는 양 발을 25∼30 cm 정도 벌리고 숨을 내쉰 상태에서 갈비뼈 가장 아래 위치와 골반의 가장 높은 위치의 중간 부분을 측정하였으며, 엉덩이 둘레 는 옆에서 보았을 때 엉덩이의 가장 높은 부분을 줄자로 측정하였 다. 허리-엉덩이 둘레비율(waist to hip ratio, WHR)은 허리둘레
÷엉덩이 둘레이며, 키-허리둘레 비율(waist to height ratio, WHtR)은 키÷엉덩이 둘레를 의미한다. 또한 수축기와 이완기 혈 압은 앉은 자세로 10분 동안 안정 후 수은 혈압계로 측정하였다.
3) 혈액검사
혈액검사는 8시간 공복 후 오전에 채혈을 실시하여, TBA-200FR NEO (Toshiba, Tokyo, Japan) 생화학 자동분석기로 총콜레스테
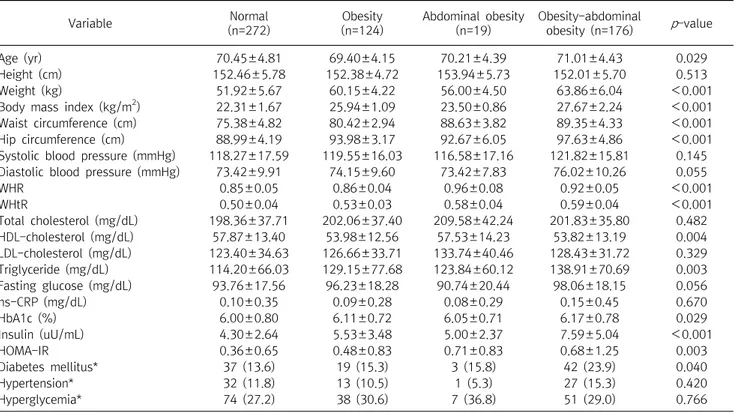
Table 1. Subjects clinical characteristics according to the obesity, abdominal obesity
Variable Normal
(n=272)
Obesity (n=124)
Abdominal obesity (n=19)
Obesity-abdominal
obesity (n=176) p -value
Age (yr) 70.45±4.81 69.40±4.15 70.21±4.39 71.01±4.43 0.029
Height (cm) 152.46±5.78 152.38±4.72 153.94±5.73 152.01±5.70 0.513
Weight (kg) 51.92±5.67 60.15±4.22 56.00±4.50 63.86±6.04 <0.001
Body mass index (kg/m
2) 22.31±1.67 25.94±1.09 23.50±0.86 27.67±2.24 <0.001
Waist circumference (cm) 75.38±4.82 80.42±2.94 88.63±3.82 89.35±4.33 <0.001
Hip circumference (cm) 88.99±4.19 93.98±3.17 92.67±6.05 97.63±4.86 <0.001
Systolic blood pressure (mmHg) 118.27±17.59 119.55±16.03 116.58±17.16 121.82±15.81 0.145 Diastolic blood pressure (mmHg) 73.42±9.91 74.15±9.60 73.42±7.83 76.02±10.26 0.055
WHR 0.85±0.05 0.86±0.04 0.96±0.08 0.92±0.05 <0.001
WHtR 0.50±0.04 0.53±0.03 0.58±0.04 0.59±0.04 <0.001
Total cholesterol (mg/dL) 198.36±37.71 202.06±37.40 209.58±42.24 201.83±35.80 0.482
HDL-cholesterol (mg/dL) 57.87±13.40 53.98±12.56 57.53±14.23 53.82±13.19 0.004
LDL-cholesterol (mg/dL) 123.40±34.63 126.66±33.71 133.74±40.46 128.43±31.72 0.329
Triglyceride (mg/dL) 114.20±66.03 129.15±77.68 123.84±60.12 138.91±70.69 0.003
Fasting glucose (mg/dL) 93.76±17.56 96.23±18.28 90.74±20.44 98.06±18.15 0.056
hs-CRP (mg/dL) 0.10±0.35 0.09±0.28 0.08±0.29 0.15±0.45 0.670
HbA1c (%) 6.00±0.80 6.11±0.72 6.05±0.71 6.17±0.78 0.029
Insulin (uU/mL) 4.30±2.64 5.53±3.48 5.00±2.37 7.59±5.04 <0.001
HOMA-IR 0.36±0.65 0.48±0.83 0.71±0.83 0.68±1.25 0.003
Diabetes mellitus* 37 (13.6) 19 (15.3) 3 (15.8) 42 (23.9) 0.040
Hypertension* 32 (11.8) 13 (10.5) 1 (5.3) 27 (15.3) 0.420
Hyperglycemia* 74 (27.2) 38 (30.6) 7 (36.8) 51 (29.0) 0.766
Calculated by one way ANOVA.
Values are presented as mean±SD.
*Calculated by
2-test. Data are presented as number (%).
Abbreviation: WHR, waist hip ratio; WHtR, waist height ratio; HDL, high density lipoprotein; LDL, low density lipoprotein; hs-CRP, high sensitivity C-reactive protein; HbA1c, hemoglobin A1c; HOMA-IR, homeostasis model assessment-insulin resistance.
롤, 중성지방, HDL-콜레스테롤, LDL-콜레스테롤, 공복혈당, 고감 도 C-반응단백질(high sensitivity C-reactive protein, hs-CRP) 을 측정하였다. 당화혈색소(hemoglobin A1c, HbA1c)검사는 EDTA 전혈 검체로 Variant II (Bio Rad, CA, USA) 장비를 이용하여 고성능액체크로마토그래피법(high performance liquid chro- matography, HPLC)의 원리로 측정하였다. 또한 인슐린은 Modular Analytics E170 (Roche, Mannheim, Germany) 장비로 전기화학발 광면역분석법(electrochemiluminescence immunoassay, ECLIA) 의 원리로 검사하였으며, 인슐린 저항성 지표인 HOMA-IR (home- ostasis model assessment-insulin resistance)은 공복 혈당과 인 슐린 농도를 이용하여 다음 공식으로 계산하였다[26]. HOMA-IR=
(공복시 인슐린 IU/mL×공복시 혈당 mg/dL)/405.
3. 통계분석
본 연구의 자료 분석은 Windows SPSS 21.0 (IBM, Armonk, USA) 통계프로그램을 사용하였으며, 비만, 복부비만 기준에 따른 네 군간의 대사증후군 위험요인의 차이를 비교하기 위해 일원배치 분산분석(one way ANOVA)을 실시하였다. 또한 비만, 복부비만 기준에 따른 집단간 당뇨, 고혈압, 이상지질혈증과 대사증후군 위
험요인의 유병률을 비교하기 위해 chi-square test를 시행하였다.
비만, 복부비만의 지표가 되는 체질량지수, 허리둘레와 대사증후 군 위험요인간의 상관성을 알아보기 위해 피어슨 상관분석 (Pearson correlation coefficient)을 실시하였다. 비만, 복부비만 기준에 따른 비만 유형과 대사증후군 및 대사증후군 개별 위험요인 간의 관련성을 알아보기 위해 로지스틱 회귀분석(logistic regression)을 실시하였으며, 오즈비(odds ratio, OR)와 95% 신뢰 구간(confidence interval, CI)을 제시하였다. 본 연구결과에 대한 통계적 유의수준은
p
<0.05 로 설정하였다.결 과
1. 비만, 복부비만에 따른 대상자의 의학적 특징
연구 대상자 591명 중 비만, 복부비만에 따라 비만 유형을 분류 한 결과 정상군 272명, 단순비만군 124명, 복부비만군 19명, 비만- 복부비만군 176명 이었다. 연령은 집단간 차이를 보였다 (
p
=0.029). 체중, 체질량지수, 허리둘레 및 엉덩이 둘레, WHR, WHtR은 집단간 차이가 있었으며, WHR을 제외하고는 비만-복부 비만군이 가장 높게 나타났다(각각p
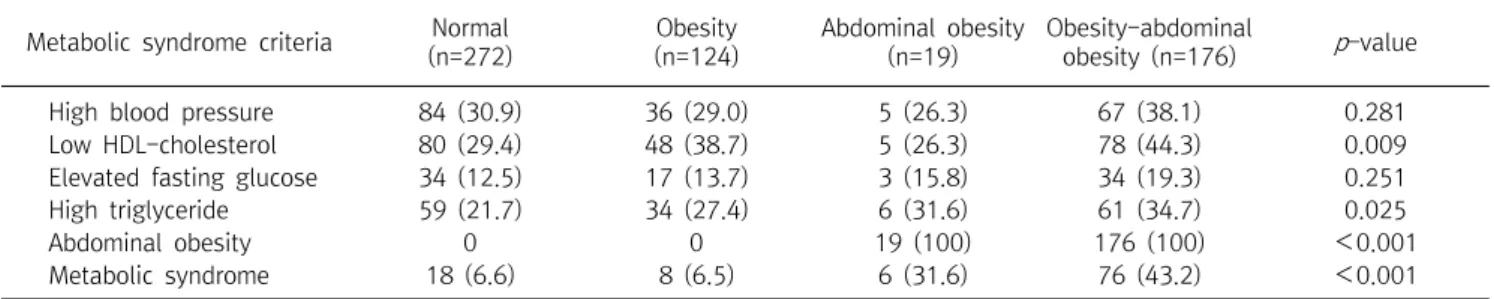
<0.001). 혈액변인 중 HDL-Table 2. Prevalence of risk factors according to the obesity, abdominal obesity
Metabolic syndrome criteria Normal (n=272)
Obesity (n=124)
Abdominal obesity (n=19)
Obesity-abdominal
obesity (n=176) p -value
High blood pressure 84 (30.9) 36 (29.0) 5 (26.3) 67 (38.1) 0.281
Low HDL-cholesterol 80 (29.4) 48 (38.7) 5 (26.3) 78 (44.3) 0.009
Elevated fasting glucose 34 (12.5) 17 (13.7) 3 (15.8) 34 (19.3) 0.251
High triglyceride 59 (21.7) 34 (27.4) 6 (31.6) 61 (34.7) 0.025
Abdominal obesity 0 0 19 (100) 176 (100) <0.001
Metabolic syndrome 18 (6.6) 8 (6.5) 6 (31.6) 76 (43.2) <0.001
Calculated by
2-test.
Values are presented as Number (%).
Abbreviation: LDL, low density lipoprotein.
Fig. 1. The number of components of metabolic syndrome according to the obesity and abdominal obesity. Obesity and obesity-abdominal obesity rate were increased with increasing number of components of the metabolic syndrome.
콜레스테롤(
p
=0.004), 중성지방(p
=0.003), HbA1c (p
=0.029), 인 슐린(p
<0.001), HOMA-IR (p
=0.003)은 집단간 차이를 보였으 며, 중성지방, HbA1c, 인슐린은 비만-복부비만군이 가장 높게 나 타났으며, HDL-콜레스테롤은 비만-복부비만군이 가장 낮게 나타 났다. 또한 당뇨는 집단간 유병률의 차이를 보였으며, 비만-복부비 만군에서 가장 높은 유병률을 보였다(p
=0.040) (Table 1).2. 비만, 복부비만에 따른 대사증후군 위험요인 유병률
비만, 복부비만 기준에 따른 대사증후군 위험요인의 유병률 차 이를 비교한 결과 낮은 HDL-콜레스테롤혈증(
p
=0.009), 고중성지 방혈증(p
=0.025), 복부비만(p
<0.001), 대사증후군 진단 유병률 (p
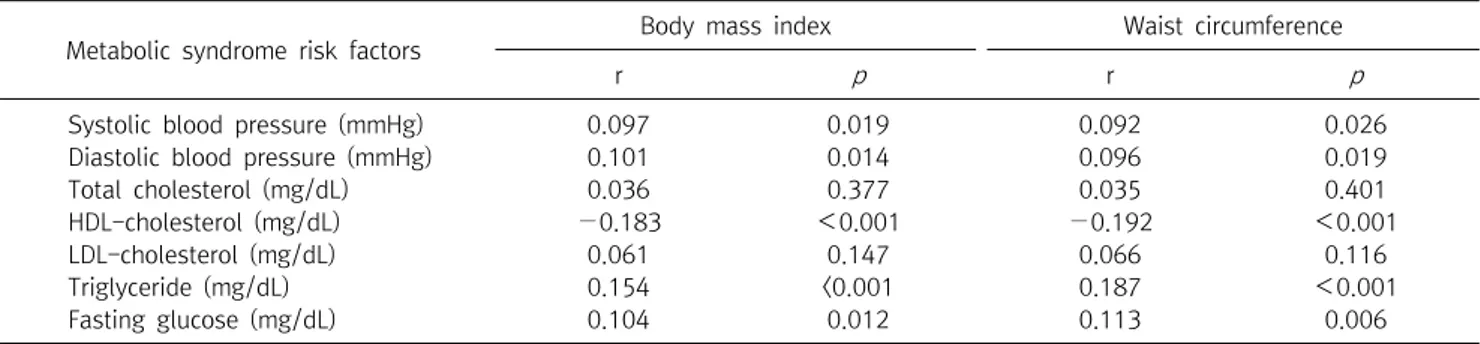
<0.001)은 집단간 차이를 보였으며, 비만-복부비만군에서의 유병률이 높게 나타났다(Table 2). 대사증후군 위험요인의 개수가 낮을수록 단순비만군의 비율이 높았으며, 위험요인의 개수가 증가 할수록 복부비만군, 비만-복부비만군의 비율이 높게 나타났다(Fig. 1).3. 체질량지수 및 허리둘레와 대사증후군 위험요인간의 상관성 체질량지수는 대사증후군 각각의 위험요인 중 수축기(r=0.097,
p
=0.019)와 이완기 혈압(r=0.101,p
=0.014), 중성지방(r=0.154,p
<0.001), 공복혈당(r=0.104,p
=0.012)과 양의 상관관계를 보였 으며, HDL-콜레스테롤(r=−0.183,p
<0.001)과는 음의 상관관계 를 보였다. 허리둘레 역시 수축기(r=0.092,p
=0.026)와 이완기 혈 압(r=0.096,p
=0.019), 중성지방(r=0.187,p
<0.001), 공복혈당 (r=0.113,p
=0.006)과 양의 상관관계를 나타냈으며, HDL-콜레스 테롤(r=−0.192,p
<0.001)과는 음의 상관관계를 보였다. 그러나 총콜레스테롤과 LDL-콜레스테롤은 BMI 및 허리둘레와 상관성이 없는 것으로 나타났다(Table 3).4. 비만, 복부비만 기준에 따른 비만유형과 대사증후군 및 대사증후군 위험요인간의 관련성
로지스틱 회귀분석을 통해 복부비만 기준에 따른 비만유형과 대 사증후군 각각의 위험요인 및 대사증후군 진단간의 관련성을 분석 한 결과, 정상군에 비해 단순비만군에서 낮은 HDL-콜레스테롤혈 증의 발생이 1.6배 높았으며(odds ratio, OR: 1.576, 95% confidence interval, 95% CI: 1.006∼2.469), 비만-복부비만군에서는 1.9배 높은 양상을 보였다(OR: 1.882, 95% CI: 1.266∼2.799). 고중성 지방혈증은 정상군보다 비만-복부비만군에서 1.9배 높았다(OR:
1.904, 95% CI: 1.246∼2.910). 또한 정상군보다 복부비만군에서 대사증후군 발생이 6.6배 높았으며(OR: 6.579, 95% CI: 2.233∼
19.385), 비만-복부비만군의 경우 10.6배 높은 양상을 보였다 (OR: 10.638, 95% CI: 6.053∼18.697) (Table 4).
고 찰
이 연구는 노인여성을 대상으로 비만, 복부비만 기준에 따라 정 상군, 단순비만군, 복부비만군, 비만-복부비만군의 4군으로 분류 하여 대사증후군 위험요인의 차이를 알아보고, 비만, 복부비만 기 준에 따른 비만 유형과 대사증후군 위험요인과의 관련성을 규명하 고자 하였다.
Table 3. Correlation between metabolic syndrome risk factors and BMI, waist circumference
Metabolic syndrome risk factors Body mass index Waist circumference
r p r p
Systolic blood pressure (mmHg) 0.097 0.019 0.092 0.026
Diastolic blood pressure (mmHg) 0.101 0.014 0.096 0.019
Total cholesterol (mg/dL) 0.036 0.377 0.035 0.401
HDL-cholesterol (mg/dL) −0.183 <0.001 −0.192 <0.001
LDL-cholesterol (mg/dL) 0.061 0.147 0.066 0.116
Triglyceride (mg/dL) 0.154 <0.001 0.187 <0.001
Fasting glucose (mg/dL) 0.104 0.012 0.113 0.006
Calculated by Pearson correlation coefficient.
Abbreviation: HDL, high density lipoprotein; LDL, low density lipoprotein.
Table 4. Odds ratios of having metabolic syndrome risk factors
Metabolic syndrome criteria Normal Obesity Abdominal obesity Obesity-abdominal obesity High blood pressure 1 1.018 (0.632∼1.639) 0.814 (0.279∼2.378) 1.326 (0.882∼1.993) Low HDL-cholesterol 1 1.576 (1.006∼2.469) 0.864 (0.301∼2.486) 1.882 (1.266∼2.799) Elevated fasting glucose 1 1.111 (0.593∼2.081) 1.312 (0.363∼4.741) 1.677 (0.997∼2.819) High triglyceride 1 1.380 (0.845∼2.255) 1.671 (0.609∼4.587) 1.904 (1.246∼2.910) Metabolic syndrome 1 1.000 (0.422∼2.372) 6.579 (2.233∼19.385) 10.638 (6.053∼18.697) Calculated by logistic regression.
Values are presented as odds ratio (95% confidence interval).
Abbreviation: HDL, high density lipoprotein.
대사증후군은 이상지질혈증, 고혈압, 내당능장애 및 비만과 같 은 제2형 당뇨병과 심혈관질환의 위험인자가 한 개인에게 함께 나 타나는 증후군으로 발생기전은 명확하지 않았으나 인슐린 저항성 이 핵심적인 역할을 하는 것으로 알려져 있다[1,2]. 대사증후군 위 험요인 중 비만은 체지방이 증가하면서 인슐린 감수성이 감소되고, 특히 복부비만은 세포가 혈액으로부터 포도당을 흡수하는 능력이 저하되는 포도당 불내성(glucose intolerance)과 관련이 있다 [2,3]. 최근 식습관의 변화로 인해 에너지 섭취량은 증가하고 신체 활동량은 감소하면서 비만 유병률은 점차 증가하고 있으며, 비만이 만성 질환의 위험요인으로 인식되고 있다[27].
현재 비만을 측정하는 가장 보편적이고 간편한 방법으로 체질량 지수가 이용되고 있으며, 세계보건기구에서는 체질량지수를 기준 으로 비만을 분류하여 제시하고 있다[20]. 그러나 최근 비만을 평가 하는데 단순히 체지방 양 뿐만 아니라 체지방 분포의 중요성이 인 식되면서 복부비만을 평가하는 허리둘레가 체질량지수와 함께 비 만관련 질환의 위험 예측인자로 사용되고 있다[22]. 여성에 있어서 복부비만은 인슐린저항성과 고인슐린혈증, 고중성지방혈증, 고혈 압, 내당능장애와 관련이 있는 것으로 보고된다[28]. 특히 노인비 만의 경우 체질량지수가 정상이더라도 복부비만인 경우가 성인보 다 높은 빈도로 나타나고 이러한 특성은 심혈관질환 및 대사증후군
의 발병 위험의 증가와 관련이 있어, 단순비만 측정보다 복부의 체 지방 분포에 대한 관심이 높아지고 있다[29]. 이에 따라 2001년 미 국 국립 콜레스테롤 교육 프로그램 제 3차 개정(National Cholesterol Education Program Adult Treatment Panel III, NCEP-ATP III) 에서는 허리둘레를 복부비만 진단기준에 포함시켰으며, 2005년 세계 당뇨병 연맹(International Diabetes Federation, IDF)에서 도 복부비만을 대사증후군 진단기준의 필수 요소로 설정하고 허리 둘레를 이용하여 복부비만을 측정하고 있다[22,30].
본 연구결과 단순비만군, 복부비만군보다 비만-복부비만군에 서 중성지방, HbA1c, 인슐린이 가장 높게 나타났으며, HDL-콜레 스테롤은 비만-복부비만군에서 가장 낮게 나타났다. 또한 비만-복 부비만군에서 대사증후군 위험요인 중 낮은 HDL-콜레스테롤혈 증, 고중성지방혈증, 복부비만의 빈도가 높았으며, 그에 따른 대사 증후군 유병률은 높은 빈도를 보였다. 대사증후군 위험요인의 개수 가 적을수록 단순비만군의 비율이 높았으며, 위험요인의 개수가 증 가할수록 복부비만군, 비만-복부비만군의 비율이 높게 나타났다.
허리둘레는 비만과 관련된 만성질환의 독립적 예측인자이며, 체 질량지수보다 관상동맥질환과 더 관련이 있다고 보고된다[31].
Janssen 등[32]은 미국 국민건강영양조사(Third National Health and Nutrition Examination Survey, NHANES III) 자료를 토대로
복부비만군에서 고혈압, 당뇨병, 이상지질혈증과 대사증후군 발병 위험이 높으며, 특히 복부비만은 남성보다는 여성에게 큰 영향을 미치는 것으로 보고하였다. 또한 체질량지수와는 무관하게 허리둘 레 측정만으로도 비만뿐 아니라 심혈관질환을 예측할 수 있다는 결 과가 보고되고 있으나[31], 본 연구결과는 노인여성에서 단순비만 측정보다는 체질량지수와 허리둘레를 모두 측정하는 것이 대사증 후군 위험을 좀 더 효과적으로 반영하는 것으로 나타났다. 복부비 만 기준에 따른 비만유형과 대사증후군 각각의 위험요인 및 대사증 후군 진단간의 관련성을 분석한 본 연구결과, 낮은 HDL-콜레스테 롤혈증은 정상군보다 단순비만군에서 1.6배 높은 발병률을 보였으 며, 비만-복부비만군에서는 1.9배 높은 양상을 보였다. 고중성지 방혈증은 정상군보다 비만-복부비만군에서 1.9배 높았다. 대사증 후군 발병은 정상군보다 복부비만군에서 6.6배 높았으며, 비만-복 부비만군의 경우 10.6배 높은 양상을 보였다. 이는 이율의 등[33]
의 연구에서 대사증후군 위험도가 체질량지수 측정군인 단순비만 군보다 복부비만군과 비만-복부비만군에서 높게 나타난 연구결과 와 일치한다.
노인여성은 폐경에 따른 에스트로겐 감소로 지방대사에 변화가 나타나며, 에스트로겐이 둔부와 대퇴부에 지방을 축적시켰던 폐경 전과 달리 폐경후에는 체내 지방의 재분포로 복부비만 및 복부 내 장형 비만이 가속화 된다[7-11]. 복부비만은 하체비만에 비해 혈중 중성지방 및 콜레스테롤은 높고, HDL-콜레스테롤은 낮은 것으로 보고된다[34]. 또한 복부비만은 내장지방의 과잉축적을 잘 반영하 는 지표이다[34]. 내장지방은 혈중 중성지방을 증가시키며, 간에서 의 초저밀도 지단백(very low density lipoprotein, VLDL) 및 인슐 린저항성 증가로 인해 혈액내 중성지방의 유리가 증가되어 결국 지 방산의 증가가 나타난다[35]. 그러므로 만성질환을 유발하는 비만 을 구분하는 기준은 단순히 형태학적 문제에 국한된 것이 아니라 대사이상을 반영하는 결과이다. 본 연구에서 대사증후군 위험요인 에 허리둘레가 포함되어 있어 나타난 결과라고는 하지만, 노인여성 에서 단순비만군보다 복부비만 혹은 비만-복부비만군에 해당하는 경우 대사증후군 발병 위험이 높게 나타나 복부비만은 대사증후군 위험도 예측에 강력한 지표로 사용될 수 있을 것으로 생각된다[33].
여성노인은 남성에 비해 두 배 가량 높은 복부비만 유병률을 보 이고 있으며[6], 비만과 관련된 만성질병을 관리하는데 적절한 비 만 측정지표를 선택하여 사용하는 것이 노인여성의 건강관리에 효 과적일 것으로 생각된다[34]. 결론적으로 본 연구결과에서 노인여 성에서 단순비만 측정보다는 체질량지수와 허리둘레를 모두 측정 하는 것이 대사증후군 위험을 좀 더 효과적으로 반영하는 것으로
나타났으며, 대사증후군 발병은 단순비만군보다 복부비만군과 비 만-복부비만군에서 높게 나타났다.
본 연구의 제한점은 노인여성을 대상으로 하였으므로 그 외의 대상자에게 결과를 적용하기 곤란하다. 또한 일상적인 신체활동 및 식이조절이나 식사의 질 평가와 같은 혼란변수에 대한 평가가 이루 어지지 못했다는 점이다. 그럼에도 불구하고 본 연구를 통해 노인 여성에서 체질량지수와 허리둘레를 모두 평가하는 것이 인슐린 저 항성을 포함한 대사증후군 위험을 예측하는 지표로 활용될 수 있을 것으로 사료된다.
요 약
이 연구는 노인여성을 대상으로 비만, 복부비만 기준에 따른 대 사증후군 위험요인의 차이를 알아보고, 비만 유형과 대사증후군 위 험요인과의 관련성을 규명하고자 하였다. 비만 기준은 세계보건기 구 아시아 태평양 기준에서 제시한 비만 기준을 따랐으며, 대사증 후군은 The National Cholesterol Education Program Adult Treatment Panel III (NCEP-ATP III)의 진단기준에 따라 분류하 였다. 연구 대상자 591명 중 정상군 272명, 단순비만군 124명, 복 부비만군 19명, 비만-복부비만군 176명 이었다. 비만, 복부비만 기준에 따른 대사증후군 위험요인의 유병률 차이를 비교한 결과 낮은 HDL-콜레스테롤혈증(
p
=0.009), 고중성지방혈증(p
=0.025), 복부비 만(p
<0.001), 대사증후군 진단 유병률(p
<0.001)은 집단간 차이 를 보였으며, 비만-복부비만군에서의 유병률이 높게 나타났다. 로 지스틱 회귀분석을 통해 복부비만 기준에 따른 비만유형과 대사증 후군 각각의 위험요인 및 대사증후군 진단간의 관련성을 분석한 결 과, 정상군에 비해 단순비만군에서 낮은 HDL-콜레스테롤혈증의 발생이 1.6배 높았으며(odds ratio, OR: 1.576, 95% confidence interval, 95% CI: 1.006∼2.469), 비만-복부비만군에서는 1.9배 높은 양상을 보였다(OR: 1.882, 95% CI: 1.266∼2.799). 고중성 지방혈증은 정상군보다 비만-복부비만군에서 1.9배 높았다(OR:1.904, 95% CI: 1.246∼2.910). 또한 정상군보다 복부비만군에서 대사증후군 발생이 6.6배 높았으며(OR: 6.579, 95% CI: 2.233∼
19.385), 비만-복부비만군의 경우 10.6배 높은 양상을 보였다 (OR: 10.638, 95% CI: 6.053∼18.697).
Acknowledgements: None Funding: None
Conflict of interest: None
References