Biomedical Science Letters 2017, 23(2): 57~63 http://dx.doi.org/10.15616/BSL.2017.23.2.57 eISSN : 2288-7415
Body Adiposity Index and Metabolic Syndrome Risk Factors in Korean Adults:
A Comparison with Body Mass Index and Other Parameters
Kyung-A Shin1, Seung Bok Hong2 and Kyeong Seob Shin3,†
1Department of Clinical Laboratory Science, Shinsung University, Dangjin 31801, Korea
2Department of Clinical Laboratory Science, Chungbuk Health & Science University, Cheongju 28150, Korea
3Department of Laboratory Medicine, Chungbuk National University College of Medicine, Cheongju 28644, Korea
A new body adiposity index (BAI) has been proposed that is expected to replace body mass index (BMI). We evaluated the correlations between metabolic syndrome risk factors and BAI, BMI, and other adiposity indices, such as waist circumference (WC), waist-to-hip ratio (WHR), and waist-to-height ratio (WHtR), by sex in the Korean population. We also evaluated whether BAI would be useful to diagnose metabolic syndrome. A total of 20,961 Korean adults who underwent health examinations were included in this study. The metabolic syndrome diagnostic criteria used in this study were those set by the American Heart Association/National Heart, Lung, and Blood Institute (AHA/NHLBI). In men (12,719), BMI and WHtR were more strongly correlated to metabolic syndrome risk than BAI, and in women (8,242), WHtR showed the strongest association with metabolic syndrome risk. BAI (area under the curve [AUC] = 0.678) presented lower discriminatory capacity than that of BMI (AUC = 0.836) for diagnosing metabolic syndrome. Moreover, BAI underestimated fat levels in men and women when considering the ability to discriminate overweight and obese individuals. In conclusion, WHtR and BMI in men, and WHtR in women may be better candidates than BAI to evaluate metabolic risk factors in Korean adults.
Key Words: Body adiposity index, Body mass index, Metabolic syndrome, Obesity, Korean
INTRODUCTION
Obesity is a risk factor for many chronic diseases and has become a serious health problem worldwide. Obesity also accompanies metabolic abnormalities, such as hyper- tension, insulin resistance syndrome, hyperglycemia, and dyslipidemia (Björntorp et al., 1991; Grundy et al., 2005;
Villareal et al., 2005; Kang et al., 2016). Body mass index (BMI) has been used as a measure of adiposity but is con- sidered rather inaccurate (Jackson et al., 2002; Garrido-
Chamorro et al., 2009; Camhi et al., 2011). A new adiposity index called body adiposity index (BAI) has been purposed as a substitute for BMI. BAI measures body fat using height and hip circumference (HC) but not weight (Bergman et al., 2011). BAI can be applied to adults of all races without numerical correction. Studies on African Americans and Mexican Americans have shown that the correlation of BAI (0.79) was higher than the one between BMI and body fat measured using dual-energy X-ray absorptiometry (DXA) when men (r=0.72) and women (r=0.76) were considered (Bergman et al., 2011). HC reflects sex differences very well
Original Article
*Received: March 12, 2017 / Revised: April 28, 2017 / Accepted: May 12, 2017
†Corresponding author: Kyeong Seob Shin. Department of Laboratory Medicine, Chungbuk National University College of Medicine, Cheongju 28644, Korea.
Tel: +82-43-269-6240, Fax: +82-43-271-5243, e-mail: [email protected]
○CThe Korean Society for Biomedical Laboratory Sciences. All rights reserved.
○CCThis is an Open Access article distributed under the terms of the Creative Commons Attribution Non-Commercial License (http://creativecommons.org/licenses/by-nc/3.0/) which permits unrestricted non-commercial use, distribution, and reproduction in any medium, provided the original work is properly cited.
when used to measure adiposity, and BAI reflects adiposity more than that of BMI, which does not consider differences between men and women (Bergman et al., 2011; López et al., 2012). In addition, BAI is related to cardiovascular disease risk factors, but BMI is a better index than BAI when cardiovascular disease risk is determined (Lichtash et al., 2013). BAI is useful in many ethnic groups, but not Asians. Therefore, this study examined the relationships between metabolic syndrome risk factors by sex and adi- posity indices, including BAI and BMI, in Korean adults.
We also evaluated the utility of BAI and BMI for diagnosing metabolic syndrome.
The aim of this study was to evaluate the correlations between metabolic syndrome risk factors and BAI, BMI, and other adiposity indices, such as waist circumference (WC), waist-to-hip ratio (WHR), and waist-to-height ratio (WHtR) by sex in Korean adults.
MATERIALS AND METHODS Study subjects
This study was carried out on 20,961 Korean adults (age, 20~79 years) who underwent health examinations at J General Hospital, Gyeonggi province, South Korea from January 2010 through December 2012. Metabolic syndrome was diagnosed using the American Heart Association/
National Heart, Lung, and Blood Institute (AHA/NHLBI) criteria as follows: 1) triglycerides ≥ 150 mg/dL or taking medicine for hypertriglyceridemia, 2) high density lipopro- tein cholesterol (HDL-C) < 40 mg/dL in men and < 50 mg/
dL in women, 3) blood pressure ≥ 130/85 mmHg or taking medicine for hypertension, 4) fasting glucose ≥ 100 mg/dL or taking a hypoglycemic agent, and 5) WC ≥ 90 cm in men and ≥ 80 cm in women, according to the World Health Organization (WHO) Asia-Pacific criteria [WHO, 2004a].
Metabolic syndrome was diagnosed when three of these five criteria were met (Grundy et al., 2005). This study was approved by the Institutional Review Board of J General Hospital and was carried out with approval of the participants after the methods and procedures were explained.
Anthropometric measurements and calculations Systolic and diastolic blood pressure was determined using a mercury sphygmomanometer after the subject rested for 10 min in a sitting position. Body weight was measured to the nearest 0.1 kg using an electronic scale. Height was measured to the nearest 0.1 cm using a stadiometer. BMI was calculated as weight (kg) divided by height (m) squared (kg/m2). WC and HC were measured using a tape at the point midway between the lateral lower rib and iliac crest and at the level of the trochanters (± 0.1 cm), with the feet 20~30 cm apart to make weight even and while the subject exhaled. The WHR was calculated as WC divided by HC, and the WHtR was calculated by dividing WC by height (cm). BAI was calculated using Bergnam's formula: (hip circumference)/(height)1.5 - 18. BMI was divided into four categories: underweight (< 18.5 kg/m2), ideal weight (18.5~
22.9 kg/m2), overweight (23~24.9 kg/m2), and obese (> 25 kg/m2) (James, 2004; WHO expert, 2004b; Kor Endoc Soc., 2010). The BAI categories were: underweight, ideal weight, overweight, and obese, according to criteria from Gallagher et al. (Gallagher et al., 2000).
Laboratory evaluation
Venous blood was taken from the antecubital vein with EDTA anticoagulant to obtain whole blood and without anticoagulant to obtain serum. Blood samples were taken following a 12 h overnight fast, and serum was collected after centrifugation. Blood was stored at -20℃, and the analyses were performed within one day. Total cholesterol, triglycerides, HDL-C, low density lipoprotein cholesterol (LDL-C), fasting glucose, uric acid, and high sensitivity C- reactive protein (hs-CRP) were measured using an auto- matic TBA-200FR NEO chemical analyzer (Toshiba, Tokyo, Japan). Glycated hemoglobin (HbA1C) was measured by high performance liquid chromatography using a Variant II system (Bio-Rad, Hercules, CA, USA). Insulin was meas- ured by an electrochemiluminescence immunoassay using a Modular Analytics E170 (Roche, Basel, Switzerland).
Statistical analysis
Statistical analysis was carried out using SPSS statistics
21.0 software (SPSS/IBM, Chicago, IL, USA). Results are expressed as the mean ± standard deviation or percentages.
The unpaired Student's t-test was used to evaluate differences in anthropometric and biochemical characteristics between sexes (Table 1). The difference in the prevalence of meta- bolic syndrome between sexes was assessed with the χ2 test.
Bivariate correlations between parameters, such as BAI, BMI, WC, WHR, WHtR, and metabolic risk factors were ascertained by Pearson's or Spearman's correlation analyses.
Receiver operating characteristic (ROC) curves were used to determine the discriminatory capacities of BMI and BAI for metabolic syndrome. Cutoff values were derived mathe- matically from ROC curves. A P value < 0.05 was considered significant.
RESULTS
Age and anthropometric characteristics of the participants categorized by sex are shown in Table 1. Significantly higher weight, height, BMI, WC, HC, BMI, WHR, and WHtR values were detected in men compared to women. Women had a higher BAI than that of men. Men had significantly higher systolic and diastolic pressures than those of women.
Men presented with significantly higher total cholesterol, LDL-C, triglycerides, insulin, HbA1C, uric acid, and hs- CRP values than women, whereas HDL-C was higher in women. The prevalence of metabolic syndrome was signifi- cantly higher in men (11.84%) than in women (6.78%) using Table 1. Anthropometric characteristics and biochemical blood parameters in the this study
Variables All
(n=20,961) Men
(n=12,719) Women
(n=8,242) P value
Age (years) 45.72±11.22 46.08±10.97 45.16±11.58 <0.001
Weight (kg) 66.29±12.19 72.49±10.24 56.73±8.07 <0.001
Height (cm) 166.38±8.76 171.36±6.37 158.70±5.94 <0.001
Waist circumference (cm) 79.55±9.35 83.77±7.62 73.05±7.95 <0.001
Hip circumference (cm) 93.46±6.01 95.01±5.73 91.07±5.63 <0.001
BMI (kg/m2) 23.83±3.22 24.65±2.94 22.55±3.23 <0.001
BAI (kg/m2) 25.69±3.53 24.41±2.83 27.66±3.59 <0.001
WHR 0.85±0.88 0.88±0.59 0.80±0.10 <0.001
WHtR 0.47±0.05 0.48±0.04 0.46±0.05 <0.001
Systolic BP (mmHg) 109.53±14.16 112.76±13.12 104.54±14.26 <0.001
Diastolic BP (mmHg) 70.48±10.41 72.94±9.89 66.72±9.82 <0.001
Total cholesterol (mg/dL) 193.05±34.01 195.21±34.06 189.70±33.66 <0.001 HDL cholesterol (mg/dL) 55.91±13.44 52.00±11.89 62.01±13.45 <0.001
LDL cholesterol (mg/dL) 118.37±30.96 121.94±30.61 112.88±30.70 <0.001
Triglyceride (mg/dL) 123.12±84.01 144.28±92.03 90.44±55.84 <0.001
Fasting glucose (mg/dL) 90.54±18.58 92.74±20.58 87.16±14.32 <0.001
Insulin (μU/mL) 4.88±3.05 5.19±3.23 4.52±2.79 <0.001
HbA1C (%) 5.60±0.70 5.66±0.77 5.51±0.57 <0.001
Uric acid (mg/dL) 5.31±1.46 6.03±1.28 4.21±0.95 <0.001
hs-CRP (mg/dL) 0.26±0.58 0.27±0.63 0.25±0.47 0.024
MetS AHA/NHLBI (%) 9.85 11.84 6.78 <0.001
Values are means ± SD.
Abbreviations: BMI, body mass index; BAI, body adiposity index; WHR, waist hip ratio; WHtR, waist height ratio; BP, blood pressure;
HDL, high density lipoprotein; LDL, low density lipoprotein; hsCRP, high sensitivity C-reactive protein; MetS, metabolic syndrome;
AHA/NHLBI, American Heart Association/National Heart, Lung, and Blood Institute.
the AHA/NALBI criteria.
The prevalence of obesity in the entire cohort was 34.53%
(43.4% in men and 20.72% in women) using BMI ≥ 25 kg/m2 and 4.26% (6.9% in men and 0.2% in women) using the BAI classification. Figures 1 and 2 compare the pre- valence rates of overweight and obesity in men and women using the BMI and BAI categories. Overweight men were classified as heavier when they were assessed with BAI, whereas obese men were heavier when checked with BMI (Fig. 1). In addition, the overweight and obese groups of women were classified as heavier when they were checked with BMI (Fig. 2). Tables 2 and 3 show the relationships between the anthropometric variables and metabolic syn-
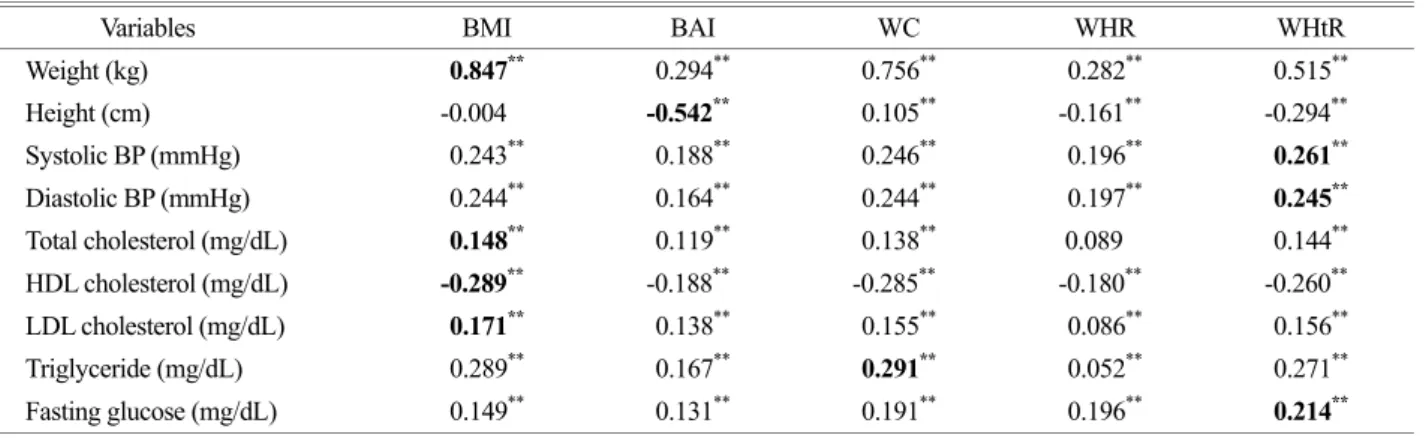
drome risk factors in men and women, respectively. BMI was most strongly associated with weight, total cholesterol, HDL-C, and LDL-C (P < 0.001). WC was most strongly associated with triglycerides (P < 0.001). WHtR was most strongly associated with systolic and diastolic blood pres- sures and fasting glucose (P < 0.001). In women, BMI was most strongly associated with weight (P < 0.001), and WC was most strongly associated with HDL-C (P < 0.001).
WHtR was most strongly correlated with systolic and dia- stolic blood pressures, total cholesterol, HDL-C, LDL-C, triglycerides, and fasting glucose (P < 0.001). However, BAI was most strongly associated with only height in men and women (P < 0.001). The areas under the curve (AUC) for
Table 2. Correlation between anthropometric parameters and metabolic syndrome risk factors in men
Variables BMI BAI WC WHR WHtR
Weight (kg) 0.847** 0.294** 0.756** 0.282** 0.515**
Height (cm) -0.004 -0.542** 0.105** -0.161** -0.294**
Systolic BP (mmHg) 0.243** 0.188** 0.246** 0.196** 0.261**
Diastolic BP (mmHg) 0.244** 0.164** 0.244** 0.197** 0.245**
Total cholesterol (mg/dL) 0.148** 0.119** 0.138** 0.089 0.144**
HDL cholesterol (mg/dL) -0.289** -0.188** -0.285** -0.180** -0.260**
LDL cholesterol (mg/dL) 0.171** 0.138** 0.155** 0.086** 0.156**
Triglyceride (mg/dL) 0.289** 0.167** 0.291** 0.052** 0.271**
Fasting glucose (mg/dL) 0.149** 0.131** 0.191** 0.196** 0.214**
**P < 0.001.
Abbreviations: See Table 1
Fig. 2. Distribution (%) of women in BAI and BMI categories.
See Table 1 for abbreviations.
Fig. 1. Distribution (%) of men in BAI and BMI categories. See Table 1 for abbreviations.
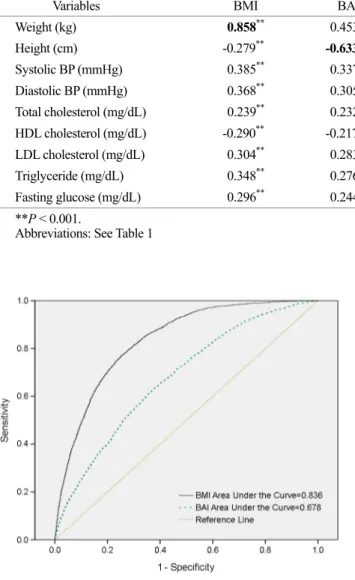
BAI and BMI were 0.678 (95% confidence interval [CI], 0.667~0.690) and 0.836 (95% CI, 0.827~0.844), respec- tively, to compare the discriminatory capacity of BAI and BMI for diagnosing metabolic syndrome using the AHA/
NALBI criteria. When metabolic syndrome was diagnosed using BMI, the cut-off value was 25.3, sensitivity was 76.56% (95% CI, 74.7~78.4%), and specificity was 74.98%
(95% CI, 74.4~75.6%) (Fig. 3).
DISCUSSION
This is one of the first studies in Korean adults to evaluate the applicability of BAI as a method to determine metabolic risk factors by comparing BMI, WC, WHR, and WHtR. Our results show that BAI does not overcome the limitations of BMI and other adiposity indices. Moreover, BAI showed less utility to aid in a diagnosis of metabolic syndrome than that of BMI and WHtR in Korean adults.
BMI, which is directly proportional to weight, is the most widely used adiposity index, even though it does not dis- tinguish differences by age and sex and is not useful for athletes who have more muscle mass or in children (Gallaher et al., 1996; Jackson et al., 2002). Bergman et al. proposed the use of BAI to compensate for the limitations of BMI (Bergman et al., 2011). BAI measures body fat percentage using height and HC. In particular, BAI can assess obesity without determining weight and is highly associated with body fat results determined by DXA. However, these studies were carried on African Americans and Mexican Americans only, not Asians. HC shows a sex difference in adiposity more than that of BMI, whereas BAI, which uses HC, is expected to be a better index to predict male and female body fat (Bergman et al., 2011). Some studies have reported that BAI is associated with cardiovascular and metabolic syndrome risk factors (Schulze et al., 2012; Elisha et al., 2013; Freedman et al., 2013; Choi, 2015), but they also Table 3. Correlation between anthropometric parameters and metabolic syndrome risk factors in women
Variables BMI BAI WC WHR WHtR
Weight (kg) 0.858** 0.453** 0.729** 0.221** 0.567**
Height (cm) -0.279** -0.633** -0.197** -0.206** -0.485**
Systolic BP (mmHg) 0.385** 0.337** 0.385** 0.208** 0.415**
Diastolic BP (mmHg) 0.368** 0.305** 0.356** 0.185** 0.374**
Total cholesterol (mg/dL) 0.239** 0.232** 0.239** 0.130** 0.266**
HDL cholesterol (mg/dL) -0.290** -0.217** -0.304** -0.161** -0.304**
LDL cholesterol (mg/dL) 0.304** 0.283** 0.310** 0.166** 0.337**
Triglyceride (mg/dL) 0.348** 0.276** 0.368** 0.213** 0.383**
Fasting glucose (mg/dL) 0.296** 0.244** 0.308** 0.181** 0.319**
**P < 0.001.
Abbreviations: See Table 1
Fig. 3. ROC curve analysis of BAI and BMI for diagnosis of meta- bolic syndrome by AHA/NHLBI. Abbreviations: ROC; receiver operating characteristic, BAI; body adiposity index, BMI; body mass index.
reported that BMI is a better index than BAI when cardio- vascular risk is verified. Therefore, additional investigations on the clinical usefulness of BAI are needed (Bennasar-Veny et al., 2013; Lichtash et al., 2013). Another study reported that WC, which is representative of abdominal adiposity, is more related to cardiovascular risk factors than BMI. The default measure is BMI, which cannot distinguish fat from muscle (Freedman et al., 2012; de Lima et al., 2012). In our study, BMI and the WHtR in males were more strongly associated with metabolic syndrome risk factors than BAI, whereas the WHtR in females was more strongly associated with metabolic syndrome risk factors than BAI. The WHtR is highly associated with the Framingham and REGICOR (Registre Gironí del Cor, Heart Register of Girona) indices, which are criteria for cardiovascular risk (Bennasar-Veny et al., 2013; Melmer et al., 2013). Therefore, the WHtR is expected to be useful as an adiposity index to predict factors associated with metabolic syndrome. Our results show that the AUC of BMI was higher and its discriminatory capacity was higher than that of BAI according to the AHA/NHLBI criteria. BAI is a convenient index for assessing adiposity in men and women without a scale. However, it was not developed to predict cardiovascular and metabolic syndrome risk factors. Therefore, using BAI as a single index to predict the risk for metabolic syndrome should be carefully con- sidered.
Bennasar-Veny et al. (2013) reported that BAI overesti- mates fat levels in Caucasian men, whereas it classifies >
80% of Caucasian women as normal weight. That is, BAI underestimates fat levels in women. These results demon- strate that BAI overestimates overweight in men compared to BMI, whereas obese men are classified as lighter than when using BMI. BAI classifies > 95% of women as an ideal weight. Thus, BAI underestimates fat levels in men and women. In addition, BAI is reportedly useful for different ethnic groups (Bergman et al., 2011). However, our results and those of Bennasar-Veny et al. (2013) show differences in overweight and obesity rates in men. Thus, it appears that the BAI criteria should be applied based on ethnic group.
In particular, when adiposity is checked using the recom- mended cut-off levels, BAI classifies most females at an ideal weight, indicating that BAI has low sensitivity and
specificity. The present study was a cross-sectional retro- spective study on Korean adults; thus, these results should not be applied to children or other ethnic groups.
In conclusion, although some authors have reported that BAI is a good tool to assess obesity in Caucasian popu- lations and suggested that it is more practical and easier to use than other adiposity indices, it does not overcome the limitations of BMI and is not a good measure of metabolic risk in the Korean population. Therefore, BAI is less useful than BMI and other adiposity indices, such as the WHtR, the WHR, and WC. These indices may be better candidates for clinical use and to evaluate metabolic syndrome risk factors.
CONFLICT OF INTEREST
The authors have no conflicts of interest to disclose.
REFERENCES
Bennasar-Veny M, Lopez-Gonzalez AA, Tauler P, Cespedes ML, Vicente-Herrero T, Yañez A, Tomas-Salva M, Agquilo A.
Body adiposity index and cardiovascular health risk factors in Caucasians: a comparison with the body mass index and others. Public Library of Science One. 2013. 8: e63999.
Bergman RN, Stefanovski D, Buchanan TA, Sumner AE, Reynolds JC, Sebring NG, Xiang AH, Watanabe RM. A better index of body adiposity. Obesity. 2011. 19: 1083-1089.
Björntorp P. Metabolic implications of body fat distribution. Dia- betes Care 1991. 14: 1132-1143.
Camhi SM, Bray GA, Bouchard C, Greenway FL, Johnson WD, Newton RL, Ravussin E, Ryan DH, Smith SR, Katzmarzyk PT.
The relationship of waist circumference and BMI to visceral, subcutaneous, and total body fat: sex and race differences.
Obesity. 2011. 19: 402-408.
Choi SY. The characteristics of electrocardiography findings in left ventricular remodeling patterns of hypertensive patients.
Biomedical Science Letters. 2015. 21: 208-217.
de Lima JG, Nóbrega LH, de Souza AB. Body adiposity index indicates only total adiposity, not risk. Obesity. 2012. 20: 1140.
Elisha B, Rabasa-Lhoret R, Messier V, Abdulnour J, Karelis AD.
Relationship between the body adiposity index and cardio- metabolic risk factors in obese postmenopausal women.
European Journal of Nutrition. 2013. 52: 145-151.
Freedman DS, Thornton JC, Pi-Sunyer FX, Heymsfield SB, Wang J, Pierson RN Jr, Blanck HM, Gallgher D. The body adiposity index (hip circumference ÷ height(1.5)) is not a more accu- rate measure of adiposity than is BMI, waist circumference, or hip circumference. Obesity. 2012. 20: 2438-2444.
Freedman DS, Blanck HM, Dietz WH, DasMahapatra P, Srinivasan SR, Berenson GS. Is the body adiposity index (hip circum- ference/height(1.5)) more strongly related to skinfold thick- nesses and risk factor levels than is BMI? The Bogalusa Heart Study. Brithish Journal of Nutrition 2013. 109: 338-345.
Gallagher D, Visser M, Sepúlveda D, Pierson RN, Harris T, Heymsfield SB. How useful is body mass index for com- parison of body fatness across age, sex, and ethnic groups?
American Journal of Epidemiology. 1996. 143: 228-239.
Gallagher D, Heymsfield SB, Heo M, Jebb SA, Murgatroyd PR, Sakamoto Y. Healthy percentage body fat ranges: an approach for developing guidelines based on body mass index. American Journal of Clinical Nutrition. 2000. 72: 694-701.
Garrido-Chamorro RP, Sirvent-Belando JE, Gonzalez-Lorenzo M, Martin-Carratala ML, Roche E. Correlation between body mass index and body composition in elite athletes. The Journal of Sports Medicine and Physical Fitness. 2009. 49: 278-284.
Grundy SM, Cleeman JI, Daniels SR, Donato KA, Eckel RH, Franklin BA, Gordon DJ, Krauss RM, Savage PJ, Smith SC Jr, Spertus JA, Fernado Costa. Diagnosis and management of the met-a bolic syndrome: and American Heart Association/
National Heart, Lung, and Blood Institute Scientific Statement.
Circulation. 2005. 112: 2735-2753.
Jackson AS, Stanforth PR, Gagnon J, Rankinen T, Leon AS, Rao DC, Skinner JS, Bouchard C, Willmore JH. The effect of sex, age and race on estimating percentage body fat from body mass index: The Heritage Family Study. International Jounral of Obesity Related Metabolic Disorder. 2002. 26: 789-796.
James PT. Obesity: the worldwide epidemic. Clinical Dermatology.
2004. 22: 276-280.
Kang YJ, Park SN. The association between social support and impaired fasting glucose and type 2 diabetes. Biomedical Science Letters. 2016. 22: 189-198.
Korean Endocrine Society, Korean Society for the Study of Obesity.
Management of obesity, 2010 recommendation. Endocrin- ology and Metabolism. 2010. 25: 301-304.
Lichtash CT, Cui J, Guo X, Chen YD, Hsueh WA, Rotter JI, Goodarzi MO. Body adiposity index versus body mass index and other anthropometric traits as correlates of cardiometabolic risk factors. Public Library of Science One. 2013. 8: e65954.
López AA, Cespedes ML, Vicente T, Tomas M, Bennasar-Veny M, Tauler P, Aguilo A. Body adiposity index utilization in a Spanish Mediterranean population: comparison with the body mass index. Public Library of Science One. 2012. 7: e35281.
Melmer A, Lamina C, Tschoner A, Ress C, Kaser S, Laimer M.
Body adiposity index and other indexes of body composition in the SAPHIR study: association with cardiovascular risk factors. Obesity. 2013. 21: 775-781.
Schulze MB, Thorand B, Fritsche A, Häring HU, Schick F, Zierer A, Rathmann W, Kroger J, Peters A, Boeing H, Stefan N. Body adiposity index, body fat content and incidence of type 2 dia- betes. Diabetologia. 2012. 55: 1660-1667.
Villareal DT, Apovian CM, Kushner RF, Klein S; American Society for Nutrition; NAASO, The Obesity Society. Obesity in older adults: technical review and position statement of the American Society for Nutrition and NAASO, The Obesity Society. American Journal of Clinical Nutrition. 2005. 82:
923-934.
Western Pacific Regional Office of the World Health Organization.
The International Obesity Task Force. The Asia-Pacific per- spective: redefining obesity and its treatment. 2000.
WHO Expert Consultation. Appropriate body-mass index for Asian populations and its implications for policy and intervention strategies. Lancet. 2004. 363: 157-163.
http://dx.doi.org/10.15616/BSL.2017.23.2.57
Cite this article as: Shin KA, Hong SB, Shin KS.
Body Adiposity Index and Metabolic Syndrome Risk Factors in Korean Adults: A Comparison with Body Mass Index and Other Parameters. Biomedical Science Letters. 2017. 23: 57-63.