http://e-nrp.org
Three clustering patterns among metabolic syndrome risk factors and their associations with dietary factors in Korean adolescents:
based on the Korea National Health and Nutrition Examination Survey of 2007-2010
Yeon Yu and YoonJu Song§
Major of Food and Nutrition, School of Human Ecology, The Catholic University of Korea, 43 Jibong-ro, Wonmi-gu Bucheon, Gyeonggi 420-743, Korea
BACKGROUND/OBJECTIVE: Even though the prevalence of metabolic syndrome in adolescents is increasing, little is presently known about this syndrome in adolescents. This study aimed to cluster metabolic risk factors as well as examine the associations between identified patterns and nutrient intake using data from the Korean National Health Examination and Nutritional Assessment (KNHANES).
SUBJECTS/METHODS: A total of 2,958 subjects aged 10 to 18 years along with both biochemical and dietary data information were obtained from KNHANES 2007-2010. Six components of metabolic syndrome were used to identify any patterns via factor analysis. Individuals were categorized into quartile groups according to their pattern score.
RESULTS: Three clustering patterns with high loadings were identified and named as follows: 1) high blood pressure, 2) dyslipidemia, and 3) glucose abnormality patterns. The high blood pressure pattern showed high loadings of systolic and diastolic blood pressures, the dyslipidemia pattern showed high loadings of triglyceride and HDL-cholesterol levels, and the glucose abnormality pattern showed high loadings of fasting blood glucose levels. Intakes of fat and riboflavin were significantly decreased, whereas those of sodium and niacin were significantly increased across the quartiles in the dyslipidemia pattern. No nutrient intake except that of thiamin was significantly associated with the high blood pressure or glucose abnormality pattern.
CONCLUSION: Our findings show that metabolic syndrome risk factors in the Korean adolescent population are characterized by three distinct patterns, which are differentially associated with dietary factors. Characterizing metabolic risk factors and providing specific dietary guidelines for target groups are important.
Nutrition Research and Practice 2015;9(2):199-206; doi:10.4162/nrp.2015.9.2.199; pISSN 1976-1457 eISSN 2005-6168 Keywords: Adolescents, metabolic syndrome, factor analysis, carbohydrate intake
INTRODUCTION14)
A well-balanced diet is necessary for adolescents due to their rapid growth and physical maturation [1]. The dietary habits established during adolescence continue to track into adulthood, and establishing desirable dietary habits is very important to ensure high public health. However, rapid economic growth and Western lifestyle adoption over the last decade in Korea have led to changes in dietary habits, such as frequent dining out and fast food consumption, especially among adolescents.
According to the Korean National Health Examination and Nutrition Survey (KNHANES) in 2012, the percentage of those aged 12-19 years who dined out at least once per day or skipped breakfast was 36.7% and 27.6%, respectively, and these percentages were higher than those in the adult population.
Furthermore, the percentages of those consuming carbonated drinks and fast food more than three times per week were as high as 26.3% and 12.3%, respectively. American children and adolescents in a Minnesota study reported similar trends, in that consumption of soft drinks and fast food increased while that of fruits, vegetables, or milk decreased [2], and their preference for fast food or soft drinks led to nutritional imbalances [3].
These undesirable dietary habits affect the health status of adolescents.
Overweight and obesity in adolescents are serious health issues [4], and the prevalence of these disorders has increased rapidly around the world [5]. In addition, 70% of adolescents with obesity eventually become obese adults [6]. Pediatric obesity is also closely related to dyslipidemia or type 2 diabetes [7-9]. In a longitudinal study, obesity was shown to be strongly
This research was supported by the Basic Science Research Program through the National Research Foundation of Korea funded by the Ministry of Education, Science and Technology (grant number NRF-2013R1A1A3010359).
§Corresponding Author: YoonJu Song, Tel. 82-2-2164-4681, Fax. +82-2-2164-6583, Email. [email protected] Recevied: May 21, 2014, Revised: October 21, 2014, Accepted: October 21, 2014
This is an Open Access article distributed under the terms of the Creative Commons Attribution Non-Commercial License (http://creativecommons.org/licenses/by-nc/3.0/) which permits unrestricted non-commercial use, distribution, and reproduction in any medium, provided the original work is properly cited.
associated with cardiovascular risk factors in children and adolescents [10-12]. The pathological process of cardiovascular diseases (CVD) begins during childhood [13], and its risk factors include being overweight, abdominal obesity, hypertension, and glucose intolerance [13,14]. These features are defined as metabolic syndrome, and their presence has been associated with high risks for type 2 diabetes and CVD later in life [15].
Although there is currently no universally accepted definition for metabolic syndrome in adolescents, its prevalence is increasing.
For example, the KNHANES on youth aged 10 to 18 years showed that the prevalence of metabolic syndrome increased from 4.0% in 1998 to 5.9% in 2001, 6.6% in 2005, and 7.8%
in 2007 [16]. Recently, due to the arbitrary definitions of metabolic syndrome, several studies were conducted to structuralize the clustering phenomenon of the individual components of complex metabolic syndrome [17-19]. In these studies, three or four patterns of metabolic syndrome, including insulin resistance, obesity, dyslipidemia, and hypertension, were suggested. To more fully understand the etiology of metabolic syndrome, it is necessary to examine their relationships with metabolic syndrome risk factors.
Several studies have examined the association of dietary factors with metabolic syndrome or its risk factors in adoles- cents. A study from an Australian childhood cohort defined a
‘high-risk cluster’ by grouping individual metabolic abnorma- lities and observed a strong association between Western dietary patterns and a high-risk cluster in girls [20]. In a study on Korean adolescents, Kim et al. [21] reported positive associations of abdominal obesity, fasting glucose levels, and serum triglyceride levels with Western dietary patterns. Dietary patterns indicate the overall dietary quality of a population but do not provide information on the role of individual nutrients in metabolic disease.
Thus, this study aimed to cluster metabolic syndrome risk factors as well as their associations with dietary factors in adolescents using data from the Korean National Health and Nutrition Examination Survey.
SUBJECTS AND METHODS Study population
The data in this study were obtained from Korean National Health and Nutrition Examination Surveys (KNHANES 2007- 2010). Among 4,244 eligible adolescents aged 10-18 years, those who participated in both the health examination and dietary survey were selected (n = 3,490). We excluded those subjects who reported implausible energy intakes (< 500 or ≥5,000 kcal per day; n = 40) or showed missing values for blood or target variables (n = 492). A total of 2,958 subjects were analyzed in this study.
Clustering of metabolic syndrome risk factors
In this study, factor analysis was used to group six components of metabolic syndrome, including waist circumference, trigly- cerides, HDL-cholesterol, systolic and diastolic blood pressures, and fasting blood glucose levels. The identified patterns were considered and named according to the metabolic risk factors with higher factor loadings. Each subject was then categorized
into quartiles by pattern score for each pattern.
Definition of metabolic syndrome for adolescents
The definition of metabolic syndrome in adolescents used in this study was adopted from the modified version of the National Cholesterol Education Program Adult Treatment Panel III (NCEP-ATPIII) [22]. Metabolic syndrome was diagnosed if more than three of the following five categories were satisfied:
1) waist circumference ≥90th percentile (based on gender- specific percentiles by age according to the Korean growth chart, 2007 [23]), 2) serum triglyceride level ≥110 mg/dL, 3) serum HDL-cholesterol level ≤40 mg/dL, 4) systolic or diastolic blood pressure ≥90th percentile (based on the normal blood pressure reference for Korean children and adolescents [24]), and 5) fasting blood glucose level ≥100 mg/dL
Assessment of dietary intake
Information on dietary intake was obtained through 24-hour dietary recalls as part of the dietary survey. The nutrient intakes were compared across quartile groups for each identified pattern.
Measurements of other variables
In addition to metabolic syndrome components, pediatric obesity and insulin resistance were compared among quartiles for each pattern score. Pediatric obesity was defined using gender-specific BMI percentiles by age according to the Korean growth chart (2007): overweight (85-95th percentile) and obesity (> 95th percentile). Insulin resistance was defined using the homeostasis model assessment (HOMA), calculated as [fasting insulin (mU/mL) × fasting glucose (mmol/L)]/22.5.
Sociodemographic variables such as age, gender, household income, and physical activity were obtained from the question- naire. Physical activity was defined as being moderately active using data on the frequency of moderate intensity exercise over the previous week.
Statistical analysis
All statistical analyses were conducted using SAS (Statistical Analysis System version 9.3, SAS Institute, Cary, NC, USA). For pattern analysis, factor analysis was performed using a varimax rotation (Proc Factor). Since the pattern analysis can be affected by differences in scales among indicators, the six risk factors of waist circumference, triglycerides, systolic and diastolic blood pressures, HDL-cholesterol, and fasting blood glucose were standardized prior to factor analysis. The number of factors was determined based on the eigenvalue, scree test, and interpre- tability of the derived factors [25]. The three patterns were identified and named according to the metabolic syndrome components with a factor loading greater than |0.4|. Each subject was categorized into quartiles by the pattern score for each pattern. General characteristics and nutrient intake were compared among pattern score quartiles.
All analyses accounted for the complex sampling design effect and appropriate sampling weights of the national survey.
Demographic and biochemical variables across groups in each pattern were evaluated using the Rao-Scott chi-square test for categorical variables and GLM for continuous variables; both
Factor 1: High blood pressure pattern
P-value
Q1 Q2 Q3 Q4
n 740 739 739 740
Gender (%) Male 41.7 44.7 54.3 69.6 0.0001
Age (yrs) 12.8 ± 0.1 13.8 ± 0.1 14.3 ± 0.1 15.1 ± 0.1 0.0001
Physical activity1) Yes 17.2 22.6 22.4 28.2 0.0007
Household income Low 11.5 12.8 13.7 12.3 0.7927
Medium-low 29.8 24.1 25.0 26.2
Medium-high 30.6 33.1 30.8 31.0
High 28.1 30.0 30.5 30.4
Biochemical parameters2)
Waist circumference (cm) 65.5 ± 0.4 67.1 ± 0.3 69.1 ± 0.4 73.1 ± 0.5 0.0001
Serum triglycerides (mg/dL) 89.6 ± 2.7 88.6 ± 2.6 86.5 ± 2.3 94.7 ± 3.2 0.2406
Serum HDL-cholesterol (mg/dL) 48.3 ± 0.4 49.7 ± 0.4 50.1 ± 0.4 50.0 ± 0.5 0.0264
Fasting blood glucose (mg/dL) 88.3 ± 0.3 89.2 ± 0.3 89.5 ± 0.3 90.3 ± 0.3 0.0001
Systolic blood pressure (mmHg) 94.4 ± 0.3 101.4 ± 0.2 107.5 ± 0.3 117.8 ± 0.4 0.0001
Diastolic blood pressure (mmHg) 56.1 ± 0.3 63.9 ± 0.2 68.9 ± 0.2 76.2 ± 0.3 0.0001
HOMA3) 2.6 ± 0.1 2.9 ± 0.1 3.1 ± 0.1 3.6 ± 0.1 0.0001
Prevalence (%)
Waist circumference ≥ 90th pct 2.6 3.1 6.9 10.9 0.0001
Hypertriglyceridemia ≥ 110 mg/dL 23.9 21.7 20.2 23.2 0.4811
Low HDL-cholesterol ≤ 40 mg/dL 17.2 14.6 14.2 19.6 0.0523
Fasting blood glucose ≥ 100 mg/dL 4.5 4.9 4.5 7.0 0.1680
High blood pressure ≥ 90th pct 0 3.9 24.7 70.3 -
Metabolic syndrome 1.7 1.8 3.5 11.3 0.0001
All analyses accounted for the complex sampling design effect and appropriate sampling weights of the national survey. Values are expressed as weighted means ± SE or the weighted percentage.
1)Physical activity was assigned “yes” if a subject engaged in moderate intensity physical activity for more than 30 min at least 3 days or more per week over the previous week.
2)Models for biochemical parameters were adjusted for age, gender, and physical activity, and P-values for trend were determined.
3)HOMA (homeostasis model assessment of insulin resistance) = [fasting plasma glucose (mmol/L) × fasting plasma insulin (µIU/mL)]/22.5 Table 2. General and biochemical characteristics of study subjects across pattern score quartiles in the high blood pressure pattern
Pattern 1 High blood pressure pattern
Pattern 2 Dyslipidemia
pattern
Pattern 3 Glucose abnormality
pattern
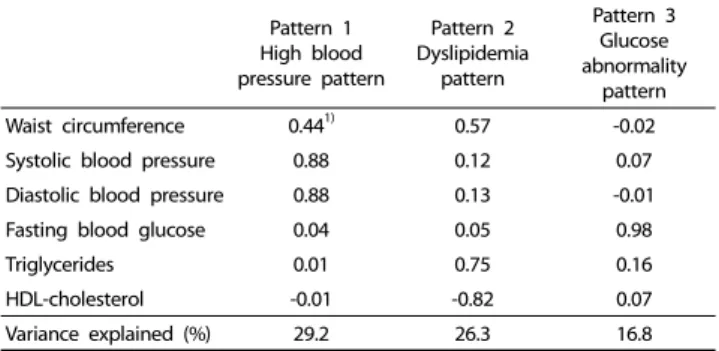
Waist circumference 0.441) 0.57 -0.02
Systolic blood pressure 0.88 0.12 0.07
Diastolic blood pressure 0.88 0.13 -0.01
Fasting blood glucose 0.04 0.05 0.98
Triglycerides 0.01 0.75 0.16
HDL-cholesterol -0.01 -0.82 0.07
Variance explained (%) 29.2 26.3 16.8
1)Factor loading values < |0.40| were excluded for simplicity.
Table 1. Factor loadings of clustering patterns using components of metabolic syndrome
tests were performed using the PROC SURVEY procedure.
Nutrient intakes across groups were analyzed by GLM using PROC SURVEYREG after adjusting for possible confounding variables. For the high blood pressure and dyslipidemia patterns, age, gender, and physical activity were adjusted, and for the glucose abnormality pattern, age and gender were adjusted.
Adjusted means by group for each nutrient intake were analyzed using Bonferroni multiple comparison correction with alpha = 0.05.
RESULTS
Three distinct patterns of metabolic syndrome risk factors The individual risk factors for metabolic syndrome were grouped as three distinct patterns, and the factor loadings of each pattern are presented in Table 1. The first pattern was labeled the ‘high blood pressure pattern’ due to high loadings of systolic and diastolic blood pressures. The second pattern was the ‘dyslipidemia pattern’ due to high loadings of trigly- ceride and HDL-cholesterol levels. However, these two patterns shared modest loadings of waist circumference. The third pattern was labeled the ‘glucose abnormality pattern’ due to high loadings of fasting blood glucose levels.
The general and biochemical characteristics of each pattern are presented in Tables 2-4. Metabolic syndrome risk factors showed different features according to pattern. For the high blood pressure pattern, all metabolic risk factors except serum
triglycerides differed across the pattern score quartiles, as shown in Table 2. Among the variables, systolic and diastolic blood pressures and waist circumference markedly increased across the pattern score quartiles.
In the dyslipidemia pattern, all metabolic risk factors except for blood glucose differed significantly across pattern score quartiles, as shown in Table 3. Serum triglycerides, waist circum- ference, and systolic blood pressure markedly increased, whereas HDL-cholesterol decreased across quartiles. In the glucose abnormality pattern, all metabolic risk factors except for waist circumference differed significantly across quartiles, as shown in Table 4. In contrast with other patterns, waist
Factor 2: Dyslipidemia pattern
P-value
Q1 Q2 Q3 Q4
n 739 740 740 739
Gender (%) Male 46.9 51.0 54.9 61.3 0.0001
Age (yrs) 13.6 ± 0.1 14.1 ± 0.1 14.3 ± 0.1 14.3 ± 0.1 0.0001
Physical activity1) Yes 18.9 20.8 24.4 27.6 0.0048
Household income Low 11.0 14.4 14.0 11.0 0.7045
Medium-low 26.7 27.4 24.0 26.6
Medium-high 32.9 29.8 31.5 31.3
High 29.3 28.3 30.6 31.0
Biochemical parameters2)
Waist circumference (cm) 63.1 ± 0.3 66.2 ± 0.3 68.6 ± 0.4 76.5 ± 0.4 0.0001
Serum triglycerides (mg/dL) 56.5 ± 1.1 69.1 ± 1.3 87.6 ± 1.6 143.5 ± 3.4 0.0001
Serum HDL-cholesterol (mg/dL) 60.7 ± 0.3 51.4 ± 0.2 46.0 ± 0.2 40.4 ± 0.3 0.0001
Fasting blood glucose (mg/dL) 89.2 ± 0.3 89.0 ± 0.3 88.8 ± 0.3 90.2 ± 0.3 0.0557
Systolic blood pressure (mmHg) 104.6 ± 0.5 105.2 ± 0.5 104.4 ± 0.5 107.1 ± 0.5 0.0006
Diastolic blood pressure (mmHg) 67.3 ± 0.4 66.6 ± 0.4 65.4 ± 0.5 66.0 ± 0.4 0.0037
HOMA3) 2.6 ± 0.1 2.8 ± 0.1 2.9 ± 0.1 3.8 ± 0.1 0.0001
Prevalence (%)
Waist circumference ≥ 90th pct 0.6 1.2 4.3 18.4 0.0001
Hypertriglyceridemia ≥ 110 mg/dL 1.5 7.0 18.1 61.7 0.0001
Low HDL-cholesterol ≤ 40 mg/dL 0 0.1 12.0 53.4 -
Fasting blood glucose ≥ 100 mg/dL 5.2 4.4 4.3 7.2 0.1337
High blood pressure ≥ 90th pct 28.0 28.4 24.5 27.9 0.4444
Metabolic syndrome 0.1 0.1 0.4 19.0 0.0001
All analyses accounted for the complex sampling design effect and appropriate sampling weights of the national survey. Values are expressed as weighted means ± SE or the weighted percentage.
1)Physical activity was assigned “yes” if a subject engaged in moderate intensity physical activity for more than 30 min at least 3 days or more per week over the previous week.
2)Models for biochemical parameters were adjusted for age, gender, and physical activity, and P-values for trend were determined.
3)HOMA (homeostasis model assessment of insulin resistance) = [fasting plasma glucose (mmol/L) × fasting plasma insulin (µIU/mL)]/22.5 Table 3. General and biochemical characteristics of study subjects across pattern score quartiles in the dyslipidemia pattern
Factor 3: Glucose abnormality pattern
P-value
Q1 Q2 Q3 Q4
n 739 740 740 739
Gender (%) Male 50.0 54.5 52.2 58.2 0.0506
Age (yrs) 15.0 ± 0.1 14.2 ± 0.1 13.7 ± 0.1 13.2 ± 0.1 0.0001
Physical activity1) Yes 24.0 24.4 21.3 21.9 0.5725
Household income Low 11.0 12.2 13.8 13.7 0.1159
Medium-low 24.0 24.7 26.5 30.0
Medium-high 32.1 33.3 28.4 31.5
High 32.9 29.7 31.3 24.8
Biochemical parameters2)
Waist circumference (cm) 68.2 ± 0.4 69.2 ± 0.4 67.6 ± 0.4 68.9 ± 0.5 0.7210
Serum triglycerides (mg/dL) 78.7 ± 1.8 88.5 ± 2.3 87.4 ± 2.3 102.0 ± 3.4 0.0001
Serum HDL-cholesterol (mg/dL) 49.2 ± 0.4 49.0 ± 0.4 50.5 ± 0.4 50.4 ± 0.5 0.0072
Fasting blood glucose (mg/dL) 81.2 ± 0.2 87.3 ± 0.1 91.0 ± 0.1 97.4 ± 0.2 0.0001
Systolic blood pressure (mmHg) 103.5 ± 0.5 105.0 ± 0.5 105.8 ± 0.5 106.6 ± 0.5 0.0001
Diastolic blood pressure (mmHg) 65.5 ± 0.4 66.2 ± 0.4 66.1 ± 0.4 67.0 ± 0.5 0.0207
HOMA3) 2.4 ± 0.0 2.9 ± 0.1 3.0 ± 0.1 3.7 ± 0.1 0.0001
Prevalence (%)
Waist circumference ≥ 90th pct 7.2 6.8 3.8 6.7 0.0986
Hypertriglyceridemia ≥ 110 mg/dL 17.3 23.7 21.3 27.5 0.0005
Low HDL-cholesterol ≤ 40 mg/dL 16.3 18.2 14.9 16.7 0.5755
Fasting blood glucose ≥ 100 mg/dL 0 0 0 22.6 -
High blood pressure ≥ 90th pct 28.6 29.9 24.5 25.5 0.1897
Metabolic syndrome 4.3 4.5 2.3 8.8 0.0001
All analyses accounted for the complex sampling design effect and appropriate sampling weights of the national survey. Values are expressed as weighted means ± SE or the weighted percentage.
1)Physical activity was assigned “yes” if a subject engaged in moderate intensity physical activity for more than 30 min at least 3 days or more per week over the previous week.
2)Models for biochemical parameters were adjusted for age and gender, and P-values for trend were determined.
3)HOMA (homeostasis model assessment of insulin resistance) = [fasting plasma glucose (mmol/L) × fasting plasma insulin (µIU/mL)]/22.5 Table 4. General and biochemical characteristics of study subjects across pattern score quartiles in the glucose abnormality pattern
Factor 1: High blood pressure pattern P-value for Difference1)
P-value for Trend
Q1 Q2 Q3 Q4
Energy (g) 1,911.0 ± 35.7 1,971.3 ± 33.4 1,995.7 ± 35.8 1,977.2 ± 36.6 0.2991 0.1794
Carbohydrate (g) 310.5 ± 2.5 315.9 ± 2.2 317.7 ± 2.6 310.1 ± 2.4 0.0256 0.8867
Protein (g) 70.7 ± 1.1 69.0 ± 0.8 70.4 ± 0.9 71.4 ± 1.0 0.1264 0.4082
Fat (g) 49.9 ± 0.9 50.1 ± 0.9 48.5 ± 0.9 51.2 ± 0.9 0.1388 0.4811
Calcium (mg) 494.7 ± 13.1 494.3 ± 10.8 492.2 ± 12.5 484.9 ± 13.1 0.9334 0.5618
Phosphorus (mg) 1,145.2 ± 15.5 1,119.2 ± 11.2 1,138.4 ± 12.0 1,146.0 ± 13.7 0.2682 0.6591
Iron (mg) 11.9 ± 0.4 12.6 ± 0.4 12.1 ± 0.4 11.6 ± 0.3 0.2786 0.3838
Sodium (mg) 4,087.8 ± 97.4 3,967.4 ± 75.8 4,027.7 ± 83.3 4,086.3 ± 86.7 0.6449 0.8292
Potassium (mg) 2,549.5 ± 40.0 2,532.7 ± 32.0 2,544.7 ± 40.6 2,581.0 ± 41.7 0.8062 0.5221
Vitamin A (μgRE) 650.9 ± 27.7 698.3 ± 46.9 705.3 ± 47.7 693.7 ± 37.7 0.4462 0.4019
Thiamin (mg) 1.34 ± 0.05 1.36 ± 0.06 1.38 ± 0.06 1.41 ± 0.06 0.1776 0.0272
Riboflavin (mg) 1.25 ± 0.04 1.28 ± 0.04 1.27 ± 0.04 1.30 ± 0.04 0.4040 0.1437
Niacin (mg) 14.8 ± 0.2 14.7 ± 0.2 14.9 ± 0.3 15.1 ± 0.2 0.5383 0.3245
Vitamin C (mg) 86.2 ± 3.4 86.7 ± 3.4 87.1 ± 4.1 90.7 ± 4.5 0.8529 0.4065
Percent of energy (%)
from carbohydrate 63.4 ± 0.4 64.4 ± 0.4 64.7 ± 0.5 63.3 ± 0.5 0.0125 0.8279
from protein 14.3 ± 0.2 13.9 ± 0.1 14.2 ± 0.2 14.4 ± 0.2 0.1163 0.3606
from fat 22.1 ± 0.4 22.0 ± 0.4 21.4 ± 0.4 22.5 ± 0.4 0.1051 0.6246
Values are expressed as adjusted means ± SE with appropriate sampling weights.
1)All models were analyzed using the complex sampling design effect after adjusting for age, gender, physical activity, and energy intake (except the model for energy intake).
The P-values for differences across groups were calculated using PROC SURVEYREG, and mean values within a row were not significantly different according to Bonferroni correction of multiple comparisons at alpha = 0.05.
Table 5. The association of nutrient intake with the high blood pressure pattern
Factor 2: Dyslipidemia pattern P-value for
Difference1)
P-value for Trend
Q1 Q2 Q3 Q4
Energy (g) 1,899.3 ± 29.9a 2,013.5 ± 36.1b 1,959.3 ± 31.2 1,979.7 ± 37.5 0.0432 0.1800
Carbohydrate (g) 308.7 ± 2.3a 318.9 ± 2.4b 312.8 ± 2.6 313.4 ± 2.7 0.0034 0.5193
Protein (g) 70.6 ± 1.0 68.6 ± 0.8a 70.2 ± 0.9 72.1 ± 1.0b 0.0516 0.1325
Fat (g) 52.4 ± 0.9b 49.0 ± 0.9a 49.0 ± 1.0 49.5 ± 0.9 0.0089 0.0311
Calcium (mg) 520.4 ± 13.4c 489.0 ± 11.0 455.6 ± 10.0a 501.7 ± 12.7b 0.0001 0.0939
Phosphorus (mg) 1,137.9 ± 14.8 1,123.2 ± 11.7b 1,113.1 ± 12.3a 1,173.1 ± 12.1c 0.0016 0.0644
Iron (mg) 12.1 ± 0.4 12.1 ± 0.3 11.9 ± 0.4 12.0 ± 0.3 0.9524 0.8028
Sodium (mg) 3,971.2 ± 78.3 3,867.7 ± 76.4a 4,107.3 ± 81.3 4,215.2 ± 91.4b 0.0103 0.0049
Potassium (mg) 2,536.7 ± 38.2 2,572.8 ± 42.9 2,488.3 ± 34.9 2,607.9 ± 39.5 0.0931 0.4383
Vitamin A (μgRE) 645.2 ± 24.4 674.6 ± 35.8 708.7 ± 54.4 717.3 ± 39.6 0.2785 0.0802
Thiamin (mg) 1.40 ± 0.1 1.36 ± 0.1 1.37 ± 0.1 1.37 ± 0.1 0.6378 0.1142
Riboflavin (mg) 1.32 ± 0.0b 1.27 ± 0.0 1.23 ± 0.3a 1.29 ± 0.0 0.0073 0.0082
Niacin (mg) 14.6 ± 0.2 14.7 ± 0.2 14.8 ± 0.2 15.3 ± 0.3 0.2432 0.0449
Vitamin C (mg) 88.0 ± 4.2 96.6 ± 4.4 82.6 ± 3.6 83.7 ± 3.6 0.0574 0.1009
Percent of Energy (%)
from carbohydrate 62.8 ± 0.5a 64.9 ± 0.4b 63.8 ± 0.4 64.1 ± 0.5 0.0013 0.2108
from protein 14.3 ± 0.2 13.8 ± 0.1 14.2 ± 0.2 14.4 ± 0.2 0.0539 0.2594
from fat 23.2 ± 0.4b 21.6 ± 0.4a 21.7 ± 0.4a 21.7 ± 0.4a 0.0023 0.0088
Values are expressed as adjusted means ± SE with appropriate sampling weights
1)All models were analyzed using the complex sampling design effect after adjusting for age, gender, physical activity, and energy intake (except the model for energy intake).
The P-values for differences across groups were calculated using PROC SURVEYREG, and mean values with different superscripts within a row differed significantly according to Bonferroni correction of multiple comparisons at alpha = 0.05.
Table 6. The association of nutrient intake with the dyslipidemia pattern
circumference was not associated, and HDL-cholesterol slightly increased across quartiles.
The prevalence of metabolic syndrome or individual compo- nents showed different characteristics according to pattern.
While subjects in the highest quartile of the high blood pressure pattern showed the highest prevalence of high blood pressure, those in the dyslipidemia pattern highest quartile showed the highest prevalence of hypertriglyceridemia and low HDL-
cholesterol.
Regarding demographic variables, age, gender, and physical activity differed significantly across pattern score quartiles in the high blood pressure pattern and dyslipidemia pattern. Age was significantly associated, gender was marginally associated, and physical activity was not associated with the glucose abnormality pattern. Household income was not associated significantly with any of the three patterns.
Factor 3: Glucose abnormality pattern P-value for
Difference1) P-value for Trend
Q1 Q2 Q3 Q4
Energy (g) 1,981.2 ± 36.2 1,994.9 ± 33.3 1,981.2 ± 31.3 1,937.4 ± 31.9 0.6086 0.3728
Carbohydrate (g) 310.4 ± 2.6 316.7 ± 2.2 312.4 ± 2.3 315.2 ± 2.4 0.2179 0.3300
Protein (g) 70.9 ± 1.1 69.5 ± 0.8 70.2 ± 0.9 69.4 ± 0.9 0.6263 0.3512
Fat (g) 49.8 ± 0.9 49.1 ± 0.8 50.7 ± 0.9 49.7 ± 0.9 0.5744 0.7698
Calcium (mg) 493.2 ± 12.1 474.0 ± 10.7 489.4 ± 12.1 480.7 ± 11.9 0.5793 0.6674
Phosphorus (mg) 1,145.8 ± 14.6 1,117.1 ± 10.5 1,134.9 ± 13.3 1,122.2 ± 13.1 0.3279 0.3799
Iron (mg) 12.2 ± 0.3 11.8 ± 0.3 12.1 ± 0.4 11.5 ± 0.3 0.2983 0.1993
Sodium (mg) 3,882.5 ± 92.2 3,975.4 ± 74.2 4,071.2 ± 75.7 4,061.9 ± 49.3 0.3973 0.1051
Potassium (mg) 2,548.0 ± 48.8 2,504.5 ± 33.1 2,521.0 ± 37.9 2,524.2 ± 42.1 0.8989 0.7836
Vitamin A (μgRE) 675.9 ± 32.8 676.6 ± 28.4 683.5 ± 48.5 657.0 ± 40.6 0.9732 0.7690
Thiamin (mg) 1.34 ± 0.06 1.34 ± 0.06 1.40 ± 0.06 1.41 ± 0.06 0.0912 0.0249
Riboflavin (mg) 1.26 ± 0.04 1.26 ± 0.04 1.30 ± 0.04 1.26 ± 0.0 0.4419 0.8337
Niacin (mg) 15.2 ± 0.3 14.5 ± 0.2 14.9 ± 0.2 14.9 ± 0.2 0.2218 0.6821
Vitamin C (mg) 88.0 ± 4.3 82.4 ± 3.6 86.1 ± 3.8 92.2 ± 4.7 0.3457 0.4615
Percent of energy (%)
from carbohydrate 63.6 ± 0.5 64.4 ± 0.4 63.7 ± 0.4 64.4 ± 0.4 0.3497 0.3791
from protein 14.3 ± 0.2 14.0 ± 0.2 14.1 ± 0.2 14.0 ± 0.2 0.4593 0.2412
from fat 21.9 ± 0.4 21.8 ± 0.4 22.3 ± 0.3 21.7 ± 0.4 0.5113 0.9286
Values are expressed as adjusted means ± SE with appropriate sampling weights.
1)All models were analyzed using the complex sampling design effect and appropriate sampling weights of the national survey after adjusting for age, gender, and energy intake (except the model for energy intake). The P-values for differences across groups were calculated using PROC SURVEYREG, and mean values within a row were not significantly different according to Bonferroni correction of multiple comparisons at alpha = 0.05.
Table 7. The association of nutrient intake with the glucose abnormality pattern
Association of nutrient intake in the three distinct patterns Nutrient intake across quartile groups in the blood pressure pattern is presented in Table 5. Carbohydrate intake and percentage of energy from carbohydrates differed significantly across quartiles after adjusting for all confounding factors, although there were no linear trends. Thiamin intake increased significantly across quartiles.
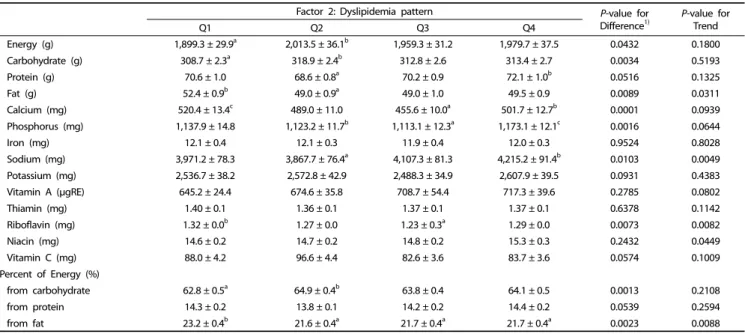
Nutrient intake across quartile groups in the dyslipidemia pattern is presented in Table 6. Energy, carbohydrate, protein, fat, calcium, phosphorus, sodium, and riboflavin intakes were significantly associated across quartiles after adjusting for all confounding factors. Among nutrients, fat and riboflavin intakes significantly decreased across quartiles, whereas sodium and niacin intakes significantly increased . The percentage of energy from fat also significantly decreased across quartiles.
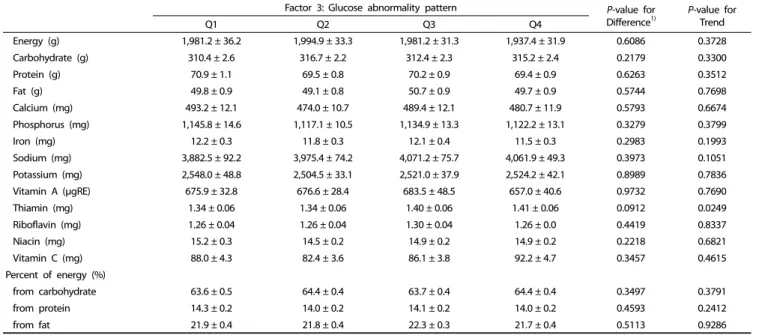
Nutrient intake across quartile groups for the glucose abnormality pattern is presented in Table 7. None of the nutrient intakes differed significantly across quartiles after adjusting for all confounding factors, although thiamin intake significantly increased across quartiles.
DISCUSSION
This study identified three distinct patterns among metabolic syndrome risk factors in a nationally representative sample of Korean adolescents and found that those patterns were differentially associated with nutrient intake. Among the three patterns, the dyslipidemia pattern was strongly associated with several nutrient intakes. No nutrient intake except for thiamin showed significant association with both the high blood pressure and glucose abnormality patterns.
We found that the six metabolic risk factors of interest were
grouped into three distinct patterns characterized by their dominant traits. Although insulin resistance is considered to be an underlying factor, the mechanism causing metabolic syndrome is unclear. Kahn and colleagues [26] suggested more than one underlying factor in metabolic syndrome, which suggests a more complex etiology. Several studies have examined the structures of metabolic risk factors. Li and Ford [18] examined the construct validity of metabolic risk factors using confir- matory factor analysis and suggested that, among six compo- nents, waist circumference, triglycerides, fasting insulin, and systolic blood pressure are potentially useful phenotypic traits defined in adolescents. Huang and colleagues also conducted cluster analysis for metabolic syndrome in adults using meta- bolic risk factor cutoff values that were not applicable to children. They identified a high-risk group showing strong association with inflammatory markers, implying that even though metabolic syndrome shares common traits, dominant traits could lead to metabolic syndrome in a differential manner.
Collectively, focusing on dominant traits and their associations with dietary factors would be more effective than focusing solely on metabolic syndrome, especially for adolescents whose biochemical parameters gradually increase.
In this study, we found that three distinct patterns were differentially associated with nutrient intake. Among the three patterns, the dyslipidemia pattern was strongly associated with several nutrient intakes. Interestingly, dietary fat intake decreased significantly across quartile groups. Many epidemiological studies reported that high saturated fat intake has adverse effects on metabolic syndrome, whereas high polyunsaturated fat intake has beneficial effects [27,28,29]. However, we could not examine the effects of different types of fatty acids on metabolic risk factors in this study due to the lack of a fatty acid nutrient
database for Korean foods.
Even though the importance of dietary factors in the preven- tion of metabolic disease has been emphasized, only a few studies have actually investigated the associations between specific dietary factors and metabolic syndrome in adolescents.
Dietary fiber has been reported to be positively associated with reduced risk of metabolic syndrome in American children and adolescents [30]. Higher overall healthy eating index and fruit intake are also associated with reduced risk of metabolic syndrome in American adolescents [31]. However, those studies did not report on the associations of individual components of metabolic syndrome.
In this study, several micronutrients such as calcium, phos- phorus, sodium, riboflavin, and niacin were found to be significantly associated with the dyslipidemia pattern, whereas thiamin was associated with the blood pressure and glucose abnormalities patterns. There are only limited studies on the relationships between micronutrient intakes and metabolic syndrome or its components. Bakker et al. [32] reported that thiamin intake appears to have a strong and relevant associa- tion with glucose tolerance, which is in agreement with high thiamin intake in the glucose abnormalities pattern in this study.
Regarding dyslipidemia, few studies have examined micronu- trient intakes. Jacqmain et al. [33] reported that high calcium intake is associated with a plasma lipoprotein-lipid profile, including greater HDL cholesterol levels. Several recent studies on metabolic syndrome and micronutrient intakes reported an association between high sodium intake and metabolic syndrome in Chilean adults [34] and Korean females [35]. In addition, Beydown et al. [36] reported an inverse relationship between calcium, magnesium, and phosphorus intakes and metabolic disorders among US adults based on data from NHANES 1994-2004. To better understand the role of diet on the etiology of metabolic syndrome or its components, future studies should explore mechanisms underlying the associations between specific patterns of metabolic risk factors and dietary factors.
There were several limitations to this study. First, it was a cross-sectional study and thus no causal inferences could be drawn. Second, we obtained dietary intake information via a single 24-hour recall survey, which may not represent typical dietary intakes. However, we categorized subjects into quartiles according to their pattern scores and compared mean values among the groups. Finally, the definition of metabolic syndrome in children and adolescents has not been well established, awhich suggests misclassification is a concern. Nevertheless, this study is the first to characterize metabolic risk factors using factor analysis and to examine the associations between identified patterns and dietary factors in a large nationally representative adolescent sample.
The results of the present study suggest that individual risk factors for metabolic syndrome are characterized and differen- tially associated with dietary factors. Thus, dietary recom- mendations or strategies should be designed according to specific patterns. Future studies elucidating the underlying mechanisms of specific patterns can help clarify the role of diet in the development and prevention of metabolic syndrome in Korean adolescents.
REFERENCES
1. Rogol AD, Roemmich JN, Clark PA. Growth at puberty. J Adolesc Health 2002;31:192-200.
2. Lytle LA, Seifert S, Greenstein J, McGovern P. How do children's eating patterns and food choices change over time? Results from a cohort study. Am J Health Promot 2000;14:222-8.
3. Shannon BM, Parks SC. Fast foods: a perspective on their nutritional impact. J Am Diet Assoc 1980;76:242-7.
4. Lobstein T, Baur L, Uauy R; IASO International Obesity TaskForce.
Obesity in children and young people: a crisis in public health. Obes Rev 2004;5 Suppl 1:4-104.
5. Baek S. Do obese children exhibit distinguishable behaviours from normal weight children?: based on literature review. Korean J Community Nutr 2008;13:386-95.
6. Whitaker RC, Wright JA, Pepe MS, Seidel KD, Dietz WH. Predicting obesity in young adulthood from childhood and parental obesity.
N Engl J Med 1997;337:869-73.
7. Caprio S. Insulin resistance in childhood obesity. J Pediatr Endo- crinol Metab 2002;15 Suppl 1:487-92.
8. Goran MI, Gower BA. Abdominal obesity and cardiovascular risk in children. Coron Artery Dis 1998;9:483-7.
9. Arslanian S. Type 2 diabetes in children: clinical aspects and risk factors. Horm Res 2002;57 Suppl 1:19-28.
10. Must A, Jacques PF, Dallal GE, Bajema CJ, Dietz WH. Long-term morbidity and mortality of overweight adolescents. A follow-up of the Harvard Growth Study of 1922 to 1935. N Engl J Med 1992;
327:1350-5.
11. Berenson GS, Srinivasan SR, Bao W, Newman WP 3rd, Tracy RE, Wattigney WA. Association between multiple cardiovascular risk factors and atherosclerosis in children and young adults. The Bogalusa Heart Study. N Engl J Med 1998;338:1650-6.
12. Steinberger J, Daniels SR; American Heart Association Atheros- clerosis, Hypertension, and Obesity in the Young Committee (Council on Cardiovascular Disease in the Young); American Heart Association Diabetes Committee (Council on Nutrition, Physical Activity, and Metabolism). Obesity, insulin resistance, diabetes, and cardiovascular risk in children: an American Heart Association scientific statement from the Atherosclerosis, Hypertension, and Obesity in the Young Committee (Council on Cardiovascular Disease in the Young) and the Diabetes Committee (Council on Nutrition, Physical Activity, and Metabolism). Circulation 2003;107:1448-53.
13. Daniels SR, Greer FR; Committee on Nutrition. Lipid screening and cardiovascular health in childhood. Pediatrics 2008;122:198-208.
14. De Ferranti SD, Osganian SK. Epidemiology of paediatric metabolic syndrome and type 2 diabetes mellitus. Diab Vasc Dis Res 2007;4:
285-96.
15. Eckel RH, Grundy SM, Zimmet PZ. The metabolic syndrome. Lancet 2005;365:1415-28.
16. Lim S, Jang HC, Park KS, Cho SI, Lee MG, Joung H, Mozumdar A, Liguori G. Changes in metabolic syndrome in American and Korean youth, 1997-2008. Pediatrics 2013;131:e214-22.
17. Pladevall M, Singal B, Williams LK, Brotons C, Guyer H, Sadurni J, Falces C, Serrano-Rios M, Gabriel R, Shaw JE, Zimmet PZ, Haffner S. A single factor underlies the metabolic syndrome: a confirmatory factor analysis. Diabetes Care 2006;29:113-22.
18. Li C, Ford ES. Is there a single underlying factor for the metabolic syndrome in adolescents? A confirmatory factor analysis. Diabetes
Care 2007;30:1556-61.
19. Fitzpatrick SL, Lai BS, Brancati FL, Golden SH, Hill-Briggs F. Metabolic syndrome risk profiles among African American adolescents: national health and nutrition examination survey, 2003-2010. Diabetes Care 2013;36:436-42.
20. Ambrosini GL, Huang RC, Mori TA, Hands BP, O'Sullivan TA, de Klerk NH, Beilin LJ, Oddy WH. Dietary patterns and markers for the metabolic syndrome in Australian adolescents. Nutr Metab Cardiovasc Dis 2010;20:274-83.
21. Kim JA, Kim SM, Lee JS, Oh HJ, Han JH, Song Y, Joung H, Park HS. Dietary patterns and the metabolic syndrome in Korean adolescents: 2001 Korean National Health and Nutrition Survey.
Diabetes Care 2007;30:1904-5.
22. Cook S, Weitzman M, Auinger P, Nguyen M, Dietz WH. Prevalence of a metabolic syndrome phenotype in adolescents: findings from the third National Health and Nutrition Examination Survey, 1988- 1994. Arch Pediatr Adolesc Med 2003;157:821-7.
23. Moon JS, Lee SY, Nam CM, Choi JM, Choe BK, Seo JW, Oh K, Jang MJ, Hwang SS, Yoo MH, Kim YT, Lee CG. 2007 Korean National Growth Charts: review of developmental process and an outlook.
Korean J Pediatr 2008;51:1-25.
24. Update on the 1987 Task Force Report on High Blood Pressure in Children and Adolescents: a working group report from the National High Blood Pressure Education Program. National High Blood Pressure Education Program Working Group on Hypertension Control in Children and Adolescents. Pediatrics 1996;98:649-58.
25. Newby PK, Tucker KL. Empirically derived eating patterns using factor or cluster analysis: a review. Nutr Rev 2004;62:177-203.
26. Kahn R, Buse J, Ferrannini E, Stern M; American Diabetes Associa- tion; European Association for the Study of Diabetes. The metabolic syndrome: time for a critical appraisal: joint statement from the American Diabetes Association and the European Association for the Study of Diabetes. Diabetes Care 2005;28:2289-304.
27. Riccardi G, Giacco R, Rivellese AA. Dietary fat, insulin sensitivity and the metabolic syndrome. Clin Nutr 2004;23:447-56.
28. Jakobsen MU, O'Reilly EJ, Heitmann BL, Pereira MA, Bälter K, Fraser GE, Goldbourt U, Hallmans G, Knekt P, Liu S, Pietinen P, Spiegelman D, Stevens J, Virtamo J, Willett WC, Ascherio A. Major types of dietary fat and risk of coronary heart disease: a pooled analysis of 11 cohort studies. Am J Clin Nutr 2009;89:1425-32.
29. Brunner EJ, Wunsch H, Marmot MG. What is an optimal diet?
Relationship of macronutrient intake to obesity, glucose tolerance, lipoprotein cholesterol levels and the metabolic syndrome in the Whitehall II study. Int J Obes Relat Metab Disord 2001;25:45-53.
30. Carlson JJ, Eisenmann JC, Norman GJ, Ortiz KA, Young PC. Dietary fiber and nutrient density are inversely associated with the metabolic syndrome in US adolescents. J Am Diet Assoc 2011;111:1688-95.
31. Pan Y, Pratt CA. Metabolic syndrome and its association with diet and physical activity in US adolescents. J Am Diet Assoc 2008;108:276-86.
32. Bakker SJ, Hoogeveen EK, Nijpels G, Kostense PJ, Dekker JM, Gans RO, Heine RJ. The association of dietary fibres with glucose tolerance is partly explained by concomitant intake of thiamine:
the Hoorn Study. Diabetologia 1998;41:1168-75.
33. Jacqmain M, Doucet E, Després JP, Bouchard C, Tremblay A. Calcium intake, body composition, and lipoprotein-lipid concentrations in adults. Am J Clin Nutr 2003;77:1448-52.
34. Baudrand R, Campino C, Carvajal CA, Olivieri O, Guidi G, Faccini G, Vöhringer PA, Cerda J, Owen G, Kalergis AM, Fardella CE. High sodium intake is associated with increased glucocorticoid production, insulin resistance and metabolic syndrome. Clin Endocrinol (Oxf) 2014;80:677-84.
35. Rhee MY, Kim JH, Kim YS, Chung JW, Bae JH, Nah DY, Kim YK, Lee MM, Lim CY, Byun JE, Park HK, Kang BW, Kim JW, Kim SW.
High sodium intake in women with metabolic syndrome. Korean Circ J 2014;44:30-6.
36. Beydoun MA, Gary TL, Caballero BH, Lawrence RS, Cheskin LJ, Wang Y. Ethnic differences in dairy and related nutrient consumption among US adults and their association with obesity, central obesity, and the metabolic syndrome. Am J Clin Nutr 2008;87:1914-25.