Abstract :
Key Words :
Sung Han Kim, M.D. , Chung Won Lee, M.D. , Joon Cheol Park, M.D., Sung Do Yoon, M.D.
Department of Obstetric & Gynecology, Gosin Medical Center , Pusan, Korea Department of Preventive Medicine , and Obstetrics & Gynecology,
Keimyung University School of Medicine, Daegu, Korea
Fig. 1. Age structure of Daegu by sex, 1995 Census.
Fig. 2. Data collection mechanism of Daegu Cancer Registry.
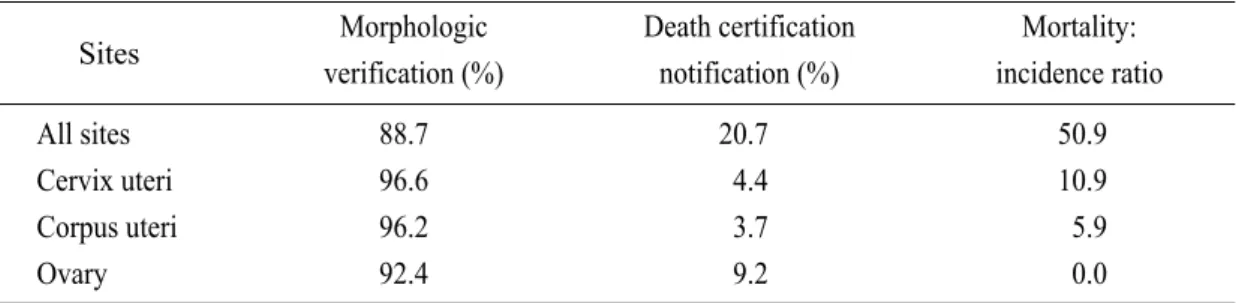
Table 1. Reliability of Daegu Cancer Registry data
Sites Morphologic
verification (%)
Death certification notification (%)
Mortality:
incidence ratio
All sites 88.7 20.7 50.9
Cervix uteri 96.6 4.4 10.9
Corpus uteri 96.2 3.7 5.9
Ovary 92.4 9.2 0.0
Table 2. All cancer incidence rates and reproductive cancer incidence rates in females, Daegu 1997-1998 (rates/100,000 persons)
All cancer
sites
All reproductive
sites*
Cervix uteri
Corpus uteri
& uterus unspecified
Ovary Other
reproductive sites Age
0 4 11.6 1.2 0.6 0.0 0.0 0.6
5 9 10.1 0.7 0.0 0.0 0.7 0.0
10 14 11.2 1.5 0.0 0.0 1.5 0.0
15 19 15.3 3.7 0.0 0.0 2.8 0.9
20 24 18.8 5.0 1.5 0.8 2.7 0.0
25 29 35.1 5.5 4.2 0.0 1.3 0.0
30 34 76.5 22.3 16.6 1.7 3.5 0.4
35 39 118.8 33.4 28.2 2.2 2.2 0.9
40 44 182.0 58.0 46.1 3.4 8.0 0.6
45 49 255.4 69.6 51.7 5.7 10.8 1.4
50 54 295.2 69.8 51.0 8.1 8.9 1.8
55 59 417.0 77.8 55.9 6.0 14.0 2.0
60 64 531.0 95.8 73.8 3.9 11.7 6.5
65 69 741.4 99.0 48.6 18.0 21.6 10.8
70 74 828.9 74.9 60.4 4.8 7.3 2.4
75 79 846.7 66.6 51.0 7.8 3.9 3.9
80 84 767.5 74.7 47.5 6.8 6.8 13.6
> 84 638.1 63.8 12.8 0.0 51.0 0.0
Total 149.8 29.5 21.1 2.4 4.8 1.2
* Cervix uteri + corpus uteri & uterus unspecified + ovary + other reproductive sites.
Table 3. All cancer mortality and reproductive cancer mortality in females, Daegu 1997-1998 (rates/100,000 persons)
All deaths
All cancer
sites
All reproductive
sites*
Cervix uteri
Corpus uteri &
uterus unspecified
Ovary Other
reproductive sites Age
0 4 71.9 3.7 0.0 0.0 0.0 0.0 0.0
5 9 17.5 2.7 0.0 0.0 0.0 0.0 0.0
10 14 14.8 4.6 0.0 0.0 0.0 0.0 0.0
15 19 32.5 3.7 0.0 0.0 0.0 0.0 0.0
20 24 40.3 6.9 0.8 0.0 0.0 0.8 0.0
25 29 51.2 13.5 0.4 0.4 0.0 0.0 0.0
30 34 66.0 24.0 3.1 0.9 1.3 0.9 0.0
35 39 103.4 33.4 3.5 2.6 0.4 0.4 0.0
40 44 139.9 52.3 7.4 2.3 3.4 1.1 0.6
45 49 193.7 84.7 13.6 5.0 5.7 2.9 0.0
50 54 282.7 111.8 9.8 3.6 4.5 1.8 0.0
55 59 470.9 174.6 13.0 5.0 5.0 3.0 0.0
60 64 777.1 250.0 23.3 11.7 10.4 1.3 0.0
65 69 1648.4 478.7 39.6 12.6 16.2 10.8 0.0
70 74 2960.5 674.3 36.3 14.5 19.3 2.4 0.0
75 79 5613.0 811.4 47.0 11.8 27.4 7.8 0.0
80 84 9963.3 903.3 40.7 6.8 20.4 13.6 0.0
> 84 21516.1 689.1 38.3 12.8 12.8 12.8 0.0
Total 390.8 76.2 6.2 2.3 2.6 1.2 0.04
* Cervix uteri + corpus uteri & uterus unspecified + ovary + other reproductive sites.
0 4 0.00059880 0.00005989
5 9 0.00109671 0.00009475
10 14 0.00164398 0.00016938
15 19 0.00238929 0.00035326
20 24 0.00333162 0.00060128
25 29 0.00506317 0.00087347
30 34 0.00880922 0.00197348
35 39 0.01464507 0.00361362
40 44 0.02350671 0.00644304
45 49 0.03580728 0.00980970
50 54 0.04986422 0.01314575
55 59 0.06933535 0.01679438
60 64 0.09334604 0.02114851
65 69 0.12490509 0.02538571
70 74 0.15647508 0.02824584
75 79 0.18264724 0.03030422
80 84 0.19890300 0.03187885
> 84 0.20855622 0.03284407
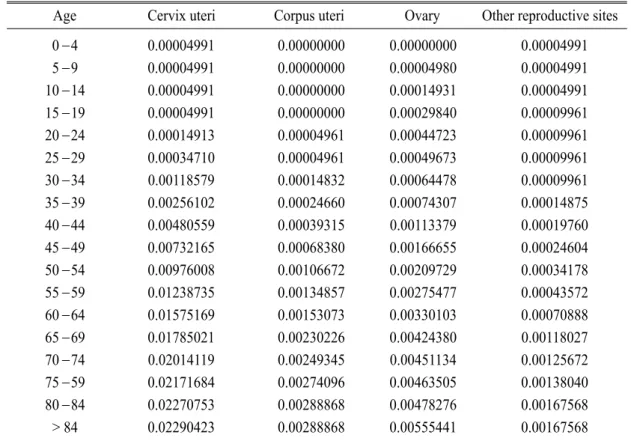
Table 5. Probabilities of developing cervix uteri, corpus uteri and uterus, part unspecified, ovary and other reproductive sites in females, Daegu 1997-1998
Cervix uteri Corpus uteri Ovary Other reproductive sites Age
0 4 0.00004991 0.00000000 0.00000000 0.00004991
5 9 0.00004991 0.00000000 0.00004980 0.00004991
10 14 0.00004991 0.00000000 0.00014931 0.00004991
15 19 0.00004991 0.00000000 0.00029840 0.00009961
20 24 0.00014913 0.00004961 0.00044723 0.00009961
25 29 0.00034710 0.00004961 0.00049673 0.00009961
30 34 0.00118579 0.00014832 0.00064478 0.00009961
35 39 0.00256102 0.00024660 0.00074307 0.00014875
40 44 0.00480559 0.00039315 0.00113379 0.00019760
45 49 0.00732165 0.00068380 0.00166655 0.00024604
50 54 0.00976008 0.00106672 0.00209729 0.00034178
55 59 0.01238735 0.00134857 0.00275477 0.00043572
60 64 0.01575169 0.00153073 0.00330103 0.00070888
65 69 0.01785021 0.00230226 0.00424380 0.00118027
70 74 0.02014119 0.00249345 0.00451134 0.00125672
75 59 0.02171684 0.00274096 0.00463505 0.00138040
80 84 0.02270753 0.00288868 0.00478276 0.00167568
> 84 0.02290423 0.00288868 0.00555441 0.00167568
5 - 0.0500 0.1049 0.1798 0.2744 0.4482 0.8243 1.4103 2.3000 3.5350 4.9463 6.9012 9.3119 12.4805 15.6501 18.2778 19.9099 20.8791 10 - - 0.0550 0.1299 0.2247 0.3987 0.7753 1.3619 2.2527 3.4892 4.9022 6.8594 9.273 12.4454 15.6188 18.2497 19.8838 20.8541 15 - - - 0.0750 0.1698 0.3441 0.7210 1.3083 2.2000 3.4378 4.8523 6.8116 9.2277 12.4034 15.5802 18.2138 19.8496 20.8210 20 - - - - 0.0950 0.2696 0.6474 1.2359 2.1296 3.3700 4.7875 6.7511 9.1724 12.3549 15.5386 18.1779 19.8172 20.7906 25 - - - - - 0.1751 0.5538 1.1439 2.0398 3.2835 4.7047 6.6734 9.1010 12.2919 15.4838 18.1300 19.7735 20.7495 30 - - - - - - 0.3801 0.9723 1.8715 3.1196 4.5460 6.5218 8.9582 12.1605 15.364 18.0197 19.6692 20.6487 35 - - - - - - - 0.5957 1.5002 2.7558 4.1906 6.1781 8.6289 11.8503 15.0727 17.7442 19.4035 20.3888 40 - - - - - - - - 0.9132 2.1807 3.6292 5.6356 8.1098 11.3618 14.6150 17.3119 18.987 19.9817 45 - - - - - - - - - 1.2849 2.7532 4.7871 7.2952 10.5917 13.8894 16.6232 18.3212 19.3296
50 - - - - - - - - - - 1.4956 3.5673 6.1220 9.4798 12.8388 15.6235 17.353 18.3801
55 - - - - - - - - - - - 2.1213 4.7373 8.1755 11.6150 14.4664 16.2375 17.2892
60 - - - - - - - - - - - - 2.7129 6.2787 9.8456 12.8028 14.6394 15.7301
65 - - - - - - - - - - - - - 3.7644 7.5302 10.652 12.5911 13.7425
70 - - - - - - - - - - - - - - 4.1533 7.5965 9.7351 11.0051
75 - - - - - - - - - - - - - - - 4.0375 6.5453 8.0344
80 - - - - - - - - - - - - - - - - 3.3398 5.3231
>84 - - - - - - - - - - - - - - - - - 3.2547
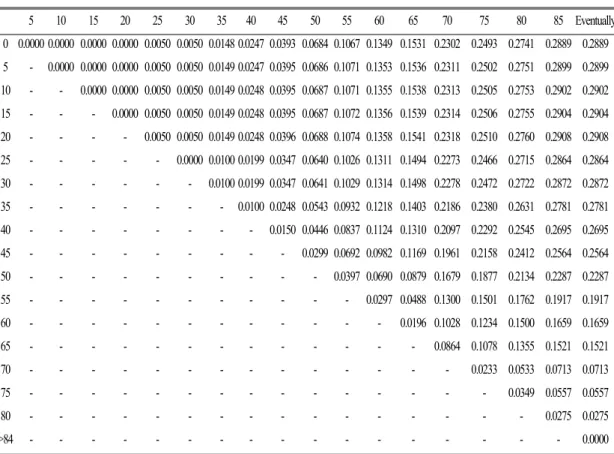
Table 7. Age-conditional risk of cancer (%): all reproductive sites (C51 C58) in females, Daegu 1997-1998
5 10 15 20 25 30 35 40 45 50 55 60 65 70 75 80 85 Eventually
0 0.0060 0.0095 0.0169 0.0353 0.0601 0.0873 0.1973 0.3614 0.6443 0.9810 1.3146 1.6794 2.1149 2.5386 2.8246 3.0304 3.1879 3.2844 5 - 0.0035 0.0110 0.0294 0.0543 0.0817 0.1921 0.3567 0.6407 0.9786 1.3134 1.6796 2.1166 2.5419 2.8289 3.0355 3.1935 3.2904 10 - - 0.0075 0.0260 0.0509 0.0782 0.1887 0.3535 0.6377 0.9759 1.3111 1.6776 2.115 2.5407 2.828 3.0348 3.193 3.2899 15 - - - 0.0185 0.0434 0.0708 0.1814 0.3463 0.6307 0.9692 1.3046 1.6715 2.1092 2.5352 2.8228 3.0297 3.1881 3.2851 20 - - - - 0.0250 0.0524 0.1632 0.3284 0.6134 0.9525 1.2885 1.6560 2.0945 2.5213 2.8094 3.0167 3.1753 3.2725 25 - - - - - 0.0275 0.1385 0.3041 0.5897 0.9296 1.2663 1.6346 2.0742 2.5019 2.7906 2.9984 3.1573 3.2548 30 - - - - - - 0.1114 0.2774 0.5638 0.9046 1.2423 1.6117 2.0525 2.4814 2.7709 2.9793 3.1387 3.2364 35 - - - - - - - 0.1667 0.4544 0.7967 1.1358 1.5067 1.9494 2.3802 2.6709 2.8802 3.0403 3.1384 40 - - - - - - - - 0.2896 0.6341 0.9755 1.349 1.7946 2.2282 2.5209 2.7316 2.8927 2.9915
45 - - - - - - - - - 0.3479 0.6925 1.0695 1.5194 1.9572 2.2527 2.4654 2.6281 2.7278
50 - - - - - - - - - - 0.3490 0.7308 1.1863 1.6296 1.9289 2.1442 2.309 2.4099
55 - - - - - - - - - - - 0.3883 0.8518 1.3028 1.6072 1.8263 1.9939 2.0966
60 - - - - - - - - - - - - 0.4760 0.9393 1.2520 1.4770 1.6492 1.7547
65 - - - - - - - - - - - - - 0.4834 0.8097 1.0445 1.2241 1.3343
70 - - - - - - - - - - - - - - 0.3554 0.6112 0.8069 0.9268
75 - - - - - - - - - - - - - - - 0.2972 0.5245 0.6639
80 - - - - - - - - - - - - - - - - 0.3013 0.4860
>84 - - - - - - - - - - - - - - - - - 0.3045
5 - 0.0000 0.0000 0.0000 0.0100 0.0298 0.1140 0.2520 0.4773 0.7298 0.9746 1.2383 1.5759 1.7865 2.0165 2.1746 2.2740 2.2938 10 - - 0.0000 0.0000 0.0100 0.0299 0.1141 0.2522 0.4777 0.7305 0.9754 1.2393 1.5773 1.7881 2.0182 2.1765 2.2760 2.2957 15 - - - 0.0000 0.0100 0.0299 0.1142 0.2524 0.4781 0.7310 0.9761 1.2402 1.5784 1.7894 2.0197 2.1781 2.2777 2.2975 20 - - - - 0.0100 0.0299 0.1144 0.2528 0.4788 0.7322 0.9777 1.2422 1.5810 1.7923 2.0229 2.1816 2.2813 2.3011 25 - - - - - 0.0200 0.1046 0.2434 0.4698 0.7237 0.9697 1.2348 1.5743 1.7860 2.0172 2.1762 2.2761 2.2960 30 - - - - - - 0.0849 0.2240 0.4511 0.7057 0.9524 1.2182 1.5586 1.7709 2.0027 2.1621 2.2624 2.2823 35 - - - - - 0.1397 0.3677 0.6234 0.8711 1.1380 1.4798 1.6930 1.9257 2.0858 2.1864 2.2064 40 - - - - - - - - 0.2295 0.4867 0.7361 1.0047 1.3487 1.5632 1.7975 1.9586 2.0599 2.0800
45 - - - - - - - - - 0.2596 0.5113 0.7824 1.1295 1.3461 1.5825 1.7451 1.8473 1.8676
50 - - - - - - - - - - 0.2547 0.5291 0.8805 1.0996 1.3389 1.5035 1.6069 1.6275
55 - - - - - - - - - - - 0.2790 0.6362 0.8590 1.1023 1.2696 1.3748 1.3957
60 - - - - - - - - - - - - 0.3667 0.5954 0.8451 1.0168 1.1248 1.1463
65 - - - - - - - - - - - - - 0.2385 0.4989 0.6780 0.7907 0.8130
70 - - - - - - - - - - - - - - 0.2833 0.4781 0.6006 0.6250
75 - - - - - - - - - - - - - - - 0.2264 0.3688 0.3971
80 - - - - - - - - - - - - - - - - 0.1889 0.2264
>84 - - - - - - - - - - - - - - - - - 0.0618
Table 9. Age-conditional risk of cancer (%): corpus uteri & uterus, part unspecified (C54-C55) in females, Daegu 1997-1998
5 10 15 20 25 30 35 40 45 50 55 60 65 70 75 80 85 Eventually
0 0.0000 0.0000 0.0000 0.0000 0.0050 0.0050 0.0148 0.0247 0.0393 0.0684 0.1067 0.1349 0.1531 0.2302 0.2493 0.2741 0.2889 0.2889 5 - 0.0000 0.0000 0.0000 0.0050 0.0050 0.0149 0.0247 0.0395 0.0686 0.1071 0.1353 0.1536 0.2311 0.2502 0.2751 0.2899 0.2899 10 - - 0.0000 0.0000 0.0050 0.0050 0.0149 0.0248 0.0395 0.0687 0.1071 0.1355 0.1538 0.2313 0.2505 0.2753 0.2902 0.2902 15 - - - 0.0000 0.0050 0.0050 0.0149 0.0248 0.0395 0.0687 0.1072 0.1356 0.1539 0.2314 0.2506 0.2755 0.2904 0.2904 20 - - - - 0.0050 0.0050 0.0149 0.0248 0.0396 0.0688 0.1074 0.1358 0.1541 0.2318 0.2510 0.2760 0.2908 0.2908 25 - - - - - 0.0000 0.0100 0.0199 0.0347 0.0640 0.1026 0.1311 0.1494 0.2273 0.2466 0.2715 0.2864 0.2864 30 - - - - - - 0.0100 0.0199 0.0347 0.0641 0.1029 0.1314 0.1498 0.2278 0.2472 0.2722 0.2872 0.2872 35 - - - - - - - 0.0100 0.0248 0.0543 0.0932 0.1218 0.1403 0.2186 0.2380 0.2631 0.2781 0.2781 40 - - - - - - - - 0.0150 0.0446 0.0837 0.1124 0.1310 0.2097 0.2292 0.2545 0.2695 0.2695
45 - - - - - - - - - 0.0299 0.0692 0.0982 0.1169 0.1961 0.2158 0.2412 0.2564 0.2564
50 - - - - - - - - - - 0.0397 0.0690 0.0879 0.1679 0.1877 0.2134 0.2287 0.2287
55 - - - - - - - - - - - 0.0297 0.0488 0.1300 0.1501 0.1762 0.1917 0.1917
60 - - - - - - - - - - - - 0.0196 0.1028 0.1234 0.1500 0.1659 0.1659
65 - - - - - - - - - - - - - 0.0864 0.1078 0.1355 0.1521 0.1521
70 - - - - - - - - - - - - - - 0.0233 0.0533 0.0713 0.0713
75 - - - - - - - - - - - - - - - 0.0349 0.0557 0.0557
80 - - - - - - - - - - - - - - - - 0.0275 0.0275
>84 - - - - - - - - - - - - - - - - - 0.0000
5 - 0.0050 0.0150 0.0299 0.0449 0.0499 0.0647 0.0746 0.1138 0.1673 0.2105 0.2765 0.3313 0.4259 0.4528 0.4652 0.4800 0.5574 10 - - 0.0100 0.0250 0.0399 0.0449 0.0598 0.0696 0.1089 0.1624 0.2057 0.2717 0.3266 0.4213 0.4482 0.4606 0.4754 0.5529 15 - - - 0.0150 0.0300 0.0349 0.0498 0.0597 0.0990 0.1525 0.1958 0.2619 0.3169 0.4116 0.4385 0.4510 0.4658 0.5434 20 - - - - 0.0150 0.0200 0.0349 0.0448 0.0841 0.1378 0.1812 0.2474 0.3024 0.3974 0.4243 0.4368 0.4516 0.5293 25 - - - - - 0.0050 0.0199 0.0299 0.0693 0.1231 0.1665 0.2329 0.2880 0.3832 0.4102 0.4227 0.4376 0.5154 30 - - - - - - 0.0150 0.0249 0.0645 0.1184 0.1620 0.2285 0.2838 0.3792 0.4062 0.4187 0.4337 0.5118 35 - - - - - - - 0.0100 0.0496 0.1037 0.1475 0.2142 0.2697 0.3654 0.3926 0.4051 0.4201 0.4985 40 - - - - - - - - 0.0399 0.0943 0.1382 0.2053 0.2611 0.3573 0.3846 0.3972 0.4123 0.4911
45 - - - - - - - - - 0.0548 0.0991 0.1667 0.2228 0.3198 0.3473 0.3600 0.3752 0.4545
50 - - - - - - - - - - 0.0447 0.1130 0.1698 0.2677 0.2955 0.3083 0.3237 0.4038
55 - - - - - - - - - - - 0.0693 0.1268 0.2262 0.2544 0.2674 0.2830 0.3643
60 - - - - - - - - - - - - 0.0590 0.1607 0.189 0.2030 0.2189 0.3022
65 - - - - - - - - - - - - - 0.1059 0.1359 0.1498 0.1664 0.2530
70 - - - - - - - - - - - - - - 0.0326 0.0477 0.0658 0.1599
75 - - - - - - - - - - - - - - - 0.0175 0.0384 0.1476
80 - - - - - - - - - - - - - - - - 0.0277 0.1722
>84 - - - - - - - - - - - - - - - - - 0.2378
1. Feuer EJ, Wun LM, Boring CC, Flanders WD, Timmel MJ, Tong T. The lifetime risk of developing breast cancer. J Natl Cancer Inst 1993;85:892-7.
2. Merrill RM, Weed DL, Feuer EJ. The lifetime risk of developing prostate cancer in white and black men.
Cancer Epidemiol Biomark Prev 1997;6:763-8.
3. Offit K. Clinical Cancer Genetics: Risk Counseling
& Management. New York: Wiley-Liss; 1998, p.1-
20.
4. Wun LM, Merrill RM, Feuer EJ. Estimating lifetime and age-conditional probabilities of developing cancer. Lifetime Data Anal 1998;4:169-86.
5. National Cancer Institute. Breast Cancer Risk Tool.
Windows Version. 1998.
6. . 1995 . 1997.
7. . 1971-97 . 1999.
8. . 1999 . 2001.
9. Lee CW, Lee MY, Lim HS, Sohn SS, Jeon JK.
Cancer incidence in Daegu in 1997-98: the first results of the Daegu Cancer Registry. J Korean Cancer Assoc 2001;33:136-48.
10. . 1997 .
1998.
11. . 1998 .
1999.
Table 11. Age-conditional risk of cancer (%): other reproductive sites (Re. C51 C58) in females, Daegu 1997-1998
5 10 15 20 25 30 35 40 45 50 55 60 65 70 75 80 85 Eventually
0 0.0050 0.0050 0.0050 0.0100 0.0100 0.0100 0.0100 0.0149 0.0198 0.0246 0.0342 0.0436 0.0709 0.1180 0.1257 0.1380 0.1676 0.1676 5 - 0.0000 0.0000 0.0050 0.0050 0.0050 0.0050 0.0099 0.0148 0.0197 0.0293 0.0387 0.0661 0.1134 0.1211 0.1335 0.1632 0.1632 10 - - 0.0000 0.0050 0.0050 0.0050 0.0050 0.0099 0.0148 0.0197 0.0293 0.0388 0.0662 0.1135 0.1212 0.1336 0.1633 0.1633 15 - - - 0.0050 0.0050 0.0050 0.0050 0.0099 0.0148 0.0197 0.0293 0.0388 0.0662 0.1136 0.1213 0.1337 0.1634 0.1634 20 - - - - 0.0000 0.0000 0.0000 0.0049 0.0099 0.0147 0.0244 0.0338 0.0613 0.1088 0.1165 0.1290 0.1587 0.1587 25 - - - - - 0.0000 0.0000 0.0050 0.0099 0.0148 0.0244 0.0339 0.0615 0.1090 0.1167 0.1292 0.1590 0.1590 30 - - - - - - 0.0000 0.0050 0.0099 0.0148 0.0245 0.0340 0.0616 0.1093 0.1170 0.1296 0.1594 0.1594 35 - - - - - - - 0.0050 0.0099 0.0149 0.0246 0.0341 0.0618 0.1097 0.1174 0.1300 0.1599 0.1599 40 - - - - - - - - 0.0050 0.0099 0.0197 0.0293 0.0571 0.1052 0.1130 0.1256 0.1558 0.1558
45 - - - - - - - - - 0.0050 0.0148 0.0245 0.0525 0.1010 0.1088 0.1215 0.1518 0.1518
50 - - - - - - - - - - 0.0099 0.0197 0.0480 0.0969 0.1048 0.1177 0.1483 0.1483
55 - - - - - - - - - - - 0.0099 0.0386 0.0882 0.0963 0.1093 0.1404 0.1404
60 - - - - - - - - - - - - 0.0294 0.0802 0.0885 0.1018 0.1336 0.1336
65 - - - - - - - - - - - - - 0.0528 0.0614 0.0752 0.1083 0.1083
70 - - - - - - - - - - - - - - 0.0093 0.0244 0.0603 0.0603
75 - - - - - - - - - - - - - - - 0.0175 0.0591 0.0591
80 - - - - - - - - - - - - - - - - 0.0552 0.0552
>84 - - - - - - - - - - - - - - - - 0.0000
National Cancer Institute; 1999.
14. The Research Group for Population-based Cancer Registration in Japan. Cancer incidence and incidence rates in Japan in 1995: estimates based on data from nine population-based cancer registries.
Jpn J Clin Oncol 2000;30(7): 318-21.
15. . .
1999.
16. , .
. 2000;22(2): 124-35.
17. Parkin DM, Chen VW, Ferlay J, Galceran J, Storm HH, Whelan SL. Comparability and Quality Control in Cancer Registration. Lyon: IARC; 1994.
18. Jensen OM, Parkin DM, MacLennan R, Muir CS, Skett RG. Cancer Registration: Principles and Methods. Lyon: IARC; 1991, p.22-8.
19. Goldberg ID, Levin ML, Gerhardt PR. The probability of developing cancer. J Natl Cancer Inst 1956;17:155-7.
20. Zdeb MS. The probability of developing cancer. Am
22. Kramer M, von Korff M, Kessler L. The lifetime prevalence of mental disorders: estimation, uses and limitations. Psychol Med 1980;10:429-35.
23. Ries LAG, Kosary CL, Hankey BF, Miller BA, Harras A, Edwards BK. SEER Cancer Statistics Review, 1973-1994: Tables and Graphs, NIH Pub.
No. 97-2789, Bethesda: National Cancer Institute;
1997.
24. Parker SL, Tong T, Bolden S, Wingo PA. Cancer statistics, 1997. CA Cancer J Clin 1997;47:5-27.
25. Gail MH, Brinton LA, Byar DP, Corle DK, Green SB, Schairer C, et al. Projecting individualized probabilities of developing breast cancer for white females who are being examined annually. I Natl Cancer Inst 1989;81:1879-89.
26. Parkin DM, Whelan SL, Ferlay J, Raymond L, Young J. Cancer Incidence in Five Continents. Vol VII. Lyon: IARC; 1997, p.316-7.
27. Pokras R. Hysterectomy, Past, Present, and Future.
Stat Bull Metrop Insur Co; 1989, p.12-21.