Biomedical Science Letters 2014, 20(3): 147~155 http://dx.doi.org/10.15616/BSL.2014.20.3.147 eISSN : 2288-7415
Comparison Analysis of Immune Cells between CT26 Tumor Bearing Mice and Normal Mice
Na Kyung Lee
1and Hong Sung Kim
2,†1Department of Biomedical Laboratory Science, Soon Chun Hyang University, Asan 336-745, Korea,
2Department of Biomedical Laboratory Science, Korea Nazarene University, Cheonan 331-718, Korea
It has well studied that immune cells are strongly related to tumor progression and tumor suppression. To identify the difference of immune cell between tumor bearing mice and normal mice, we examined systemically the immune cell of CT26 tumor bearing mice on 21 days after tumor cell administration. As previously reported, CD4+ and CD8+ T cells population of tumor bearing mice significantly decreased 38% and 30% on day 21 compared to that of normal mice, respectively. All subpopulation of CD4 and CD8+ T cell significantly decreased, except CD49b+ T cell subpopulation.
But, myeloid cell population (CD11bhigh and all Gr-1+ subpopulation) of tumor bearing mice significantly increased on day 21. Especially, all subpopulation of CD11b+Gr-1+ cell of tumor bearing mice significantly increased on day 21.
Also, Foxp3+CD25high CD4 T cell (regulatory T cells) population significantly increased on day 21. These results suggest that tumor can induce the decline of T lymphocyte and the expansion of myeloid cells and regulatory T cells, and provide the basic information for the study of tumor immunology.
Key Words: Tumor bearing mice, T cell, Regulatory T cells, Myeloid cell
INTRODUCTION
The association of immune system in tumor development has been well reported, but there is no direct evidence between tumor development and its alleviation of immune system (Whiteside, 2006). It is clear that hosts generally use the immune response against the tumor. Tumor-specific cytotoxic T cell was identified in cancer bearing host (Naito et al., 1998; Kim et al., 2009; Heo et al., 2012). But, many tumor-associated antigen are largely self-antigen, there- fore tumor-associated antigen-specific immune responses are tolerant (Dunn et al., 2002; Willimsky and Blankenstein,
2005). Also, tumors have complicated environments, com- prising cancer cells and stromal cells. In addition, tumor infiltrating immune cells and the host's immune system reaction to the tumor are also complicated. The host immune system plays a dual role of tumor eradication or tumor promotion (Coussens and Werb, 2002; Buell et al., 2005). There is much evidence that a lack of immune surveillance in individuals shows high risk for cancer.
It is clear that T lymphocyte precursors capable of responding to self-antigens are enriched in tumor tissues.
The host is immunocompetent, but tolerance to self-antigen prevents effective anti-tumor immunity. Pre-malignant and early tumor lesions are generally well infiltrated with immune cells, largely T lymphocytes, macrophages and dendritic cells (Kulbe et al., 2004). Tumor-infiltrating lymphocytes (TIL), are considered to be a component of an inflammatory host response to the tumor (Klebanoff et al., 2006). Tumor produces chemotactic factor that recruit mononuclear cells (Balkwill, 2004). But, the role of the immune system
Original Article
*Received: August 25, 2014 / Revised: September 25, 2014 Accepted: September 25, 2014
†Corresponding author: Hong Sung Kim. Department of Biomedical Laboratory Science Korea Nazarene University 456 Ssangyong-Dong, Seobuk-Gu, Cheonan-City, Chung Nam 331-718, Korea.
Tel: +82-41-570-4165, Fax: +82-41-570-4258 e-mail: hskim@ kornu.ac.kr
○CThe Korean Society for Biomedical Laboratory Sciences. All rights reserved.
protecting host from tumor progression and metastasis remains controversial.
Mechanism responsible for immune cell dysfunction in patients with cancer are numerous and varied. Especially, regulatory T cells (Treg cells) or myeloid derived suppressor cells (MDSCs) have been shown to play a key role in down- regulation of anti-tumor immunity (Nomura and Sakaguchi, 2005; Nagaraj and Gabrilovich, 2007). Regulatory T cell (Treg) was identified as a population of CD4+ T cells with highly CD25 expression and preventing autoimmune disease.
Naturally occurring CD4+CD25high T reg, induced Treg, CD4+CD25high Treg cells in the periphery by conversion of CD4+CD25- T cells was categorized. In the mouse, CD25 is a good marker for regulatory T cells. As more specific regulatory T cell marker, the transcription factor Foxp3 has been identified as uniquely expressed in the mouse (Sakaguchi, 2005). Regulatory T cell actively inhibits CD4+
CD25- T cells, CD8+ T cells, dendritic cells, natural killer cells, and B cells. Local depletion of CD4+ T cells inside the tumor led to eradication of well-established tumors and development of long-term antitumor immunity (Sakaguchi and Sakaguchi, 2005; Yu et al., 2005). It has reported the suppression of antitumor immunity by regulatory T cells occurs predominantly at the tumor site and the local reversal of suppression can be an effective treatment. Whether there is a systemic increase of regulatory T cells in tumor bearing mice has not yet been clearly determined, as there have been conflicting reports.
Generally, immunosuppressive effects of tumors are best seen locally, at the tumor site. Most tumor infiltrating cell are activated T cells containing variable proportions of CD8+ and CD4+ T cells (Zippelius et al., 2004). Several groups have recently demonstrated the critical importance of CD4+ T cell in the induction and maintenance of antigen specific memory CD8+ T cells (Sallusto et al., 1999).
Activated T cells are antigen-experienced cells that lose CD62L expression. By contrast, Naïve CD8+ T cell have CD62L expression. NKT cells produce Th1 and Th2 cyto- kines after stimulation, and performed the important role in anti-tumor immunity (Moodycliffe et al., 1999). CD49b is well known as a common marker for NKT cells in NK1.1negative mice strains. But, several groups has also
reported that CD49b+ NKT cells are not typical CD1- dependent NKT cells (Pellicci et al., 2005).
Feature common to all MDSCs are their myeloid origin, immune state and a remarkable ability to suppress T cell responses (Youn and Gabrilovich, 2010; Youn et al., 2012).
MDSC promote tumor angiogenesis, tumor cell invasion, and metastasis (Murdoch et al., 2008; Nagaraj and Gabrilovich, 2010). MDSCs represent a part of the myeloid cell population, and are heterogeneous population. In healthy individuals, immature myeloid cells generated in bone marrow promptly differentiate into mature granulocytes, macrophages, or dendritic cells. Under pathological con- ditions, normal differentiation is blocked and the expansion of MDSC population results. (Nagaraj and Gabrilovich, 2007). In mice, MDSCs are characterized by the co- expression of the myeloid lineage differentiation antigen Gr-1 and CD11b. These cells make up only a small portion of spleen cells (2~4%). Recently, the role of MDSCs to facilitate the development of regulatory T cells has been described (Movahedi et al., 2008; Nagaraj et al., 2010).
There are no reports that showed the overall systemic differences of immune cells between tumor bearing mice and normal mice. In this report, we analyzed splenocytes of tumor bearing mice and normal mice to identify the systemic difference of the immune cell phenotype and detail sub- population on 21 days after CT26 tumor cell inoculation.
MATERIALS AND METHODS
Mice6~8 week old female Balb/c mice were purchased from OrientBio (Korea). Mice were housed and maintained under pathogen-free conditions and treated according to approved institutional protocols for animal care.
Cell lines
CT26 cell lines were obtained from the American Type Culture Collection (Manassas, VA). All cell lines were grown in DMEM containing 10% FBS, 10 mM L-glutamine, 100 U/ml Penicillin/streptomycin, and 0.1% Gentamicin.
Tumor studies
CT26 mouse colorectal cancer cells (3×10⁵) in 100 μl PBS were injected subcutaneously on the right flank of Balb/c mice. Tumors were measured in two dimensions in a blinded fashion using calipers as follows: tumor area (mm2) = length × width. All experiments were repeated two or three times.
Evaluation of immune cell phenotype
Mice were sacrificed at 21 days after tumor cell injection and spleen were collected aseptically and homogenized and pass through a mesh to take single-cell suspensions.
After the cells were washed twice with PBS, erythrocytes were removed by treating RBC lysis buffer (20 mM
Tris-HCl, 140 nM ammonium chloride) at 37℃ for 5 min and cells were labeled with the following mAbs: APC- conjugated anti-CD4, CD49b, and PE-conjugated CD8, CD25, Gr-1, and FITC-conjugated CD11b, CD62L, FoxP3.
All antibodies were purchased from eBiosciences. For FoxP3 staining, splenocytes were treated by using Foxp3 staining Buffer kit (eBioscience, San Diego, CA) according to the manufacturer's instructions. After splenocytes were stained cell surface antigen, add Foxp3 Fixation/permeabilization working solution to each tube and incubate at 4℃ for 30 min. After incubation, add 2 mL of 1× permeabilization buffer and centrifuge samples at 300 ×g at room tem- perature for 5 min. FITC conjugated ant-Foxp3 antibody was added, and incubate in the dark at room temperature for 30 min. Samples were acquired using a FACScaliburTM flow cytometer and CELLquestTM software, and FACS data was analyzed by Flowjo program.
Statistical analysis
The data are defined as the means ± S.E.M. Differences among the percentage of each immune cell population were analyzed using the two-tailed student's t-test. P values were considered significant at P<0.05:*, P<0.01:**, P<
0.001:***.
RESULTS
Systemic lymphocytic population between tumor bearing mice and normal mice on day 21
To check tumor area on day 21, we inoculated CT26 mouse colorectal cancer cell on the flank of Balb/c mice.
Tumors were measured with caliper on day 21. A palpable tumor was seen on 5~7 days after tumor cell inoculation.
An average tumor area on day 21 is 98.9±17 mm2. To identify the change of systemic immune cell in tumor bearing mice, we analyze lymphocytic population (CD4, CD8) from the spleen. We prepared splenocytes from CT26 tumor bearing mice and normal Balb/c mice on 21 days after tumor cell inoculation and conducted FACS analysis.
The percentage of CD4+ and CD8+ T cell population of tumor bearing mice decreased 37% and 30% on day 21 compared to that of normal mice (Fig. 1).
Fig. 1. The distinction of T lymphocyte between tumor bearing mice and normal mice. CT26 mouse colorectal cancer cells were administrated subcutaneously on the flank of Balb/c mice. The splenocytes were collected on 21 days after tumor inoculation, and a representative dot plot and the percentage of individual immune cell population (CD4, CD8 positive population) was analyzed by flow cytometry. Three mice are used for each experi- ment group. The results are depicted as mean ± S.E.M. of three independent experiments. Tumor bearing mice versus normal mice;
*P<0.05.
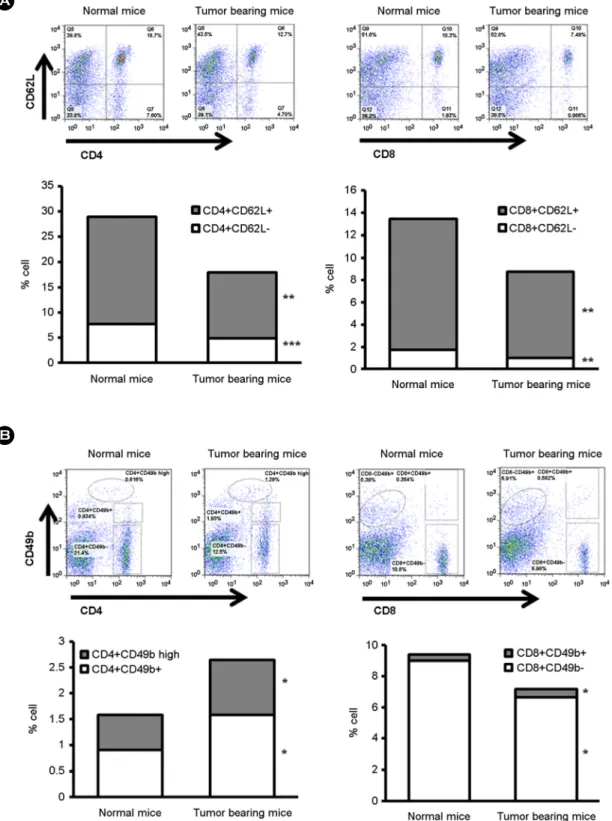
Fig. 2. The variation of CD62L and CD49b expression in the CD8+ T cell on tumor bearing mice. Mice were treated by described Fig. 1. The splenocytes were collected on 21 days after tumor cell inoculation and the percentage of individual immune cells was analyzed by flow cytometry. (A) A representative dot plot and the percentage of CD62L expression in the CD4+ and CD8+ cell population. (B) A representative dot plot and the percentage of CD49b expression in the CD4+ and CD8+ cell population. Three mice are used for each experiment group. The results are defined as mean ± S.E.M. of three independent experiments. Tumor bearing mice versus normal mice;
*P<0.05, **P<0.01, ***P<0.0001.
Fig. 3. The variation of myeloid cell on population tumor bearing mice. Mice were treated by described Fig. 1. The splenocytes were collected on 21 days after tumor cell inoculation and the percentage of individual immune cells was analyzed by flow cytometry. (A) A representative dot plot and the percentage of CD11b+ cell population. (B) The representative dot plot and the percentage of Gr-1+ cell population. (C) A representative dot plot and the percentage of Gr-1 expression in the CD11b+ cell population. Three mice are used for each experiment group. The results are defined as mean ± S.E.M of three independent experiments. Tumor bearing mice versus normal mice; *P<0.05, **P<0.01, ***P<0.0001.
Systemic T cell subpopulation between tumor bearing mice and normal mice on day 21
Since tumor bearing mice decrease the percentage of lymphocytic cell population as previously well reported, we check the detail subpopulation of CD4+ and CD8+ T cells related to tumor growth. We collected splenocytes from tumor bearing mice and normal mice. On day 21 after tumor cell inoculation, total percentage of CD4+ T and CD8+ T cells decreased, and the overall distribution of CD4+ and CD8+ T cell subpopulation also decreased about 37% and 35% in tumor bearing mice regardless of CD62L expression pattern, respectively (Fig. 2A). But, the per- centage of CD49b+CD4+ and CD49b+CD8+ T cell sub- population of tumor bearing mice increased about 73% and about 35% compared to that of normal mice, respectively.
On day 21 after tumor inoculation, the percentage of CD49b+CD4low T cells of tumor bearing mice increased about 59% compared to that of normal mice (Fig. 2B). The percentage of CD49b-CD4+ T cell and CD49b-CD8+ T cell subpopulation decreased about 176% and 27% in tumor bearing mice, respectively.
Systemic myeloid cell population between tumor bearing mice and normal mice on day 21
To identify the change of systemic immune cell in tumor bearing mice, we analyze myeloid cell population (CD11b, Gr-1) from the spleen. The percentage of CD11bhigh cell population of tumor bearing mice increased 198% on day 21 compared to that of normal mice, but the percentage of CD11blow cell population is not changed between them (Fig. 3A). The percentage of Gr-1low, Gr-1med, and Gr-1high cell population of tumor bearing mice increased 23%, 77%, and 300% on day 21 compared to that of normal mice.
And we wanted to identify the detail subpopulation of CD11bGr-1 cell related to tumor growth. On 21 days after tumor administration, the percentage of CD11bhighGr-1low, CD11bhighGr-1med, and CD11bhighGr-1high cells of tumor bearing mice increased 143%, 178%, and 346% compared
to that of normal mice, respectively (Fig. 3C). Systemic regulatory T cell subpopulation between tumor bearing mice and normal mice on day 21
Since it is well reported that regulatory T cell population Fig. 4. The variation of Foxp3 and CD25 expression in the CD4+ T cell on tumor bearing mice. Mice were treated by described Fig. 1. The splenocytes were collected on 21 days after tumor cell inoculation and the percentage of individual immune cells was analyzed by flow cytometry. (A) A representative dot plot of CD4+ cell population and Foxp3 and CD25 expression in the CD4+ cell population. (B) The percentage of Foxp3+CD25high and Foxp3+CD25low CD4+ T cell population. Three mice are used for each experiment group. The results are defined as mean ± S.E.M.
of three independent experiments. Tumor bearing mice versus normal mice; *P<0.05.
is related to tumor progression, we check the detail sub- population of Foxp3CD25CD4+ T cells. We harvested splenocytes from tumor bearing mice and normal mice. On 21 days after tumor administration, the overall population of CD4+ T cells significantly decreased compared to that of normal mice. But, in the CD4+ T cell population, the percentage of Foxp3+CD25high CD4+ T cell increased (Fig.
4A). On 21 days after tumor inoculation, the percentage of Foxp3+CD25high CD4+ T cells of tumor bearing mice increased 36% compared to that of normal mice (Fig. 4B).
DISCUSSION
In this report, we showed the distinction of systemic immune cells between tumor bearing mice and normal mice, and identified the subpopulation of each immune cell related to tumor growth.
As previously reported (Alexander et al., 1993; Kandil et al., 2001; Gabrilovich and Nagaraj, 2009), in our hands, lymphocytic cell (CD4+ and CD8+ T cell) population of tumor bearing mice significantly decreased on day 21 com- pared to that of normal mice (Fig. 1). These data suggest that tumor growth may influence the negative proliferation of lymphocytic cell population.
The representative FACS data and the percentage of CD4+ and CD8+ T cells with CD62L expression showed that the percentage of both CD62L- (activated) T cell subpopulation and CD62L+ (naïve) T cell subpopulation remarkably decreased on day 21 irrespective of CD62L expression (Fig. 2A). These data showed that both activated T cells and naïve T cells are inhibited during tumor pro- gression. In case of CD49b (NK cell marker) expression, the percentage of CD49- T cell decreased. But, the per- centage of CD49b+CD4+ T cell and CD49b+CD8+ T cell increased (Fig. 2B). Our data show that NKT (T cell with CD49 expression) population expands during tumor pro- gression. This means that CD49b+ NKT cell population is related to inhibit tumor immunity. But the exact role of NKT cells involved in tumor growth is still controversial (Terabe and Berzofsky, 2008). In our study, CD49+ CD4low T cell subpopulation also increased. But, this cell subpopu- lation was not reported formerly, so much more research is
required.
Myeloid cells (CD11b+ and Gr-1+ cells) are hetero- geneous population, and are related to tumor progression (Gabrilovich and Nagaraj, 2009). CD11b+ cells are defined as granulocytic population. In our data, CD11b expression level is distinguished as CD11blow and CD11bhigh. Only CD11bhigh population is associated with tumor growth. Gr-1 expression level is distinguished as Gr-1low, Gr-1med, and Gr-1high (Fig. 2A). All Gr-1+ population are associated with tumor growth. Especially, Gr-1med, and Gr-1high population remarkably increased during tumor progression (Fig. 2B). In case of CD11b+Gr-1+ cells, CD11bhighGr-1high and CD11b+
Gr-1med significantly increased. There is no difference of CD11blowGr-1- population between tumor bearing mice and normal mice. These data show that CD11b+Gr-1+
subpopulation are related to tumor progression.
We identified the systemic change of Foxp3+CD25+
CD4+ T cell of tumor bearing mice. Our FACS data show that Foxp3+CD25+CD4+ T cell was divided Foxp3+
CD25high and Foxp3+CD25low subpopulation. Only the per- centage of Foxp3+CD25high CD4+ T cell subpopulation of tumor bearing mice was remarkably increased on day 21 (Fig. 4A and 4B). These data showed that regulatory T cells defined as CD4+CD25+ T cells without regard to Foxp3 expression or Foxp3+CD25+ CD4+ T cell in the mouse tumor model were re-considered, and tumor bearing condition can induce the expansion of Foxp3+CD25high T cell to suppress the normal anti-tumor immune response.
In summary, our data showed the differences of detail subpopulation of immune cells between tumor bearing mice and normal mice, and Foxp3+CD25high CD4+ T cells and CD11b+Gr-1+ cells are major immune cells involved in the promotion of tumor growth and the suppression of anti-tumor immune responses, especially.
Acknowledgements
This research was supported by the Basic Science Research Program through the National Research Foundation of Korea (NRF), which is funded by the Ministry of Education, Science and Technology (2010005446), and by Korea Nazarene University Research Fund.
REFERENCES
Alexander JP, Kudoh S, Melsop KA, Hamilton TA, Edinger MG, Tubbs RR, Sica D, Tuason L, Klein E, Bukowski RM, Finke JH. T-cells infiltrating renal cell carcinoma display a poor proliferative response even though they can produce interleukin 2 and express interleukin 2 receptors. Cancer Research. 1993.
53: 1380-1387.
Balkwill F. Cancer and the chemokine network. Nature Reviews Cancer. 2004. 4: 540-550.
Buell JF, Gross TG, Woodle ES. Malignancy after transplantation.
Transplantation. 2005. 80: S254-264.
Coussens LM, Werb Z. Inflammation and cancer. Nature. 2002.
420: 860-867.
Dunn GP, Bruce AT, Ikeda H, Old LJ, Schreiber RD. Cancer immunoediting: From immunosurveillance to tumor escape.
Nature Immunology. 2002. 3: 991-998.
Gabrilovich DI, Nagaraj S. Myeloid-derived suppressor cells as regulators of the immune system. Nature Reviews Immunology 2009. 9: 162-174.
Heo CK, Bahk YY, Cho EW. Tumor-associated autoantibodies as diagnostic and prognostic biomarkers. BMB Reports. 2012.
45: 677-685.
Kandil A, Bazarbashi S, Mourad WA. The correlation of epstein- barr virus expression and lymphocyte subsets with the clinical presentation of nodular sclerosing hodgkin disease.
Cancer. 2001. 91: 1957-1963.
Kim HS, Kim-Schulze S, Kim DW, Kaufman HL. Host lympho- depletion enhances the therapeutic activity of an oncolytic vaccinia virus expressing 4-1bb ligand. Cancer Research.
2009. 69: 8516-8525.
Klebanoff CA, Gattinoni L, Restifo NP. Cd8+ t-cell memory in tumor immunology and immunotherapy. Immunological Reviews. 2006. 211: 214-224.
Kulbe H, Levinson NR, Balkwill F, Wilson JL. The chemokine network in cancer--much more than directing cell movement.
The International Journal of Developmental Biology 2004.
48: 489-496.
Moodycliffe AM, Maiti S, Ullrich SE. Splenic nk1.1-negative, tcr alpha beta intermediate cd4+ t cells exist in naive nk1.1 allelic positive and negative mice, with the capacity to rapidly secrete large amounts of il-4 and ifn-gamma upon primary tcr stimulation. Journal of Immunology. 1999. 162: 5156-5163.
Movahedi K, Guilliams M, Van den Bossche J, Van den Bergh R, Gysemans C, Beschin A, De Baetselier P, Van Ginderachter JA. Identification of discrete tumor-induced myeloid-derived suppressor cell subpopulations with distinct t cell-suppressive activity. Blood. 2008. 111: 4233-4244.
Murdoch C, Muthana M, Coffelt SB, Lewis CE. The role of myeloid cells in the promotion of tumour angiogenesis. Nature Reviews Cancer. 2008. 8: 618-631.
Nagaraj S, Gabrilovich DI. Myeloid-derived suppressor cells.
Advances in Experimental Medicine and Biology 2007. 601:
213-223.
Nagaraj S, Gabrilovich DI. Myeloid-derived suppressor cells in human cancer. Cancer Journal. 2010. 16: 348-353.
Nagaraj S, Schrum AG, Cho HI, Celis E, Gabrilovich DI.
Mechanism of t cell tolerance induced by myeloid-derived suppressor cells. Journal of Immunology 2010. 184: 3106 -3116.
Naito Y, Saito K, Shiiba K, Ohuchi A, Saigenji K, Nagura H, Ohtani H. Cd8+ T cells infiltrated within cancer cell nests as a prognostic factor in human colorectal cancer. Cancer Research. 1998. 58: 3491-3494.
Nomura T, Sakaguchi S. Naturally arising cd25+cd4+ regulatory T cells in tumor immunity. Current Topics in Microbiology and Immunology 2005. 293: 287-302.
Pellicci DG, Hammond KJ, Coquet J, Kyparissoudis K, Brooks AG, Kedzierska K, Keating R, Turner S, Berzins S, Smyth MJ, Godfrey DI. Dx5/cd49b-positive t cells are not synony- mous with cd1d-dependent nkt cells. Journal of Immunology 2005. 175: 4416-4425.
Sakaguchi S. Naturally arising foxp3-expressing cd25+cd4+ regu- latory t cells in immunological tolerance to self and non-self.
Nature Immunology 2005. 6: 345-352.
Sakaguchi S, Sakaguchi N. Regulatory t cells in immunologic self-tolerance and autoimmune disease. International Reviews of Immunology 2005. 24: 211-226.
Sallusto F, Lenig D, Forster R, Lipp M, Lanzavecchia A. Two subsets of memory t lymphocytes with distinct homing potentials and effector functions. Nature. 1999. 401: 708-712.
Terabe M, Berzofsky JA. The role of nkt cells in tumor immunity.
Advances in Cancer Research. 2008. 101: 277-348.
Whiteside TL. Immune suppression in cancer: Effects on immune cells, mechanisms and future therapeutic intervention. Seminars in Cancer Biology. 2006. 16: 3-15.
Willimsky G, Blankenstein T. Sporadic immunogenic tumours avoid destruction by inducing t-cell tolerance. Nature. 2005.
437: 141-146.
Youn JI, Collazo M, Shalova IN, Biswas SK, Gabrilovich DI.
Characterization of the nature of granulocytic myeloid-derived suppressor cells in tumor-bearing mice. Journal of Leukocyte Biology 2012. 91: 167-181.
Youn JI, Gabrilovich DI. The biology of myeloid-derived sup- pressor cells: The blessing and the curse of morphological and functional heterogeneity. European Journal of Immunology 2010. 40: 2969-2975.
Yu P, Lee Y, Liu W, Krausz T, Chong A, Schreiber H, Fu YX.
Intratumor depletion of cd4+ cells unmasks tumor immuno- genicity leading to the rejection of late-stage tumors. The Journal of Experimental Medicine 2005. 201: 779-791.
Zippelius A, Batard P, Rubio-Godoy V, Bioley G, Lienard D, Lejeune F, Rimoldi D, Guillaume P, Meidenbauer N, Mackensen A, Rufer N, Lubenow N, Speiser D, Cerottini JC, Romero P, Pittet MJ. Effector function of human tumor- specific cd8 t cells in melanoma lesions: A state of local functional tolerance. Cancer Research. 2004. 64: 2865-2873.