폐쇄성 폐질환은 주로 기류폐쇄와 호흡곤란을 특징으로 하 는 질환으로 중심소엽성 폐기종, 범소엽성 폐기종, 천식, 폐쇄 성 세기관지염 등을 포함한다. 국내에서의 유병률은 정확히 알 려졌지 않으나 비교적 흔한 질환으로 만성폐쇄성폐질환 (Chronic obstructive lung disease, COPD)의 경우 2002년에 시행한 전국 실태조사에 따르면 그 유병률이 8.7%로 보고되 고 있으며 주요 원인인 흡연인구가 여전히 많기 때문에 지속 적으로 유병률이 높을 것으로 예상한다(1). 최근 이러한 폐쇄 성 폐질환을 진단하는 영상검사로 전산화단층촬영이 많이 사 용되고 있다. 폐쇄성 폐질환의 진단에 쓰이는 주요 전산화단층 촬영술(Computed tomography: CT) 의 영상 특성은 폐 실질 의 파괴나 혹은 과 팽창으로 말미암은 비정상적으로 낮은 저 음영부위의 존재와 그 특징을 파악하는 것이다(2). 그러나 저 음영부위는 다양한 폐쇄성 질환에서도 보이는 소견이며 그 분
포 및 모양 등의 특징을 이용한 감별진단의 정확도는 제한적 인 것으로 알려졌다(3). 보다 더 객관적인 방법으로 CT 영상 을 컴퓨터 프로그램을 이용하여 그 질감 특성을 추출하는 방 법이 소개되고 있으며 Chabat 등(4)은 이를 폐쇄성 폐질환의 감별진단에 시도한바 있다. 그러나 그 이후에 다른 연구자들이 검증한 적은 저자들이 아는 한 없으며 국내에서 같은 연구가 시도된 적도 없다. 따라서 이번 연구의 목적은 질감적 특성을 기반으로 한 자동분류시스템을 개발하고 다양한 폐쇄성 폐질 환을 감별 진단하는데 있어서 이 시스템의 정확도 및 유용성 을 검증하는 것이다.
대상과 방법
자동분류시스템 개발
본 연구에서 Microsoft Windows XP 기반의 Visual C++을 이용하여 프로그램을 개발하였으며 보조 라이브러리로 Open Source인 Insight ToolKit(ITK)의 전처리 필터(median filter) 등 을 이 용 하 였 다 . 의 학 영 상 전 송 규 격 (digital image communication in medicine: DICOM) 의료 영상에게 맞는 12Bit 기반의 질감특성 추출프로그램을 개발하였다. 질감특성
고해상 CT 영상의 질감특성에 기반한 폐쇄성 폐질환의 자동분류 시스템의 개발에 관한 연구
1박성훈1,2・서준범・김남국・이준구3・이영경1,4・김성수1,5・채은진
목적: 고해상 CT 영상의 질감적 특성을 기반으로 컴퓨터 보조기법을 이용하여 폐쇄성 폐질환 을 자동으로 판별하는 방법을 개발하고 이 시스템의 정확도 및 유용성을 검증하고자 하였다.
대상과 방법: 질감적 특성을 이용한 분석을 위하여 히스토그램기반특성, 경계기반특성, run-
length 기반특성, co-occurrence기반특성을 이용하였다. Bayesian 분류기를 이용하여 자동화 분류를 시행하였다. 17명의 건강한 사람(영상수 n=67), 26명의 폐쇄성 세기관지염 환자 (n=70), 28명의 경증 중심소엽성 폐기종 환자(n=65), 21명의 중증 중심소엽성 폐기종 환자 또는 범소엽성 폐기종환자(n=63)에서 얻어진 265개의 HRCT영상을 사용하여 분석하였으며, 5 fold cross-validation 방법을 사용하여 수행능을 평가하였다. 각 대상군별로 진단의 민감도 를 알아보았고 전체 시스템의 정확도는 kappa 통계법을 이용하여 알아보았다.
결과: 각각의 질환군과 정상군에서 민감도는 정상 폐 84.9%, 폐쇄성 세기관지염 83.8%, 경증 중심소엽성폐기종 77.0%, 전소엽성폐기종 또는 중등도 중심소엽성폐기종 95.8%였다. 각 대상 군을 진단하는데 전체적인 수행능은 kappa 치가 0.779 였다.
결론: HRCT 영상의 질감적 특성을 기반으로 폐쇄성 폐질환을 구별하는 자동분류 시스템을 개 발하였다. 이 시스템을 이용하여 다양한 폐쇄성 폐질환과 정상 폐를 감별할 수 있다.
1울산대학교 의과대학 서울아산병원 방사선과학교실, 방사선의학연구소
2원광대학교 의과대학 원광대학병원 방사선과학교실
3서울대학교 의과대학 방사선과학교실
4포천중문 의과대학 분당차병원 진단방사선과학교실
5충남대학교 의과대학 충남대학교병원 진단방사선과학교실
이 논문은 2005년 정부(교육인적자원부)의 재원으로 한국학술진흥재단의 지 원을 받아 수행된 연구임”(KRF-2005-003-E00188)
이 논문은 2006년 12월 11일 접수하여 2007년 5월 9일에 채택되었음.
의 추출의 대상이 되는 폐 영역은 큰 혈관이 지나거나 폐 벽 에 붙어있는 경우를 제외하고자 영상 값의 범위를 -1,024~- 400 HU로 한정하였으며 이러한 방법을 통해 폐 실질 부분만 을 추출하여 그 부분에 대해서만 질감적 특성을 구하였다(5).
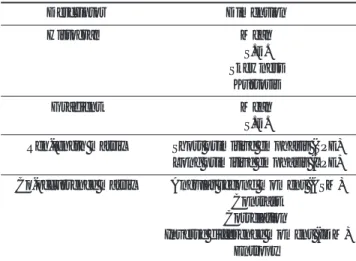
질감특성 추출프로그램을 이용하여 13가지 영상의 특징을 나 타내주는 지표를 얻었다 (Table 1) (6, 7). 이는 크게 CT 값 의 분포를 기반으로 한 히스토그램 기반 특성 (평균, 표준편차, Skewness (왜도), Kurtosis (첨도)), 경계영상(Gradient image)으로부터 얻은 경계기반 특성(평균, 표준 편차), Run- length matrix를 기반을 한 특성(short primitive emphasis, long primitive emphasis), 및 co-occurrence matrix를 기반 을 한 특성 지표 (angular second moment, contrast, correlation, IDM(inverse difference moment), entropy) 등을 포함하였다.
본 연구에서는 Bayesian 분류기를 이용하여 자동화 분류를 시행하였다. Bayesian 분류기는 통계적인 정보를 이용하여 최 적화된 경계를 계산한다. 학습에 사용된 데이터에서, 각각 정의 된 각 클래스-조건 분포의 각 클래스가 최우도를 갖는 최적화 된 매개변수 값을 계산한다. 이 Bayesian 판별 함수는 클래스- 조건 분포와 각 클래스의 확률에 의해 결정된다. 일반적으로 Bayesian 결정 이론은 이상적인 학습 방법으로 여겨진다.
대상질환 및 대상영상영역의 선정
이 연구는 임상시험 윤리위원회(IRB)의 승인이 필요하지 않 았으며 후향적인 연구의 특성으로 환자의 승인도 필요하지 않 았다. 17명의 건강한 사람(영상수 n=67), 26명의 폐쇄성 세 기관지염환자(n=70), 28명의 경증 중심소엽성 폐기종 환자 (n=65), 21명의 중증 중심소엽성 폐기종 환자 또는 범소엽성 폐기종환자 (n=63)에서 얻어진 고해상전산단층촬영 (high resolution computed tomography: HRCT)영상을 후향적으로 선택하였다. 16열 다절편 CT (Sensation 16, Siemens, Germany)를 이용하였으며, 검출기 폭은 0.75 mm로 하였으 며, sharp kernel(B70f)을 사용하였다. 두 명의 숙련된 흉부영 상의학 전문의가 상호동의 하에 특징적인 질병군의 영상을 선
택하였으며 각 영상에서 정사각형의 대표 관심영역(64×64 pixel)을 선정하였다.
265개의 ROI는 영상의 중복을 피하고자 영상당 하나씩 선 택하였으며 한 환자에서 여러 ROI를 선택하는 경우 다른 폐엽 영역을 선택하도록 하였다.
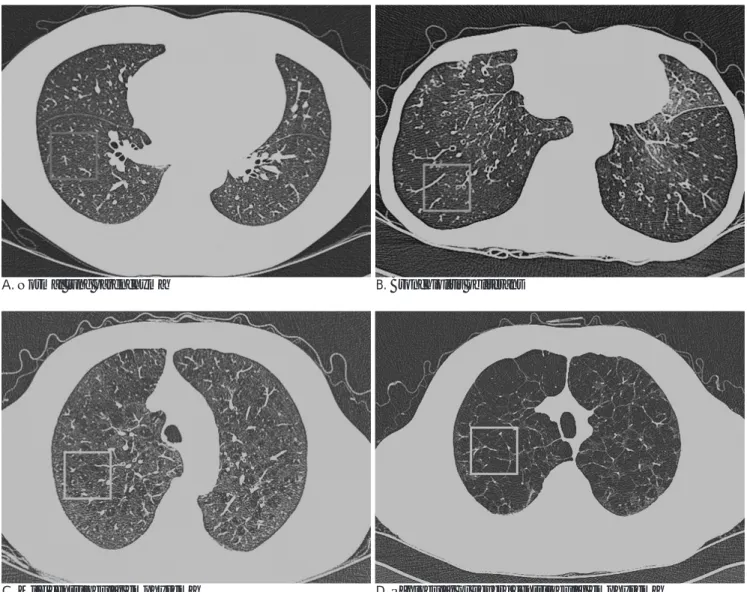
이 네 대상군의 영상이 보여주는 시각적 특성은 Fig. 1에 실 려 있다. Fig. 1A는 정상인 폐실질 CT 이며, Fig. 1B에서 보이 는 폐쇄성 세기관지염은 공기 폐색과 관류저하로 인하여 균질 한 저 음영을 보인다(8). Fig. 1C의 경증 소엽중심성 폐기종은 불규칙한 작은 원형에 가까운 폐 파괴를 보이는 조그마한 저 음 영부위로 정상 폐 조직 사이에서 보인다. 범소엽성 또는 중증 소엽중심성 폐기종은 Fig. 1D에서 보듯이 균일한 저 감쇠를 보 이는 폐 부위, 또는 얇은 경계 막이 있는 낭으로 보인다(9).
시스템 검증 및 분석
개발된 프로그램의 수행능을 평가하고자 5-fold cross- validation방법을 사용하였다. 즉, 대상군 별로 무작위로 5개의 작은 조로 나눈 후 이 중 4개의 조를 합하여 분류시스템을 교 육한 후 남은 한 개의 조에 적용하여 진단능을 분석하는 방법 이다. 이러한 분석은 각각의 조에 대해서 반복되었으며 이 결 과를 평균하였으며 각 대상군을 진단하는 데 있어서 민감도, 특이도를 분석하였다. 전체적인 수행능의 평가를 위하여 카파 통계학를 이용하여 대상 군간의 일치도를 알아보았다. 이러한 분류법을 기준으로 영상에 포함된 전폐에 각 질환영역을 컬러 로 표시하는 분류지도기법을 개발하여 적용하였다.
결 과
개발된 자동분류시스템의 대상군별 민감도와 특이도는 Table 2에 실려있다. 평균민감도는 85.3%였다. 각각의 질환군 과 정상인에서 민감도는 정상 폐 84.9%, 폐쇄성 세기관지염 83.8%, 경증 중심소엽성폐기종 77%, 전소엽성폐기종 또는 중 증중심성폐기종 95.8%로 나타났으며, 특이도는 정상폐에서 95.5%, 폐쇄성 세기관지염 92.4%, 경증 중심소엽성폐기종 93.3%, 전소엽성폐기종 또는 중증 중심성폐기종 95.5%로 나 타났다. Kappa 통계법을 이용한 일치도 분석에서 이 시스템이 대상군을 분류하는 일치도는 0.779로 우수하였다.
이러한 분류법을 기준으로 영상에 포함된 전폐에 각 질환영 역을 칼라로 표시하는 분류지도기법을 개발하여 적용하였을 때 의 결과는 Fig. 2와 같이 표현된다. Fig. 2A에서 정상 폐는 잘 Table 1. List of 13 Textural Features
Descriptor Dimension
Histogram Mean
S.D.
Skewness Kurtosis
Gradient Mean
S.D.
Ren-length matrix Short primitive emphasis (SPE) Long primitive emphasis (LPE) Co-occurrence matrix Angular second moment (ASM)
Contrast Correlation
Inverse difference moment (IDM) Entropy
Table 2. Class-specific Sensitivity, Specificity in Diagnosis of Each Disease
Diagnosis Sensitivity (%) Specificity (%)
Normal lung 84.9 95.5
Bronchilolitis obliterans 83.8 92.4 Mild centrilobular emphysema 77.0 93.3 Panlobular emphysema or 95.8 95.5 severe centrilobular emphysema
Overall sensitivity -85.3% kappa value -0.77
분류되어 보이며, 폐쇄성 세기관지염은 Fig. 2B에서 대부분 잘 분리되어 보이며, 일부 주 기관지나 늑막주변부에서 정상 폐나 경증 중심소엽성 폐기종으로 인지 되었다. Fig. 2C에서 경증 중심소엽성 폐기종은 대부분 잘 분류되어 보이며, 일부 균일한 저 음영 부위와 큰 공기 낭은 폐쇄성 세기관지염 또는 범소엽 성 폐기종으로 표현되었다. Fig. 2D에서 중증 폐기종은 대부분 중증 폐기종으로 분류되었다.
고 찰
본 연구는 질감적 특성을 이용하여 폐쇄성 폐질환을 구분할 수 있는 자동 분류 시스템을 개발하였으며, 세 가지 유형의 폐 쇄성 폐질환군과 정상군의 구분에 정상폐 84.9%, 폐쇄성 세기 관지염 83.8%, 경증 중심소엽성폐기종 77%, 전소엽성폐기종
또는 중증중심성폐기종 95.8%로 높은 민감도를 보였으며, 평 균민감도는 85.3%였다. 이는 경험 많은 판독자가 CT 소견에 근거하여 주관적으로 폐쇄성 폐질환을 평가한 논문에서 정상 폐 80% 폐쇄성 세기관지염 92% 중심소엽성 폐기종 88% 전 소엽성폐기종 48%의 민감도를 보고한 결과와 필적하는 결과 를 보여준다(3). 더구나 이와 같은 자동분류시스템은 주관적 인 평가와는 달리 재현성이 매우 높다는 점에서 매우 고무적 인 결과라고 할 수 있다.
최근 CT 기법의 발전과 컴퓨터 기술의 발전에 힘입어 폐 결 절의 발견(10), 폐 결절의 용적 측정(11), 폐색전증의 진단 (12), 미만성 폐질환의 진단(13)등 다양한 영역에서 컴퓨터 보조 진단기법들이 개발 연구되고 있으며, 미만성 폐질환은 CT 영상을 판독자의 주관적인 판단에 의하지 않고 컴퓨터를 이용 하여 그 질감특성을 추출하고 이를 정량적으로 분석함으로써
A. Normal lung parenchyma B. Bronchiolitis obliterans
C. Mild centrilobular emphysema D. Panlobular or severe centrilobular emphysema
Fig. 1. Thin-section CT scans of the chest (window level, -850 HU; width, 400 HU). On each image, rectangular (64×64 pixel) highlight regions of interest (ROI) that is typical of a particular condition. (A) Normal lung parenchyma: The mean CT attenuation value of the lung parenchyma is higher than that in cases of obstructive lung disease. (B) Bronchiolitis obliterans: CT shows homo- geneously decreased lung attenuation. (C) Mild centrilobular emphysema: Clusters of small air cysts are visible between normal tissues. (D) Panlobular or severe centrilobular emphysema: Destruction of the lung parenchyma results in area of decreased atten- uation and / or relatively large air cysts.
간유리 음영, 망상음영, 정상 폐, 벌집 모양폐등의 다양한 병소 의 특징과 분포를 평가하려는 시도들이 진행되고 있다(14, 15).
또한, 폐질환뿐만 아니라 간 종양의 진단, 근이영양증의 진단, 국소 성 피질 이형성의 진단 등에 질감특성을 이용하는 시도 들이 보고되고 있다(16-18). 폐쇄성 폐질환에 대한 연구에서 도 단순 흉부 방사선 영상을 통하여 폐기종을 자동 식별하는 방법에서 출발하여(19), CT 영상을 질감특성을 분석할 때 자 동화 분류 시스템을 이용하면 기종성 폐 조직과 정상 폐 조직 구분 시 평균 97.9%의 높은 정확도를 확보할 수 있다는 보고 가 있다(20).
Chabat 등(4)은 폐 실질의 질감특성만을 고려 대상으로 삼 아 폐쇄성 폐질환과 정상군을 자동화 시스템을 통하여 정상 폐
89% 폐쇄성 세기관지염 72.6% 중심소엽성 폐기종 69.8% 전 소엽성페기종 54.7%의 민감도와 60.3%의 평균 민감도를 보 고하였다. 본 연구도 이와 비슷한 결과를 보였다. 하지만, 본 연구에서 평균 민감도는 85.3%로 좀 더 좋은 결과를 보였다.
그 이유로는 기존의 연구와는 달리 본 연구에서는 중증 중심 소엽성 폐기종과 범소엽성 폐기종을 한 군으로 분류하였는데 이와 같은 분류가 민감도를 향상시켰을 가능성이 있다. 또한, 기존의 연구와는 달리 본 연구는 5 fold cross-validation method를 이용하여 시스템을 평가하였는데, 이러한 평가법의 차이가 좀 더 나은 결과를 보인 이유의 하나일 수 있다.
또한, 본 연구에서 특정 ROI 부위뿐만 아니라 전체 폐 CT 영상에 대하여 자동화 분류 시스템을 적용하였을 때에도 각각
A. Normal lung parenchyma B. Bronchiolitis obliterans
C. Mild centrilobular emphysema D. Panlobular emphysema or severe centrilobular emphysema Fig. 2. Application of the classified result to original CT images with color-coded function. At every pixel, the semi-transparent col- or was coded by the classification result. (A) Most of the areas are labeled as normal lung at CT images of normal subject. (B) CT scan in a patient with bronchiolitis obliterans. Most of the parenchyma is labeled as bronchiolitis obliterans. Some areas in the vicinity of major bronchi and pleural surface are classified wrong as normal lung parenchyma or mild centrilobular emphysema.
(C) At CT image of mild centrilobular emphysema, most of the area is labeled as mild centrilobular emphysema. Some areas of lung with homogeneously decreased attenuation and large air cyst are classified as bronchiolitis obliterans or panlobular emphyse- ma. (D) At CT image of a patient with severe emphysema, most of the parenchyma is labeled as severe emphysema.
의 폐쇄성 폐질환과 정상 폐를 잘 구분하여 나타냄을 보여 주 었다. Chabat 등(4)도 비슷한 시도를 하였으나 그 연구에서는 기준 역치 이하를 보인 영역들은 분류를 포기함으로써 분류 할 수 없는 영역들이 있었다. 그러나 본 연구에서는 모든 폐 영역 에 대해서 분류를 시도하였으며 이때에도 각 영역을 비교적 잘 구분하였다. 이러한 결과는 폐쇄성 폐질환에서 질병의 감별진 단뿐만 아니라 질병패턴의 분포를 파악하거나 혹은 정량화된 중증도를 평가하는 데도 이 기법이 사용될 가능성을 보여준다.
본 연구의 제한점으로 각 대상군의 선정기준이 병리적인 확 진 없이 숙련된 흉부영상의학 전문의가 한 육안 분류에 토대 를 두었다는 점을 들 수 있다. 이러한 분류에 따른 주관적 육 안 평가의 신뢰도는 논란의 여지가 있다. 하지만, 폐 기능 검 사 등 다른 방법은 다양한 병리학적 원인을 지닌 폐쇄성 폐질 환을 신뢰도 있게 구분하지 못하며, 수술이나 침습적 방법을 통하여서 꼭 진단의 분류가 필요한 중증 질환이 아닌 가벼운 질환을 지닌 환자에게는 일상적 또는 윤리적으로 생검을 실시 하지 않는다. 더 나아가 진단이 확실시되는 질환들 사이에도 국부적인 차이가 존재하며, 폐기종 환자는 폐 여러 부위에 중 심소엽성 질환과 범소엽성 질환이 공존할 수도 있다. 그러므로 전문의의 CT 영상 평가는 나름의 한계가 있긴 하나 현 상황 에서 합리적인 참조 기준이라 생각된다(4). 또한, 본 연구에서 는 중증 중심소엽성 폐기종환자와 범소엽성 폐기종 환자를 같 은 군으로 구분하였으며, 이러한 구분은 진정한 기도폐쇄성질 환의 분류에 모순을 제공한다, 하지만 우리나라에서 범소엽성 폐기종 환자의 빈도는 매우 낮으며, 중증 중심소엽성 폐기종환 자의 CT 소견과 겹치는 부분이 많다, 본 연구의 목적은 각기 다른 영상의 특성이 있는 질환 군을 질감특성만을 고려하여 자 동화 분류 기법에 근거하여 구분하는데 의의를 두는 연구였으 나, 이러한 한계는 다음 연구에서 극복해야 할 과제라 생각한 다.
결론적으로 본 연구에서 폐쇄성 폐질환을 객관적인 영상정 보인 CT 영상의 질감적 특성을 분석하고 자동화 분류시스템 을 이용함으로써 구분할 수 있다는 것을 확인하였다. 이는 이 후에 다양한 폐쇄성 폐질환의 감별진단과 중증도 평가 등에 사 용될 수 있을 것으로 기대된다.
참 고 문 헌
1. National COPD Survey Committee, Korean Academy of Tuberculosis and Respiratory Diseases. Nationwide survey on the prevalence of COPD in Korea. Am J Respir Crit Care Med 2003;167(7):A237
2. Sakai N, Mishima M, Nishimura K, Itoh H, Kuno K. An automated method to assess the distribution of low attenuation areas on chest CT scans in chronic pulmonary emphysema patients. Chest 1994;
106:1319-1325
3. Copley SJ, Wells AU, Muller NL, Rubens MB, Hollings NP, Cleverley JR, et al. Thin-section CT in obstructive pulmonary dis-
ease: discriminatory value. Radiology 2002;223:812-819
4. Chabat F, Yang GZ, Hansell DM. Obstructive lung diseases; tex- ture classification for differentiation at CT. Radiology 2003;
228:871-877
5. Chabat F, Desai SR, Hansell DM, Yang GZ. Gradient correction and classification of CT lung images for the automated quantifica- tion of mosaic attenuation pattern. J Comput Assist Tomogr 2000;
24:437-447
6. Haralick RM. Statistical and structural approaches to texture. Proc IEEE 1979;67:786-804
7. Castellano G, Bonilha L, Li LM, Cendes F. Texture analysis of medical images. Clinical Radiology 2004;59:1061-1069
8. Hansell DM, Rubens M, Padley SPG, Wells AU. Obliterative bron- chiolitis: individual CT signs of small airways disease and function- al correlation. Radiology 1997;203:721-726
9. Stern EJ, Frank MS. CT of the lung in patients with pulmonary em- physema: diagnosis, quantification, and correlation with patholog- ic and physiologic findings. AJR Am J Roentgenol 1994;162:791-798 10. Raffy P, Gaudeau Y, Miller DP, Moureaux JM, Castellino RA.
Computer-aided dectection of solid lung nodules in lossy comcom- pressed multidetector computed tomography chest exams. Acad Radiol 2006;13:1194-1203
11. Fraioli F, Bertoletti L, Napoli A, Calabrese FA, Masciangelo R, Cortesi E, et al. Volumetric evaluation of therapy response in pa- tients with lung metastases. Preliminary results with a computer system (CAD) and comparison with unidimensional measure- ments. Radiol Med 2006;111:365-375
12. Masutani Y, MacMahon H, Doi K. Computerized detection of pul- monary embolism in spiral CT angiography based on volumetric image analysis. IEEE Trans Med Imaging 2002;21:1517-1523 13. Ashizawa K, MacMahon H, Ishida T. Effect of an artificial neural
network on radiologists’performance in the differential diagnosis of interstitial lung disease using chest radiographs. AJR Am J Roentgenol. 1999;172:1311-1315
14. Uchiyama Y, Katsuragawa S, Abe H, Shiraishi J, Li F, Li Q, et al.
Quantitative computerized analysis of diffuse lung disease in high- resolution computed tomography. Med Phys 2003;30:2440-2454 15. Delorme S, Keller-Reichenbecher MA, Zuna I, Schlegel W, Van
Kaick G. Usual interstitial pneumonia: quantitative assessment of high-resolution computed tomography findings by computer-as- sisted texture-based image analysis. Invest Radiol 1997;32:566-574 16. Huang YL, Chen J-H, Shen W-C. Diagnosis of hepatic tumors with
texture analysis in nonenhanced computed tomography images.
Acad Radiol 2006;13:713-720
17. Herlidou S, Rolland Y, Bansard J.Y, Le Rumeur E, De Certaines J.D. Comparison of automated and visual texture analysis in MRI:
characterization of normal and diseased skeletal muscle. Magn Reson Imaging 1999;17:1393-1397
18. Antel SB, Collins DL, Bernasconi N, Andermann F, Shinghal R, Kearney RE, et al. Automated detection of focal cortical dysplasia lesions using computational models of their MRI characteristics and texture analysis. Neuroimage 2003;19:1748-1759
19. Bergin CJ, Mu¨ller NL, Miller RR. CT in the qualitative assessment of emphysema. J Thorac Imaging 1986;1:94-103
20. Uppaluri R, Mitsa T, Sonka M, Hoffman EA, Mclennan G.
Quantification of pulmonary emphysema from lung computed to- mography images. Am J Respir Crit Care Med 1997;156:248-254
J Korean Radiol Soc 2007;57:21-26
Address reprint requests to : Joon Beom Seo, M.D., Department of Radiology, Research Institute of Radiology, Asan Medical Center, University of Ulsan College of Medicine, 388-1, Pungnap-dong, Songpa-gu, Seoul 138-736, Korea Tel. 82-2-3010-4400 Fax. 82-2-476-4719 E-mail: [email protected]
An Automated Classification System for the Differentiation of Obstructive Lung Diseases based on the
Textural Analysis of HRCT images
1Seong Hoon Park, M.D.1,2, Joon Beom Seo, M.D., Namkug Kim, M.D., June Goo Lee, M.D.3, Young Kyung Lee, M.D.1,4, Song-Soo Kim, M.D.1,5, Eun Jin Chae, M.D.
1Department of Radiology, Research Institute of Radiology, University of Ulsan, College of Medicine, Asan Medical Center
2Department of Radiology, Wonkwang University College of Medicine
3Department of Radiology, Seoul National University College of Medicine
4Department of Radiology, University of Pocheon Jungmoon College of Medicine, Bundang CHA Hospital
5Department of Radiology, Chungnam National University Hospital
Purpose: To develop an automated classification system for the differentiation of obstructive lung diseases based on the textural analysis of HRCT images, and to evaluate the accuracy and usefulness of the system.
Materials and Methods: For textural analysis, histogram features, gradient features, run length encoding, and a co-occurrence matrix were employed. A Bayesian classifier was used for automated classification. The images (image number n=256) were selected from the HRCT images obtained from 17 healthy subjects (n=67), 26 pa- tients with bronchiolitis obliterans (n=70), 28 patients with mild centrilobular emphysema (n=65), and 21 pa- tients with panlobular emphysema or severe centrilobular emphysema (n=63). An five-fold cross-validation method was used to assess the performance of the system. Class-specific sensitivities were analyzed and the overall accuracy of the system was assessed with kappa statistics.
Results: The sensitivity of the system for each class was as follows: normal lung 84.9%, bronchiolitis obliter- ans 83.8%, mild centrilobular emphysema 77.0%, and panlobular emphysema or severe centrilobular emphy- sema 95.8%. The overall performance for differentiating each disease and the normal lung was satisfactory with a kappa value of 0.779.
Conclusion: An automated classification system for the differentiation between obstructive lung diseases based on the textural analysis of HRCT images was developed. The proposed system discriminates well be- tween the various obstructive lung diseases and the normal lung.
Index words :Bronchiolitis obliterans
Computed tomography (CT), high-resolution Computers, diagnostic aid
Emphysema Lung, CT