Vol. 16, No. 4, 1972 Printed in Republic of Korea
汚濁河川水의 地球化學的인 硏究(第
IV報) 서울市內 河川水의 플루오르含量
李 龍 根•黄 圭 子*
*淑明女子大學校藥學大學
延世大學校 理工大學 化學科 (1970. 6. 19 接受)
Geochemical Investigation of Contaminated River Waters (Part IV) Fluorine Contents of River Water in Seoul
Yong Keun Lee and Kyu Ja Whang
Department of Chemistry, College of Science and Engineering, Yonsei University
(ReceivedJune 19, 1970)
Abstract Geo산lemical investigation of river waters and reservoirs in Seoul city on fluorine contents were conducted between June in 1969 and February in 1970-
Fluorine contents of most river waters and reservoirs in Seoul city were between 0. 09 and 0. 32 mg/L
It was found that fluorine contents of Han River and rivers running through the outskirt of the city were relatively less than those of the river waters running through the residential areas and the industrial areas.
Fluorine contents were less seasonaly variable than chlorine ones.
Some implications of those results were discussed in detail.
Introduction
Fluorine contents of drinking water1 in Seoul city, domestic salt2 and food3 were analyzed.
In 1968, Whang4 reported fluorine contents of 0. 07 to 0. 29 mg/1 of river water and industrial waste water in Seoul city.
This study was carried out to investigate the content and the distribution of fluorine of the river water in Seoul city a효d to serve as a basic material for the fluoridation to the authorities concerned.
Materials and Methods
1. Sampling Sites Five sites along Han River, 4 of reservoirs, 18 in 사比 northern residential eurea, and 8 in the southern industrial area were selected for sampling.
The places and the names of sampling sites can be seen in Fig. 1, Table 1 and 2.
2. Sampling and MMhods of Analysis A. Sampling of Water On the 21st and 22nd of June in 1969, sample waters were taken at 35 sites. At 23 sites including Kwangjang- Gyo sample waters were seasonaly taken from June in 1969 to February in 1970.
一 219 —
220 李龍根•黃圭子
The detailed procedure of sampling water was previously described5.
B. Methods of Analysis For the analysis, pre-treatment of sample waters followed the manner of a previous report5.
Fluorine was analyzed by means of extraction spectrophotometry with ALC (Alizarin Comple
xone)6. After transfering sample waters of 20 to 25 ml to a separating funnel, ALC-La solu
tion and N, N-diethylaniline-isoamylalcohol were added, and shaked for extraction of ALC-La-F complex. Subsequently, pH 4.4 buffer s시ution was added to the newly formed organic layer.
Aqueous layer was casted off after shaking the mixed solution. The absorbance of organic layer
was measured at 580 by using N, N-diethyl- aniline-isoamylalcohol as a reference.
Silica was analyzed by means of colorimetry with molybdenum yellow reaction.
Results and Discussion
1. Fluorine Contents of Reservoirs Results- for fluorine contents of reservoirs, are shown, in. Table 1.
Little difference of fluorine contents not only between natural and filtered water, but also, among all the reservoirs were observed.
However, the chlorine contents of reservoirs.
Journal of theKorean Chemical Society
Table 1. F-contents in reservoir Sample Sampled
No. at
Date of Water temp. 口 Cl F F/Cl
Sampling (°C) pH (mg/Z) (mg/Z) (xl〔L)
3 o o o 3 o o o 4 3 2
9 9 1 1 o o
3 5 8 5 3 2 3 5 3 3
1 1 o o
o o 9 o 3-3 3- 3-3- 4- 8 8 4 7 2 2 6-&
7-z 7-z 5 1 1 1 2 2 2 2 2 2 2 1 1
4 1 1 1
9 4 3 7 3 2 3 6 4 8
4 1 1 1 1
1 1 Q 2 1 1 3 3 o 3- 3- 4-43- 3-
55
2 2 3 4 4 6 o 8 7 6 L L 3 3
1 1 3 3 3 1 1 1 1 1 Q 5 5
5 5 7 6
L L L 2 2 7 9!
4 2 2 2 2 1 1
2 2
53 .80 .9222 L L L 09
09nn09 09 5 5
5 8 L L
&
7 6 2 2 1
7 1 5 0 6 5 8 o 2 2 3
5 1 1 1 1 1
7 9 2 3 o 1 o
1 1 1 L L 2 2 L 4
1 2 1 Wn
09 5
7
7 6
1 Kooui (N)*
(F)
**
1969. 6.
〃 21.
(N) 1969. 9. 22.
(F) //
(N) 1969. 11. 22.
(F) ff
(N) 1970. 2. 23.
(F) n
2 Dookseum (N) 1969. 6. 21.
(F) if
(N) 1969. 9. 22.
(F) (f
(N) 1969. 11. 22.
(F) 〃
(N) (F)
1970. 2.
n 23.
3 Bohkwang-Dong (N) 1969. 6. 21.
(F) if
(N) 1969. 9. 22.
(F) tf
(N) 1969. 11. 22.
(F)
(N) 1970. 2- 23.
(F) f!
4 Noryangjin (N) 1969. 6. 21.
(F) ff
(N) 1969. 9. 22.
(F) 〃
(N) 1969. 11. 22.
(F) ft
(N) 1970. 2. 23.
(F) !f
Potable water (Yonsei Univ.)
1969. 7. 5.
* (N) Natural water ** (F) Filtered water
at the upper stream of Han River were consid
erably different from those at the lower. This suggest that the lower stream has high density of chlorine contents of the water, owing to the disposal of city sewage into the stream. In November, reservoirs except Kooui reservoir which is located at the upper stream showed distinct increase in chlorine contents. This may be related to pickling season (Kimchi). In the case of fluorine contents, there were neither
seasonal variations nor locational differences.
Fluorine content of city water available on the campus of Yonsei University was 0.09 mg/L Fluorine content on the campus did not differ from that of sample water of reservoirs.
This suggest that fluoridation of city water has not yet taken place.
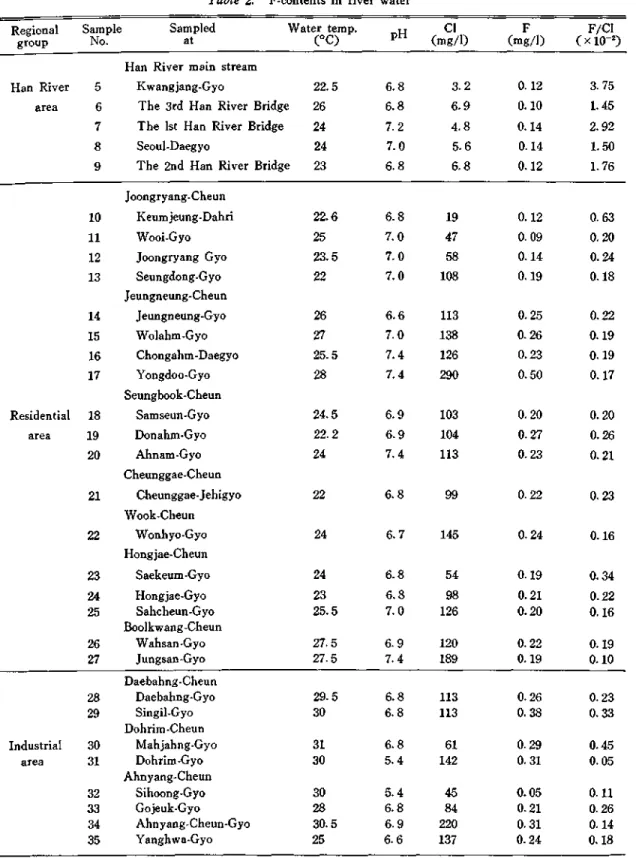
2. FluorineContents of RiverWater Table 2 shows fluorine contents of river waters in Seoul. The period of sampling covers the 21st
222 李龍根•黃圭子
Table2. F-contents in river water Regional Sample Sampled
group No. 차 t
Water temp. 口 Cl
(°C) 职(mg/1) F F/CI
(mg/1) (x 10-2) Han River main stream
Han River 5 Kwangjang-Gyo 22.5
area 6 The 3rd Han River Bridge 26 7 The 1st Han River Bridge 24
8 Seoul-Daegyo 24
9 The 2nd HanRiver Bridge 23 Joongryang-Cheun
10 Keumjeung-Dahri 22.6
11 Wooi-Gyo 25
12 Joongryang Gyo 23.5
13 Seungdong-Gyo 22
Jeungneung-Cheun
14 Jeungneung-Gyo 26
15 Wolahm-Gyo 27
16 Chongahm-Daegyo 25.5
17 Yongdoo-Gyo 28
Seungbook-Cheun
Residential 18 Samseun-Gyo 24.5
area 19 Donahm-Gyo 22.2
20 Ahnam-Gyo 24
Cheunggae-Cheun
21 Cheunggae-Jehigyo 22
Wook-Cheun
22 Wonhyo-Gyo 24
Hongjae-Cheun
23 Saekeum-Gyo 24
24 Hongjae-Gyo 23
25 Sahcheun-Gyo 25.5
Boolkwang-Cheun
26 Wahsan-Gyo 27.5
27 Jungsan-Gyo 27.5
6.8 3.2 0.12 3. 75
6.8 6.9 0.10 1.45
7.2 4.8 0.14 2.92
7.0 5.6 0.14 1.50
6.8 6.8 0.12 1.76
6.8 19 0.12 0. 63
7.0 47 0.09 0. 20
7.0 58 0.14 0. 24
7.0 108 0.19 0.18
6.6 113 0. 25 0.22
7.0 138 0. 26 0.19
7.4 126 0.23 0.19
7.4 290 0.50 0.17
6.9 103 0. 20 0. 20
6.9 104 0. 27 0.26
7.4 113 0.23 0.21
6.8 99 0. 22 0. 23
6.7 145 0. 24 0.16
6.8 54 0.19 0.34
6.8 98 0.21 0.22
7.0 126 0.20 0.16
6.9 120 0. 22 0.19
7-4 189 0.19 0.10
Daebahng-Cheun 28 Daebahn흥-Gyo 29 Singil-Gyo
Dohrim-Cheun Industrial 30 Mahjahng-Gyo
area 31 Dohrim-Gyo
Ahnyang-Cheun 32 Sihoong-Gyo 33 Gojeuk-Gyo 34 Ahnyang-Cheun-Gyo 35 Yanghwa-Gyo
5
5 o
1 o
O 8 5 2 3
3 3
3 2 3 2
8 8
8 4
成
6-5- 6- 6- 4 8 9 6
3 3
1 2
5 4 0 7 1 1
6 4
不
8 2 3 1 1
1
2 1
6 8
9 1
5 1 1 4 2 3
2 3
0 2 3 2 Q
Q
45 05
1 6 4 8 1 2 1 1
Journal of theKorean Chemical Society
Table3. Range and mean values of F-contents in river water
Regional group pH Cl
(mg/1)
F
(mg/1) F/C1
(XIE) Han River area 6- 8〜7. 2
6-9
3.2〜6.9 5.5
0.10〜0.14
0.12 1. 45〜3. 75 2.10 Residential area 6.6〜7. 4
7-0
19 〜290 114
0. 09〜0.50
0.20 0.10〜0. 63 0.23 Industrial area 5-4〜6. 9
6-5
45〜642 177
0. 05〜0. 38
0. 26 0.05〜0. 48 0.22
and 22nd of June 1969.
Average fluorine contents of regional groups are given in Table 3.
Fluorine content was the lowest in Han River and became larger from residential to industrial area. It is suggested that Han River is diluted with many tributary waters. The same tendency was confirmed in COD, contents of chlorine, bromine5, and copper7.
Major sources of fluorine contamination in residential area are considered to be attributable to human waste which chiefly contains salt (domestic crude salt contains 3.8~15 ppm, re
fined salt 2. 5-7.1 ppm of fluorine2), and parti
ally tooth paste and rodenticide.
Fluorine purees of river water running thro
ugh the industrial area are considered to be partially attributable to wastes of pharmaceutical, chemical, food processing, leather tanning, plants and paper mills* etc, besides domestic sewage of the city. The average fluorine contents in the industrial area was not much larger than that in the residential area. Judging from the above res니ts, there would be no large scale manufacturing plant using phosphate rock, quartzite, and fluoro apatite as raw materials.
However, there would be small scaled plant옹
manufacturing tooth paste, electric bulb, and rodenticide using fluorine compounds as a raw materials.
Detailed sources of fluorine in river water were previously described by Whang4.
Fig. 2 shows the results of samples on June in 1969 and its distribution of fluorine contents.
Fluorine contents of 4 reservoirs and Han River were between 0.10 and 0.14 mg/1 (except the June sample of 0.18mg/l at Dooksuem Reservoir). No significant differences in fluorine contents was found among them. This indicates that at the lower stream along Han River the fluorine contents are not influenced by sea water (sea water contains 18,980 mg/1 of chlorine and 1. 3 mg/1 of fluorine8).
Fluorine contents of 0.19 to 0- 27 mg/1 in the most residential area were larger than those of Han River.
Values of all the rivers are as follows.
Joongryang-Cheun contained from 0. 09 to 0.19 mg/1 of fluorine contents, Jeungneung-Cheun 0.23 to 0- 26 mg/1 (except Yongdoo-Gyo), Seungbook-Cheun 0.20 to 0.27 mg/1, and Cheunggae-Cheun 0.22 mg/1. Of those rivers Seungdong-Gyo was lower contents of 0.19 mg/L This suggest that it is because less con
taminated Joongryang-Cheun flows into Seung
dong-Gyo and much water lessen the relative density of fluorine contents. Besides these rivers, Wook-Cheun contains 0.24 mg/1, Hongjae- Cheun from 0.19 to 0. 21mg/l, and Boolkwang- Cheun. 0.19 to 0. 22 mg/1. In the case of Joong
ryang-Cheun running through the suburb, fluorine contents increased as it flowed from the upper stream to the populated lower stream.
There were little variations in other rivers. In
224 李龍根•黃圭子
the case of chlorine, the contents increased as the rivers flowed from upper to lower stream.
In the industrial area, the fluorine contents ranged from about 0.21 to 0.38 mg/L Daebah- ng-Cheun contained fluorine ranging from 0. 26 to 0.38 mg/1, Dohrim-Cheun 0.29 to 0.31 mg/1, Ahnyang-Cheun excluding Sihoong-Gyo 0. 21 to 0. 31 mg/1. The industrial area showed slightly larger contents than the residential area.
3. Seasonal and Hou이y Variation ofFluo rine Contents Fluorine contents of samples taken at 19 sites in시tiding Kwangjang-Gyo in June, September, November of 1969 and Febr
uary of 1970 are listed in Table 4.
Owing to the rainny June and September,
relatively much water caused chlorine contents and COD5 low. On the latter of November chlorine contents and COD reached the peak due to pickling season concomitantly with dry
season. For 놘此 reasons indicated above, chlo
rine contents and COD were larger in November.
This seasonal variation occurred more intensively in the residential area than in Han River, Fluo
rine contents were less variable than chlorine contents and COD.
Fluorine contents were hourly analyzed for 12 hours at Chongahm-Daegyo and Jeungneim횸-
Gyo on Jeungneung-Cheun from 8:00 A. M.
through 7:00 P・ M. on the J8th of November in 1969. For comparison, both hourly chlorine
Journah of theKorean Chemical Society
Table 4. Seasonal variation of F-contents hi river water Regional
group
Sample No..
Sampled
at Date of
Sampling
Water temp.
(°C) pH
Cl (mg/Z)
F (mg/Z)
F/Cl (xl0~2)
5 Kwangjang-Gyo 1969. 6. 21 22.5 6.8 3.2 0.12 3.75
n 9. 22 22 7.6 3.3 0.14 4.24
〃 11. 22 8.5 7.2 5.0 0.13 2. 60
1970. 2. 23 6 7.1 3.5 0.11 3.14
6 The 3rd Han River 1969. 6. 21 26 6.8 6.9 0.10 1.45
Bridge H 9. 22 24 7.5 7.7 0.09 1.17
// 11. 22 8 7.2 9.0 0.12 1.33
1970. 2. 23 7 6.8 5.8 0.10 1. 72
7 The 1st Han River 1969. 6. 21 24 7.2 4.8 0.14 2.92
Han River Bridge H 9. 22 21.5 7.7 4.5 0.15 3. 33
area It 11. 22 7.5 7.0 13 0.13 1.00
1970. 2. 23 6 7.1 4.9 0-11 2.24
8 Seoul-Dae 응 yo 1969. 6. 21 24 7.0 5.6 0.14 2.50
n 9. 22 21.5 7.7 5.1 0.11 2.16
n 11. 22 6 7.2 13 이 12 0.92
1970. 2. 23 6 7.2 6 0. 09 1. 50
9 The 2nd HanRiver 1969. 6. 21 23 6.8 6.8 0.12 1.76
Bridge // 9. 22 21.5 7.4 10.4 0.15 2.03
it 11. 22 8 7.2 13 0.13 1.00
1970. 2. 23 9 6.7 7.8 0.11 1- 41
11 Wooi-Gyo 1969. 6. 21 25 7.0 47 0. 09 0. 20
9. 22 24 7.4 36 0.13 0.36
H 11. 22 11 6.9 110 0.19 0.17
1970. 2. 23 — 一 — — —
12 Joongryang-Gyo 1969. 6. 21 23.5 7.0 58 0.u 0.24
if 9. 22 24.5 7.2 62 0.13 0.20
11. 22 10 6.9 95 0.11 0.12
1970. 2. 23 8 6.6 70 0.15 0.21
13 Seungdong-Gyo 1969. 6. 21 22 7.0 108 0-19 0.18
it 9. 22 23 7.1 66 0.10 0.15
〃 11. 22 9 7.0 144 0.14 0.10
Residential 1970. 2. 23 8 6.9 115 0.20 0.17
area 16 Chongahm-Daegyo 1969. 6. 21 25.5 7.4 126 0. 23 0.19
it 9. 22 23 7.5 214 0.23 0.11
H 11. 22 9 6.9 278 0.25 0.09
1970. 2. 23 15 7.5 226 0.25 0.11
19 Donahm-Gyo 1969. 6. 21 22.2 6.9 104 0.27 0.26
H 9. 22 21 7.4 91 0.21 0.23
H 11. 22 12 7.2 376 0.20 0. 05
1970. 2. 23 12 7.0 120 0.27 0.23
226 李龍根•黃圭子
20 Ahnam-Gyo 1969. 6. 21 24 7.4 113 0.23 0. 21
〃 9. 22 22 7.1 102 0.22 0. 21
it 11. 22 13 7.0 430 0.20 0. 05
1970. 2. 23 5 7.0 132 0.29 0.22
21 Cheunggae-Jehigyo 1969. 6. 21 22 6.응 99 0.22 0.23
〃 9. 22 23 7.0 93 0.18 0.19
n 11. 22 11.5 7.2 190 0. 21 0.11
1970. 2. 23 9 6.9 122 0.24 0.20
22 Wonhyo-Gyo 1969. 6. 21 24 6-7 146 0.24 0.16
K 9. 22 21 7.3 116 0.20 0.17
// 11. 22 10.5 6.9 202 0.16 o. oa
1970. 2. 23 5 6.9 153 0.16 0.1G
24 Hcngjae-Gyo 1969. 6. 21 23 6.8 98 0. 21 0.22
ff 9. 22 21 6.9 54 0.19 0. 35
// 11. 22 14 7-0 396 0.19 0. 05
1970. 2. 23 8 7.0 110 0.19 0.19
26 Wahsan-Gyo 1969- 6. 21 27.5 6.9 120 0.22 0.19
9. 22 21 7.2 102 0. 20 0. 20
rr 11. 22 11 6.8 295 0.19 0.06
1970. 2. 23 10 6.7 145 0.22 0.15
28 Daebahng-Gyo 1969. 6. 22 29.5 6.8 113 0. 26 0.23
n 9- 22 20 7.2 102 0- 25 0. 25
if 11. 22 10 6-7 120 0.19 0.16
1970. 2. 23 10 6.5 122 0.32 0.26
31 Dohrim-Gyo 1969. 6. 22 30 5.4 642 0.31 0. 05
h 9. 22 23 7.3 93 0.30 0. 32
ft 11. 22 9 6.8 259 0. 25 0.09
Industrial 1970. 2. 23 14 5.3 173 0. 21 0.12
area 33 Gojeuk-Gyo 1969. 6- 22 28 6.8 84 0. 21 0.26
// 9. 22 22 7-0 29 0.22 0.76
// 11. 22 8 6.7 67 0.15 0. 22
1970. 2. 23 10 7.2 68 0.17 0. 25
35 Yanghwa-Gyo 1969. 6. 21 25 6-6 137 0. 24 0.18
〃 9. 22 24 6.9 83 0.32 0.39
〃 11. 22 10 6.8 162 0.18 0-11
1970. 2. 23 16 6.8 125 0.15 0-12
and fluorine contents are shown in Fig. 3.
Morevariation of chlorine and fluoine contents at Chongahm-Daegyo was observed than that of Jeungneung-Gyo. That is, large contents of chlorine at Chongahm-Daegyo were analyzed at
noon, 3:00 P. M., and 6:00 P.M. but a little increase in fluorine contents werenotedbetween 11:00 A.M. and 2:00 P.M. The hourly vari ation of fluorine contents wasslight when com
pared with that of chlorine contents. Hourly Journal of the KoreanlChemical Society
Fig. 3. Hourly variation of Cl and F Fig. 5. Relationship between F and SiO2
Fig-. 4. Relationship between F and Cl
variation of chlorine contents was very variable, causing by hourly irregularity of disposal of wastes. But, fluorine contents in river water seems not to be influenced by hourly change in the disposal of wastes.
4. Relationship between Fluorine and Others The correlation coefficient of fluo
rine and chlorine contents was computed as + 0. 507 QFig. 4). Chlorine content was signifi
cantly correlated with fluorine content in both residential and industrial areas, but in Han River there was no correlation.
Fig. 5 shows the relationship between fluo
rine and silica. The correlation coefficient was + 0.617.
There was no correlation between fluorine,
log F ㈣〃)
Fig. 6. Histogram of fluorine
and bromine, iodine, sulfate ion and COD.
5. Frequency of Fluorine Frequency of flu
orine contents is shown in Table 5. Seventy five per cent of sample waters contained from 0.11 to 0. 25 mg/1 of fluorine. Table 5 also showed normal distribution as shown in Fig. 6.
228 李龍根•高圭子
Table 5. Frequency of F-contentsin river water F
(mg/1) Freq. F
(mg/1) Freq.
<0.10 8 0.21〜0. 25 20 0.11—0.15 24 0- 26 〜0. 30 8
0.16〜0. 20 21 >0. 50 6
Cm 이 usion
The following results were obtained in analy
zing the fluorine contents of reservoirs and river waters in Seoul for the period between June in 1969 and February in 1970.
1. Reservoirs of Seoul city contained from 0.09 to 0.15 mg/1 of fluorine contents (except the June measurement of natural water at Dookseum Reservoir). There was no difference in fluorine contents between natural and filtered waters.
2. Han River contained from 0.09 to 0.15 mg/1 of fluorine contents. The fluorine contents at Kwangjang-Gyo located at upper stream of Han River showed the range from 0.11 to 0.14 mg/1. At the 2nd Han River Bridge located at lower stream, the content was from 0.11 to 0.15 mg/1. Therefore locational difference along the river does not reflect significant variation of fluorine content.
3. River running through the residential area were chiefly influenced by city sewage. Joong
ryang-Cheun contained from 0. 09 to 0. 20 mg/1 of fluorine contents, Jeungneung-Cheun 0.23
to 0- 26 mg/1 (except Yongdoo-Gyo), Seungbook- Cheun 0. 20 to 0. 29 mg/1, Cheunggae-Cheun 0.18 to 0. 24 mg/1, Wook-Cheun 0.16 to 0. 24
mg/1, Hongjae-Cheun 0-19 to 0. 21 mg/1, and Boolkwang-Cheun 0.19 to 0. 22 mg/1.
4. Rivers running through the industrial area showed slightly large contents of fluorine than those through the residential area. The range between 0.19 and 0- 38 mg/1 of fluorine conte
nts was obtained in Daebahng-Cheun, 0. 25 and 0.31 mg/1 in Dohrim-Cheun, 0.15 and 0.32 mg/1 in Ahnyaii 옹-Cheun (except Sihoong- Gyo).
5. Seasonal and hourly variations of fluorine contents in the river water were less than those of chlorine contents.
Acknowledgement
The authors wish to express his gratitude to Mr. T. W. Kim and C. N. Cho for their assistance during this experiment.
References
(1) M. W. Hong, Seoul National University Jour nal ^Natural Science), 2, 81 (1955).
(2) M. W. Hong and P. S. Chang, J. Pharm. Soc.
Korea, 3, 51 (1957).
(3) P.S. Chang, Chungang UniversityJournal,12, 413 (1967).
(4) K. J. Whang, This Journal, 12, 163 (1968).
(5) Y.K. Lee, ibid., 14, 243 (1970).
(6) S. Hirano, et al, Japan Analyst, 18, 516 (1967).
(7) Y. K. Lee, Yonsei Non-Chong, 6, 337 (1969).
(8) K. Rankama and TH. G. Sahama, "Geochemi- stry,” P. 287, The Univ, of Chicago Press, Chicago, U.S.A., 1956.
Journal of the Korean Chemical Society