Strawberry Volume Estimation Using Smartphone Image Processing
Dong Hoon Lee1, Yongjin Cho1, and Jong Myung Choi2*
1Department of Biosystems Engineering, Chungbuk National University, Cheongju 28644, Korea
2Department of Horticultural Science, Chungnam National University, Daejon 34134, Korea
*Corresponding author: [email protected]
This study was performed to estimate the volume of strawberries using changes in the regularity of seeds on the fruit surface. The pwelch function in MATLAB was applied to images of strawberries and the proposed model was validated through correlation analysis between the calculated volume and the actual volume of strawberry fruits. The volume estimation formula was also used to derive a weight estimation formula. Therefore, an important part of the experiment was to completely remove the background of images of strawberries so that only the seeds remained. The pwelch function was used to determine the periodicity of the strawberry seeds, but the remaining background affected the accuracy of results. As such, random noise and image enhancement were applied to process the images for analysis. The periodicity of the strawberry seeds was calculated for the x- and y-axes, and a positive correlation of y = 1067.9x + 8.2903 (R² = 0.8946) was established between seed periodicity and fruit volume. However, there was a negative correlation of y = −4257.7x + 42.722 (R² = 0.8346) between seed periodicity and the fruit volume. Because the two-dimensional images do not capture the three- dimensionality of actual strawberries, the distance between seeds tended to become smaller towards the ends along the y-axis. The calculated volume and the actual volume were compared using correlation formulas for the x-axis, y-axis and the average of the two axes. The coefficient of determination was 0.7439 for the x-axis, 0.8662 for the y-axis and 0.6027 for the average of the two axes. While both the x- and y-axes showed a high correlation between actual volume and estimated volume, the formula in the y-axis showed a negative correlation. Thus, this study concluded that y = 1.7271x − 10.103 (R² = 0.8662) was the most suitable formula in estimating the volume of strawberries.
HORTICULTURAL SCIENCE and TECHNOLOGY 35(6):707-716, 2017
URL:http://www.kjhst.org pISSN :1226-8763 eISSN :2465-8588
This is an Open-Access article distributed under the terms of the Creative Commons Attribution NonCommercial License which permits unrestricted non-commercial use, distribution, and reproduction in any medium, provided the original work is properly cited.
Copyrightⓒ2017 Korean Society for Horticultural Science.
OPEN ACCESS Received:
Revised:
Accepted:
April 19, 2017 September 27, 2017 September 29, 2017
Abstract
Additional key words: correlation, frequency domain, measurement, regression model
Introduction
Thevolumeproducedfromcropplantsisgenerallybasedonfreshweightafterharvestingordryweight measurements. Non-destructivemethodsofmeasuringvolumenotonlyreducethelossofcropyields, but alsoenhancetheefficiencyofvolumesurveys. Imageprocessingtechniquescanbeutilizedasanon- destructivemethodofexaminingvolumewithoutcomingintodirectcontactwithcrops. Theycanalsobe usedtodiagnosetheincidenceofpestsorphysiologicaldisordersaffectingcrops. Imageprocessing
providesvolumeinformationrapidlyandaccurately, andenablescontinuous, repeatedmeasurements.
Imageprocessinghasbeenwidelyutilizedfortheanalysisofplantsandanimals. Imagesarefirstacquiredusingananalogor digitalcamera, andvariousimageprocessingtechniquescanbeappliedduringimageanalysis, whichcanthenbeclassified usingstatisticalandidentificationprocedures. XuandZhao (2010) developedanalgorithmthatusesimageprocessingto automaticallygradestrawberriesaccordingtotheirsize, shapeandcolor. Thisalgorithmobtainsthecross-sectionofstrawberries fromgreenandbluevaluesintheRGBcolorspaceandhasadetectionerrorsmallerthan5%, acolorgradingaccuracyof88.8% andashapeclassificationaccuracyabove90%. Theaveragetimetheprogramtooktogradeonestrawberrywasthreeseconds. Choetal. (2006) developedadevicethatmeasuresthesizeandshapeofredpeppersfromimages. Throughhistogramanalysis usinggreenvaluesonly, theyachievedanaverageaccuracyof86%. Costaetal. (2011) proposedanautomatedshapeprocessing algorithmaftercomparingvariousimageprocessingtechniquesusedonagriculturalproducts. Otherresearchhasemployed digitalimageprocessingtoestimatethevolumeoflettuce (Jungetal., 2015), oranges (Sayincietal., 2012) andtomatoes (Campilloetal., 2008).
Physicalpropertiesoffruits (i.e. massandvolume) arethemostimportantparametersforclassificationofproductqualityand quantity. Researchersestimatedthemassofvariousagriculturalproductslikefruitsusingmodelingtechniques (Tabatabaeefar, Rajabipour, 2005; Khoshnametal., 2007; Naderi-Boldajiaetal., 2008); however, measurementoffruitmasswaslimitedinreal- timewithoutcontactoffruitdirectly (Khoshnametal., 2007). Forreal-timemeasurement, sortingthequalityoffruitbasedon volumemayprovetobeamoreefficientmethodthansortingthequalityoffruitbasedonmass.
Thewaterdisplacementmethod (WDM) isavolumetricmeasurementofobjects. Mohsenin (1970) reportedthattheWDM wasoneofthesimplestmeasurementsforthevolumeofobjectssuchasfruitsandvegetables. Theactualvolumewasmeasured asthemassofdisplacedwaterafterdippingafruitintoawater-filledcontainerdividedbywaterdensity. Thecalculationforthe volumeofaconicalfrustumcanbefoundinmathematicshandbooksfordimensionalanalysisandmodeling (Szirtes, 2006), andbyusingimagingprocessingbasedonthismathematicalmethod, Khojastehnazhandetal. (2009) calculatedthelateral surfaceareaonvolumeofaconicalfrustum.
Omidetal. (2010) developedanimageprocessingtechniquetomeasurethevolumeandmassofcitrusfruitssuchaslemons, limes, orangesandtangerines. TheyusedtwoCCDcamerastocalculatethevolumeofthefruits. Thecalculatedvolumeswere ingoodagreementwiththeactualvolumesdeterminedbyWDM. Thecoefficientofdetermination (R2) forfruitsbetween actualvolumeandcalculatedvolumewere0.96to0.98. Additionally, byestimatingthevolume, themethodofcalculatingthe volumeofthefruitswas90-96% accurateinfruitmassestimation. Inotherwords, ifthefruitdensityisassumedtobeconstant, itispossibletoestimatethevolumeoffruitsinanon-destructivemannerthroughthedetailedanalysisofexternalfeatures.
Whileinformationcanbeconvenientlyretrievedfromimagestakenwithasmartphone, theanalysismaynotbeaccuratedue totheintensityofsurroundinglight, theangleofimagecapture, andshadows. Kim (2014) proposedaGaussian-baseddenoising algorithmbasedonfrequencydomainanalysistoovercomethelimitofprocessingperformance.
Thisstudypresentsanon-destructiveimageprocessingmethodtoestimatethevolumeofstrawberries. Strawberrieshave 200to400seedsuniformlydistributedontheirsurfacesthatcreateapattern. Wehypothesizedthatchangesintheregularityof thispatterncanbeusedtoderivedimensionalinformation, whichcanbedifficulttoobtainfromcross-sectionalobservations. Thepurposeofthisstudywastodevelopamodeltoestimatethevolumeoffruitsbasedonimagescapturedwithasmartphone cameraandtovalidatetheproposedmodelforstrawberries.
.
Materials and Methods
Field Information and the Device for Image Collection
Thisstudywasperformedon ‘Seolhyang’ strawberries(FragariaxananassaDuch) grownonastrawberryfarminNodong- gu, Gadeok-myeon, Cheongju-si, Chungcheongbuk-do. Tenstrawberrieswererandomlyselectedeveryweekforeightweeks fromMarch17toApril192016. Massandvolumemeasurementsweretakenfromimagescapturedwithasmartphone. The smartphoneusedinthisstudywasaGalaxyNote2 (SM-N910S, Samsung, Korea), whichhadthefollowingspecifications: Processor, 1.6GHzQuadcoreCPU; Memory, 2GB; Pixeldensity, 267ppi; Camera, 8megapixel; Resolution, 1280 × 720. The fruitwasplacedonapieceofgraphpaperandadjustedsuchthatittookupthesameareaineachimage. Thesmartphonewas20 cmawayfromthefruitduringimagecapture. Thefreshweightofstrawberrieswasmeasuredusinganelectronicscale (Model CB-120, A&DElectricBalance, CA, USA). ThesizeofthefruitwasmeasuredusingaVerniercaliper (530-101, Mitutoyo, Japan) withtheplanedividedintothelongitudinalandlateralaxes. Lengthmeasurementsinthelateralaxisweredividedinto majorandminoraxes. Thevolumewasmeasuredusingthewaterdisplacementmethod, whichinvolvesdippingastrawberry inawater-filledbeakerandmeasuringtheamountofwaterthatoverflows, asgivenbyEq. 1.
Wa−Ww Wbfw−Wbw Wd
V = = = (1) γω γω γω
where,
V isthevolumeoftheobject, Waistheweightoftheobjectinair, Ww istheweightoftheobjectinwater,
Wbfwisthetotalweightofthebeaker, waterandobject, Wbwistheweightofthebeakerandwater,
Wdistheweightoftheoverflowedwaterand γωisthespecificweightofwater ( 9,810N/m-3).
Image Collection and Analysis
Seedsonthesurfaceofstrawberriesformregularpatternsandchangesintheirsharpnessandregularitymaybeobserved dependingonthevolumeofthestrawberry. Toexaminetheperiodicityofpatterns, thepwelchfunctionprovidedinMATLAB 7.10.0 (Mathworks, MA, USA) wasused. Thisfrequencyspectraldensityfunctionconvertstheregularityofspatialdistribution tothefrequencyspaceandgivesthesizeoftheenergybyfrequency. RGBvaluesforstrawberryseedswereretrievedafter convertingthebackgroundoftheimagestoblackandwhite, andexcludingtheredareaofthefruit. Theseedswerereplaced withwhitedotsintheprocessedimagestoemphasizetheperiodicityinformation. Afterfalsecoloringthestrawberrysurface andbackgroundblack, randomnoisewasinsertedtoreducethesizeofspatialfrequencythatarosefromtheblackbackground.
Results and Discussion
Image Characteristics from Ideal Strawberry Image
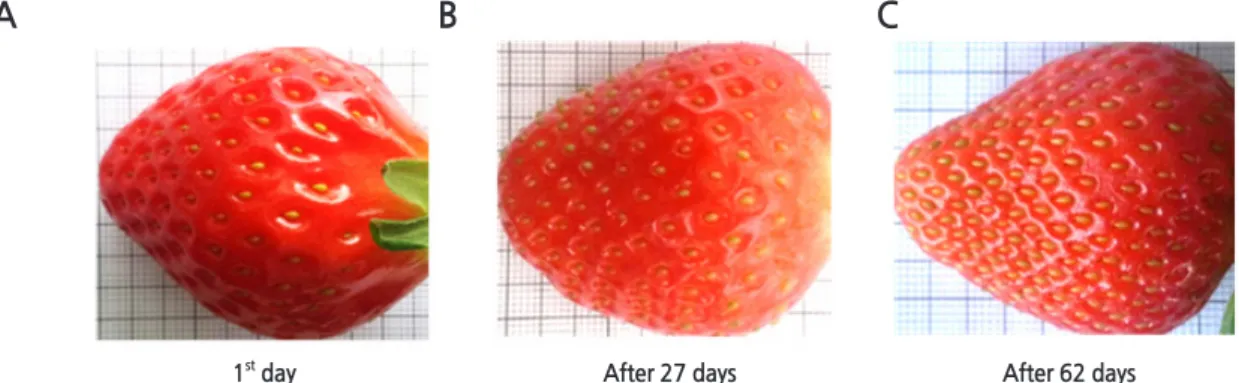
Fig. 1showsthreesnapshotsofstrawberrysurfacesatdifferentgrowthstages. Asthegrowingdaysincreased, theclearness,
numberandperiodicityofseedsincreased. Ourinitialhypothesiswasconstructedbyvisualandqualitativeinspectiononthose images, andaskedifthereisasignificantrelationshipbetweentopologicaldistributionofseedsonsurfaceofstrawberriesand phenotypicinformationofrelationshipbetweenseeddistribution. Thus, thisstudyassumedthatthesharpnessandregularityof seedsformaproportionaterelationshiptothevolumeofthefruit. Basicexperimentswereconducted, asshowninthefigure, to determinethecharacteristicsofimagesbeforeimageprocessing. Fig. 2showsthethreeidealimagesthatmimeticallyexpress thesharpnessandregularityofseeds. FromFig. 2Ato2C, theperiodicity, sharpnessandregularitywerevariedtoobserve changesinthevolumeofthefruit. TheresultsfromimageanalysesproducedbyapplyingthepwelchfunctiontoFig. 2aregiven inFig. 3. Anexaminationofspatialfrequencies, whichcorrespondtothephenotypicinformationofseeds, showsanincreasein volumewithperiodicityandsharpness. Fig. 4showstheproceduresinvolvedinthisprocess. InFig. 4A, thereflectedlightonthe surfacemadeitdifficulttodistinguishthefruitfromthebackground. Fig. 4Billustratesthatloweringthetoneandapplyinga histogramequalizationtoemphasizethesurfaceresolvedthisissueofcontrast. InFig. 4C, toretrievecolorvalues, theimpixel functionofMATLABwasappliedtothearearecognizedasseeds. TherangeofRGBvalueswas0.04 < red < 0.80forred, 0.15 <
green < 0.4forgreenandblue < 0.30forblue. Usingtheseranges, thestrawberryseedswereextractedasshowninFig. 4D. Based ontheextractedimages, theperiodicityofthestrawberryseedswasanalyzedbyfirstapplyingtheFFT2functioninMATLAB toderivespatialfrequencycomponents, followedbythesurffunctiontodeterminethelocationofthelargestdatavalue. The correspondingfrequencyand spectraldensity wereobtainedusing thepwelchfunction, andcorrelationalanalysiswas
Fig. 1. Comparison of number and size of seeds during the fruit development of ‘Seolhyang’ strawberry. The first day of harvesting period on measurement (A), 27 days after the beginning of measurement (B), and 62 days after the beginning of on measurement (C).
1st day After 27 days After 62 days
A B C
Fig. 2. Prepared ideal images to represent different frequency, clearness and size of seeds that correspond to strawberry growth stages. Relatively lower frequency, clearness and smaller size (A), middle frequency, clearness and size (B), and relatively higher frequency, clearness and larger size (C).
A B C
performedtoexaminetherelationshipofseedprecocitytofruitvolume. Thenoiseprocessingwasperformedonthebackground toremoveperiodicity, andtheperiodicityoftheseedswasobtainedbyagainapplyingtheFFT2functionfollowedbythe pwelchfunction.
Strawberry Volume Estimation Using Image Processing
Table1showsthevolumeandweightmeasurementsfrom80strawberrysampleswithvariationofvolumeatharveststage. AfrequencydomainanalysiswasappliedtoconstructtheinitiativeimageprocessingalgorithmasproposedbyKim (2014).
Fruit width (mm) Fruit height Fresh weight Fruit volume
Short axis Long axis (mm) (g) (cm3)
Mean 31 34 42 21.65 18.92
Standard error 0.39 0.41 0.51 0.50 0.69
Standard deviation 3.51 3.71 4.63 4.50 6.19
Sample deviation 12.48 13.94 21.79 20.50 38.86
Maximum value 44.5 44 57 33 30.80
Minimum value 25 26 33 12.16 14.17
Table 1. Statistics of the measured values in size, mass and volume of 80 strawberry fruit samples
Fig. 4. Illustration of the image processing procedure for seed recognition. Original image (A), enhanced image using histogram equalization (B), manual identification of seed area using the impixel function in matlab (C), binary image of seed by thresholding the RGB range (D) (0.04 < R < 0.80, 0.15 < G < 0.40, B < 0.30 ).
χ y
A B C D
Fig. 3. Plot of the log scaled power spectrum calculated by the pwelch function according to the prepared three ideal images from Figure 2.
Fig. 2A Fig. 2B Fig. 2C
Normalized frequency (rad/sample) Log scale of power divided by frequency log (dB/rad/sample)
13
12
11
10
9
8
1 17 33 49 65 81 97 113 129 145 161 177 193 209 225 241
Theexperimentwasperformedusingbyremovingtheimagebackgroundtoextractthestrawberryseeds, andapplyingthe pwelchfunctiontodetermineseedperiodicity (Fig. 7). Thepwelchfunctionpresentstheperiodicityofthedatabasedonaverage valuesofseedperiodicity. Relativelylargevaluesatthethreepointsindicateastrongperiodicity. Thenormalizedfrequency over3onseedperiodicitycanbeneglectedastheyareclosetozero.
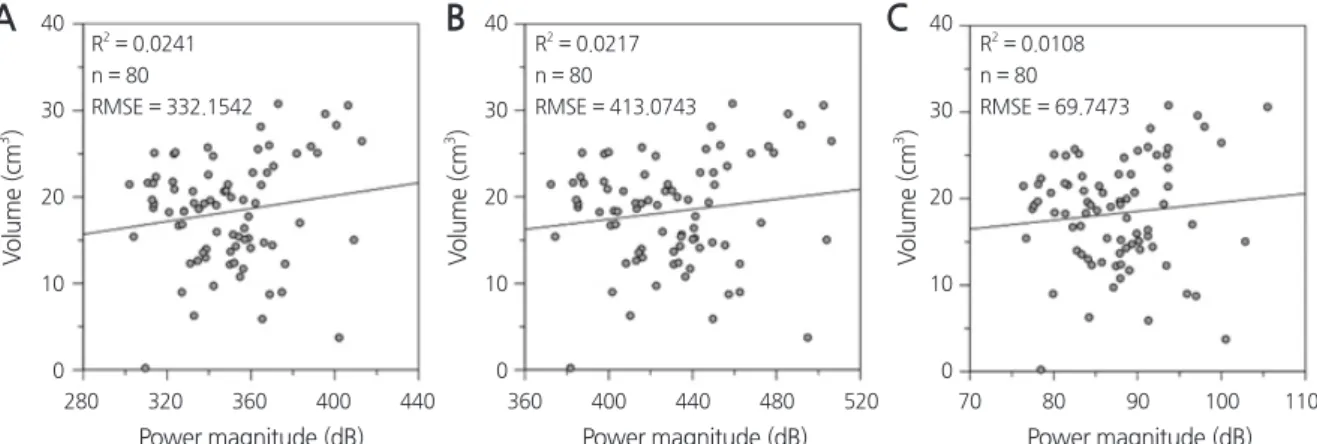
Correlationalanalysiswasperformedforrelationshipbetweenthefrequencyintensityofthethreepointsandthevolumeof thefruit (Fig. 8). ThecoefficientofdeterminationR² atthefirstpointwas0.0241andtheequationwasy = 0.0372x + 5.2789, whereyisthevolumeofthefruit, andxisthedistancebetweenseeds(Fig. 8A). ThecoefficientofdeterminationR² atthesecond pointwas0.0217, andtheequationwasy = 0.0289x + 5.8438 (Fig. 8B). Finally, thecoefficientofdeterminationR² atthethird pointwas0.0108, andtheequationwasy = 0.1028x + 9.2726(Fig. 8C).
SinceanR² valueclosetooneindicatesastrongcorrelation, thefrequencyintensityatthethreepointsarenotalwaysfoundto correlatetothefruitvolumebecausethebackgroundwasnotcompletelyremovedwhenextractingthestrawberryseeds. Furthermore, thestrongperiodicityoftheblackareasresultedinthestrawberrieshavingarelativelyweakerseedperiodicityon analysis.
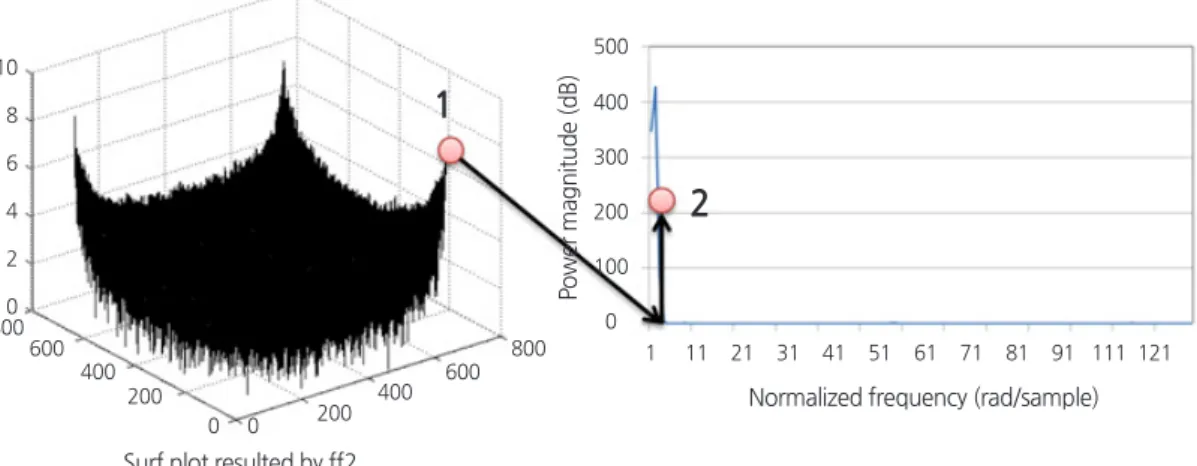
Toresolvetheissueofthebackgroundnotbeingcompletelyremovedfromtheimages, thesecondanalyticalmethodwas Fig. 5. Illustration of how the power spectrum density of the major component in frequency domain was determined. Point (1)
denotes the highest value in the two-dimensional frequency domain, point (2) denotes the power spectrum density derived by point (1).
Normalized frequency (rad/sample) Surf plot resulted by ff2
Power magnitude (dB)
10
8
6
4
8000
800 600
600
400 200 400
0 0 200 2
400 500
300
200
100
0
31 41 51 61
1 11 21 71 81 91 111121
1
2
Fig. 6. Illustration of the image processing procedure for enhancing seed frequency. White spots replaced strawberry seeds corresponding to location on and size of the fruit (A); background removal including non-seed area on strawberry surface (B);
and the embedded random noise for lowering frequency power of the background (C).
A B C
employed. Theexperimentwasconductedwithatotalof80datavalues, with40usedtopredictthevolumeofstrawberries basedonimageprocessing, andtheremainingtovalidatetheestimationformula. Theimageswereconvertedtoblackandwhite andthestrawberryseedswerereplacedwithwhitedots. Inthisway, theunnecessarybackgroundwasremovedfromtheimages, allowingthestrawberryseedstobeeasilyextractedbytheprogram. Thepwelchfunctionwasusedtocalculatetheseed periodicityoftheextractedimages, andthecorrelationtothefruitvolumewasanalyzedforallsections(Fig. 9).
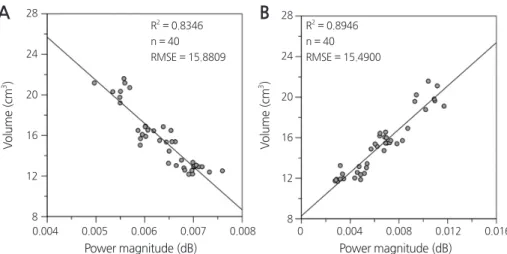
Betweenthetwopointswithacoefficientofdeterminationclosetoone, thefirstpointwastheperiodicityofseedsinthey (circumference) directionandthesecondpointistheperiodicityofseedsinthex (length) direction.
Correlationalanalysisbetweentheperiodicityofstrawberryseedsandvolumeatthefirstpoint (Fig. 10A)gaveanR² of 0.8346andshowedanegativecorrelation (y = −4257.7x + 42.722). Forthesecondpoint (Fig. 10B), theR² was0.8946and establishedapositivecorrelation (y = 1067.9x + 8.2903). Thelargerthevolumeofthefruit, thesmallerthedistancewasbetween seedsattheperipheryinthey (circumference) direction. Thenegativerelationshipbetweenvolumeandseeddistancesiscauses theperiodicitytodecrease, resultinginanegativecorrelationbetweenseedperiodicityandfruitvolume. However, theseeds grewmoredistinctinthex (length) directionwhenthevolumeofthefruitincreased, andapositivecorrelationwasestablished duetothenegligibledecreaseinperiodicityintheydirection.
Fig. 7. The select magnitude of power spectrum density for correlation analysis using the volume of strawberries (arrows point to the selected power magnitude).
Normalized frequency (rad/sample) 11
1 21 31
Power magnitude (dB)
400 500
300
200
100
0
Fig. 8. Scatter plots indicating the insignificant relationship between power magnitude of frequency and strawberry volume. The first power magnitude (A), the second power magnitude (B), the third power magnitude (C).
Power magnitude (dB) Power magnitude (dB) Power magnitude (dB)
Volume (cm3) Volume (cm3) Volume (cm3)
40
30
20
10
0
40
30
20
10
0
40
30
20
10
0
280 320 360 400 440 360 400 440 480 520 70 80 90 100 110
A B C
R2 = 0.0241 n = 80
RMSE = 332.1542
R2 = 0.0217 n = 80
RMSE = 413.0743
R2 = 0.0108 n = 80 RMSE = 69.7473
Validation of the Volume Estimation Model Using Image Processing
Thex-axis, y-axisandtheiraveragewereverifiedwiththecorrelationformulatocomparetheactualfruitvolumetothe volumeobtainedfromimageprocessing. Acomparisonoftheestimatedvolumeandactualvolumeobtainedfromthey-axis correlationformula (y = 0.6144x + 26.34) gaveanR² = 0.7439 (Fig. 11A). Acomparisonofthetwovolumesusingthex-axis correlationformulaofy = 1.7271x - 10.103gaveanR² = 0.8662; therebyestablishingapositivecorrelationoftheactualvolume andestimatedvolumeinthey-axis (Fig. 11B). TheR² = 0.6027wheny = 1.421x – 4.3784; theaverageofthetwoaxeswasused tocomparetheestimatedandactualfruitvolumes (Fig. 11C).Thegoodcorrelationwasfoundbetweentheactualvolumeand estimatedvolumeinthey-axiswithanR² = 0.7439, butthiswasinadequateforcalculatingthefruitvolumebecauseofthe negativecorrelationbetweentheactualvolumeandestimatedvolume. Thecorrelationbetweenthevolumeobtainedusingthe averageofthetwoaxesandtheactualvolumewas0.6027. Therewasaveryhighcorrelationbetweentheestimatedvolumein thex-axisandtheactualvolume, withanR² = 0.8662. Thecorrelationformulay = 1.7271x – 10.103wasderivedusingthe periodicityofseedsinthex-axisandwasdeemedsuitableforvolumeestimation.
Fig. 9. Select magnitude of power spectrum density for correlation analysis with strawberry volume (arrows point selected power magnitude).
Normalized frequency (rad/sample) 40
0 80 120
Determination coefficient
1
0.8
0.6
0.4
0.2
0
1 2
Fig. 10. Scatter plots between power magnitude and strawberry volume. Strong negative correlation with the first power magnitude (A), strong positive correlation with the second power magnitude (B).
Power magnitude (dB) Power magnitude (dB)
Volume (cm3) Volume (cm3 )
0.004 0.005 0.006 0.007 0.008 0 0.004 0.008 0.012 0.016
A B
R2 = 0.8346 n = 40 RMSE = 15.8809
R2 = 0.8946 n = 40 RMSE = 15.4900 28
20
16
12
8 24
28
20
16
12
8 24
Application of the Fresh Weight Estimation Model
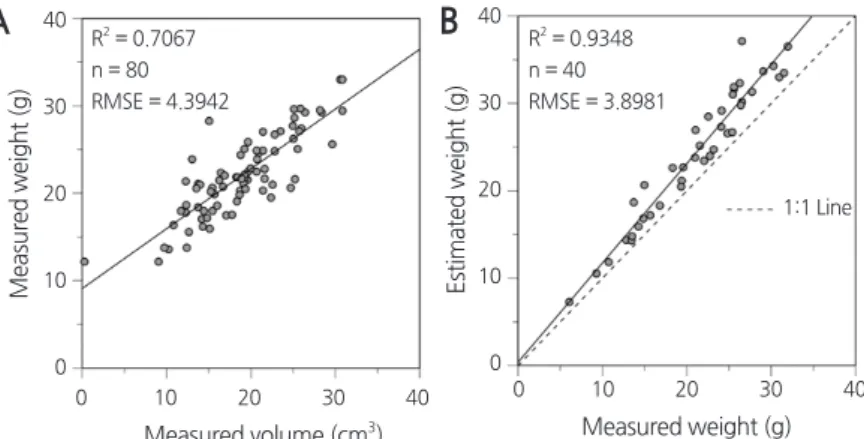
Correlationanalysiswasperformedbetweenthefruitvolumeandthefreshweight (Fig. 12A), whichproducedtothe correlationformulaz = 0.6845y + 9.11andanR² = 0.7067 (z: strawberryfreshweight, y: strawberryvolume). Weestimatedthe freshweightbyprocessingtheimagesofeightsampleswiththesmalleststandarderrorofcalibration (SEC).
Whenthevolumeestimationmodelwascross-validatedwithfreshweight, theR² = 0.9348 (n = 40) (Fig. 12B). Ingeneral, modelsthatestimatefreshweightbasedonvolumehavemanyconstraintsandimprovingtheaccuracyofvolume-basedfresh weightmodelswillenhancetheaccuracyoffreshweightestimations. Westatedthatadditionalstudieswereneededtosupport theseresults. Thefreshweightestimationappearspromisingforrapid, efficientestimationoffruitweight. Resultsfromthis studywereconductedforthestrawberryspecies ‘Seolhyang’ andwitharelativelysmallnumberofobservations; therefore, it willneedtoberepeatedwithmoreextensivesamplingacrossvariousstrawberryspeciestoconfirmtheapplicationofthe methodology.
Thisstudyaimedtoestimatethevolumeofstrawberryfruitsbasedonphenotypicinformationacquiredwithsmartphones. Byanalyzingthefrequencyofseedsonthesurfaceofstrawberries, thisstudyfoundasignificantrelationshipbetweenseeds distributedinthelengthwisedirectionandoverallvolumeofthefruit. Forthistechniquetobeutilizedonfarms, theperformance ofthevolumeestimationmodelshouldbeimprovedthroughoptimizationoftheimageprocessingalgorithmandfurther
Fig. 11. Scatter plots between estimated and measured fruit volume. Frequency analysis in the y direction (A), frequency analysis in the x direction (B), and frequency analysis in both the x and y directions (C).
Fig. 12. Relatively strong positive correlation illustrated by scatter plot between measured volume of fruit and measured wet weight of fruit (A) and scatter plot between measured and estimated wet weight of fruit using image processing (B).
Estimated voulume (cm3)
Measured volume (cm3)
Estimated voulume (cm3)
Measured weight (g)
Estimated voulume (cm3)
Measured volume (cm3) Measured weight (g) Measured volume (cm3) Estimated weight (g) Measured volume (cm3)
40
30
20
10
0
40
30
20
10
0
40
30
20
10
0
40
30
20
10
0
40
30
20
10
0
0 10 20 30 40
0 10 20 30 40
0 10 20 30 40
0 10 20 30 40
0 10 20 30 40
A
A
B
B
C
R2 = 0.7439 n = 40 RMSE = 17.0982
R2 = 0.7067 n = 80 RMSE = 4.3942
R2 = 0.8662 n = 40 RMSE = 4.1938
R2 = 0.9348 n = 40 RMSE = 3.8981
1:1 Line R2 = 0.6027 n = 40 RMSE = 4.7542
researchonproxyvariables. Moreover, itisessentialtodevelopafreshweightestimationmodelthatreliesonphenotypic information.
Literature Cited
Campillo C, Prieto MH, Daza C, Monino MJ, Garcia MI (2008) Using digital images to characterize canopy coverage and light interception in a processing tomato crop. HortScience 43:1780-1786
Cho NH, Chang DI, Lee SH, Hwang H, Lee YH, Park JR (2006) Development of automatic sorting system for green pepper using machine vision. J Biosyst Eng 31:514-523 (Abstr.). doi:10.5307/JBE.2006.31.6.514
Costa C, Antonucci F, Pallottino F, Aguzzi J, Sun D, Menesatti P (2011) Shape analysis of agricultural products: a review of recent research advances and potential application to computer vision. Food Bioprocess Technol 4:673-692.
doi:10.1007/s11947-011-0556-0
Kim SU (2014) An image denoising algorithm for the mobile phone cameras. Electron Commun 9:601-608 (Abstr.). doi:10.13067/
JKIECS.201.9.5.601
Omid M, Khojastehnazhand M, Tabatabaeefar A (2010) Estimating volume and mass of citrus fruits by image processing technique. J Food Eng 100:315-321. doi: 10.1016/j.jfoodeng.2010.04.015
Jung DH, Park SH, Han XZ, Kim HJ (2015) Image processing methods for measurement of lettuce fresh weight. J Biosyst Eng 40:89- 93. doi:10.5307/JBE.2015.40.1.089
Sayinci B, Ercisli S, Ozturk I, Eryilmaz Z, Demir B (2012) Determination of size and shape in the ‘Moro’ blood orange and ‘Valencia’
sweet orange cultivar and its mutants using image processing. Not Bot Horti Agrobot Cluj Napoca 40:234-242
Xu L, Zhao Y (2010) Automated strawberry grading system based on image processing. Comput Electron Agric 71:32-39.
doi:10.1016/j.compag.2009.09.01