수간재적모델에 따른 일본잎갈나무의 수간재적 추정 및 비교
고치웅 1⋅문가현1⋅임종수1⋅이선정1⋅김동근2⋅강진택 1*
1국립산림과학원 산림산업연구과, 2경북대학교 생태환경시스템학과
Estimation and Comparison of Stem Volume for Larix kaempferi in South Korea using the Stem Volume Model
Chi-Ung Ko 1, Ga-Hyun Moon1, Jong-Su Yim1, Sun-Jeoung Lee1, Dong-Geon Kim2 and Jin-Taek Kang 1*
1Division of Forest Industry Research, National Institute of Forest Science, Seoul 02455, Korea
2Department of Ecology and Environment System, Kyungpook University, Sangju 37224, Korea
요 약: 본 연구는 수간재적과 상관관계가 높은 흉고직경과 수고를 독립변수로 하여 우리나라 일본잎갈나무의 수간재적 추
정식을 개발하고자 하였다. 전국의 분포하고 있는 일본잎갈나무를 총 2,840본의 표준목을 벌채하여 수간고별 직경과 수간 석해 자료를 수집하여 생장특성을 조사하였다. 6개의 수간재적모델의 적합도 검정을 위하여 적합도지수, 편차, 평균절대편 차, 변이계수를 이용하여 모델의 적합성을 판단하였다. 최종 선정된 모델은 흉고직경만을 이용한 Model 1( ), 흉고직경과 수고를 이용한 Model 4( )가 최적의 모델로 선정되었다. 비선형회귀분석을 통한 모델의 절편과 기울기계수인 a, b는 0.05수준에서 통계적으로 유의한 값을 보였다. 적합도지수는 94%∼99%로 나타났고, 편차는 두 모델 이 0에 근접하였으며, 평균절대편차는 0.01∼0.05, 변이계수는 5.97∼14.43으로 높은 적합도를 보였다. 본 연구에서 제시 된 수간재적모델을 이용하여 현장에서 흉고직경 또는 흉고직경과 수고를 측정한 후 바로 재적을 추정할 수 있으며, 산림경 영에 필요한 기초 정보를 제공해 줄 것이다.
Abstract: This study aimed to develop an equation for estimating stem volume for Larix kaempferiin South Korea using independent variables, diameter at breast height (DBH), and height as being closely associated with stem volume. Analysis was conducted on the growth performance of 2,840 Larix kaempferi samples across South Korea after felling them and gleaning diameter data according to both stem height and stem analyses. In order to test the fitness of six different stem taper equations, empirical assessment was conducted for fitness index (FI), bias, mean, and absolute deviation (MAD), and coefficient variation (%CV). The two selectedmodels found to be optimal were the following: model one ( ), established by employing DBH only; and model four ( ) , established by utilizing DBH and height, respectively. The findings of non-linear regression indicated statistical significance (p < 0.05) in a and b, which were the coefficients for the intercepts and slopes of the models. The FI of the models ranged between 94% and 99%, and the bias was close to zero, while MAD ranged from 0.01 to 0.05, and %CV from 5.97 to 14.43, indicating a high level of fitness. Thus, using the suggested models, the basic information necessary for forest management was obtained, and an estimation of the stem volume was effected without delay soon after effecting DBH and height measurements.
Key words: Larix kaempferi, stem volume model, stem model, forest management, stem analysis. merchantable volume.
서 론1)
일본잎갈나무는 대표적인 속성수, 양수로 우리나라에
* Corresponding author E-mail: [email protected] ORCID
Chi-Ung Ko https://orcid.org/0000-0001-6706-5624 Jin-Taek Kang https://orcid.org/0000-0002-4688-8450
1910년대에 일본으로부터 도입되어 1970년대부터 대표 적인 용재수로서 조성을 위해 중부, 북부지역의 지리적, 기상적인 환경에 성공적으로 적응해 많이 식재된 수종이 다. 일본잎갈나무의 경우 목재생산을 기본적인 목표로 하여 장벌기 시업이 가능하므로 중·소경재 생산 뿐만 아니 라 특수 우량대경재의 생산도 가능하다(National Institute of Forest Science, 2015). 임업통계연보에서 조사된 2015
JOURNAL OFKOREANSOCIETY OFFORESTSCIENCE ISSN 2586-6613(Print), ISSN 2586-6621(Online) http://e-journal.kfs21.or.kr https://doi.org/10.14578/jkfs.2019.108.4.592
592
년 기준으로 전체 침엽수종의 산림면적인 2,339,002 ha 중 에 약 8.57%인 272,800 ha로 소나무 다음으로 전국에 가 장 많이 분포하고 있다. 임목축적은 403,971,330 m3 중 46,970,137 m3로 8.61%의 임목축적을 가진 수종이다. 또 한 우리나라 산림의 영급이 Ⅳ영급 이상의 청⋅장년기에 해당하는 영급의 산림면적이 전체 산림면적의 72%를 차 지하여 국내에서 목재를 생산할 수 있는 시기가 되었다 (National Institute of Forest Science, 2015; Korea Forest Service, 2018).
산림의 기본 기능은 우량대경재를 생산하여 경제적인 기능과 생태계를 유지하고 자연재해로부터 보호, 수자원 함량, 휴양 치유 등을 이용한 인류 생활의 문화여건 등의 공익적인 기능을 가지고 있어 산림의 경영은 이러한 기 능이 최대한 발휘될 수 있도록 경영 되어야 한다(Jeon et al., 2007). 최적의 산림경영을 위한 기본적인 방법은 정 확한 재적의 추정이 기본이 되며 임목축적과 같은 산림 자원량을 정확히 계산하고 예상하여야 한다. 재적의 추 정은 흉고직경과 수고가 추정식의 변수로 포함되었을 때 수간재적의 추정치는 높은 정확도를 보인다.
현재 국내외적으로 과거부터 현재까지 수간재적 추정 에 대한 연구가 많이 실시되었고, 다양한 방법으로 이루 어 지고 있다. 재적을 추정하는 방법은 크게 형수법, 수 간비(Honer, 1965; Burkhart, 1977), 수간곡선식(Kozak et al., 1988; Kim et al., 1994; Kozak et al., 2003; Son et al., 2007; Son et al., 2009; Hjelm, 2011; Son et al., 2014;
Kang et al., 2014; Seo et al., 2014), 흉고직경과 수고를 이용한 재적식을 이용한 연구도 진행되었다(Lee et al., 2001; Jeon et al., 2007; Johansson, 2014; Seo et al., 2015;
Seo et al., 2016; Ko et al., 2019). 그러나 수간재적모델의 경우 일부 지역단위, 특정 수종에 대한 연구만 진행되었 고 전국단위에 입목수간재적에 대한 연구는 부족하여 연 구의 필요성이 대두된다.
이에 본 연구는 전국에 분포하고 있는 경제수종이자 주요수종인 일본잎갈나무를 분석하여 수간재적에 영향 을 미치는 인자 중, 측정이 쉽고 정확한 흉고직경과 수고 를 측정하여 이를 독립변수로 정확한 산림자원량을 파악 할 수 있는 수피포함 수간재적, 수피제외 수간재적을 추 정하는 추정식을 개발하고자 하였다.
연구내용 및 방법
1. 수간재적모델 개발 분석방법
개체목 나무에 대한 추정식은 산림경영 연구의 중요한 주제이다. 본 연구는 입목의 수피를 포함한 수간재적과 수피를 제외한 수간재적을 추정하기 위하여 실제 현장에 서 측정하는 많은 변수들 중에 가장 측정하기 편리하고, 재적과 상관관계가 높은 인자인 흉고직경(Diameter at Breast Height), 수고(Height)를 재적모델의 변수로 정하 였다. 수간재적을 측정하는 방법은 수간의 위치에 따라 서 나일로드형, 포물선형, 원추형으로 크게 3부분으로 구 분되는데, 근원부부터 근주원목 부분은 나일로드식, 초두 부는 원추체적식, 중간부분은 Smalian식으로 각각 다른식 으로 재적을 추정하고 더하여 입목의 재적을 계산하였다.
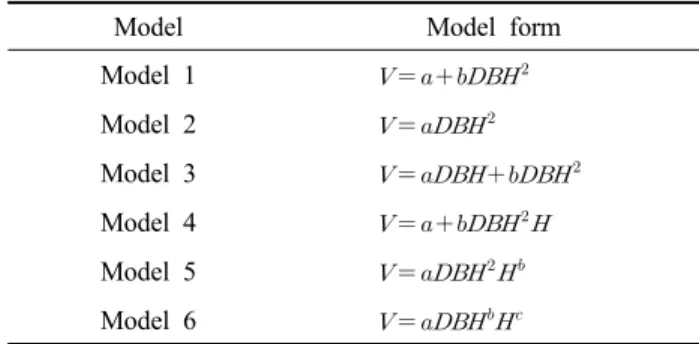
본 연구에서 사용 된 수간재적모델은 2가지형태로 흉 고직경만을 이용하는 1변수식(Model 1, Model 2, Model 3) 과 흉고직경과 수고를 이용한 2변수식(Model 4, Model 5, Model 6)을 이용하여 재적을 추정하였다(Table 2, Table 3).
흉고직경만을 이용하여 재적을 추정하는 것은 흉고직경 과 수고를 함께 이용하여 재적을 추정하는 것보다 낮은 신뢰도를 나타내지만 현장에서 수고를 정확히 측정할 수 없는 환경에서는 효과적으로 이용 될 수 있다. 추정식들 은 기존의 문헌을 참고하였다(Avery and Burkhart, 1994;
Dorado et al., 2006; Kachamba and Eid, 2016; Seo et al., 2016). 수피제외 수간재적모델의 재적은 Lee(1993)가 개
Species of Trees Variable n Mean Std.
Dev Min Max
Larix kaempferi
DBH (cm)
2,840 24.95 8.04 6.1 58.0
Heigh t(m) 21.90 4.85 4.9 36.1
Table 1. Characteristics of surveyed sample trees.
Model Model form
Model 1
Model 2
Model 3 Model 4 Model 5 Model 6 where = stem volume,
= diameter at breast height,
= Total height,
= parameters
Table 2. Applied stem volume equation for fitting of in Larix kaempferi this study.
발한 수피두께추정식을 이용하여 흉고직경의 수피제외 직경값을 추정하였다.
2. 수간재적모델 개발 통계적 검정
각 모델을 이용하여 일본잎갈나무의 모델별 적합도를 검정하기 위한 검정통계량은 다음 Table 4와 같다. 비선형 회귀분석에서 적합도지수(FI)는 비선형식과 변수간의 관계 를 나타내며, 선형식의 결정계수(Corfficient of determination, R²)와 같은 성격의 지수로 1에 가까운 값을 가질수록 높 은 적합성을 가진다. 이는 비선형회귀분석에서 추정값과 실측값의 관계정도를 나타내기 위한 값이다. 이에 추가 적으로 다른 적합성 검정 과정들을 확인하여야 한다(Seo et al., 2016). 또한 추정된 값이 모수의 참값에 대하여 과 소·과대치를 주는지를 알 수 있는 편의(Bias)를 구하였다.
잔차의 표준오차의 백분율(SEE%)을 비교하여 상대적인 모델의 정도를 평가하였으며 단위가 다르거나 표본과의 추정식의 정도의 비교를 가능하게 하는 종속변수의 평균 에 대한 표준오차의 비를 나타내는 변이계수(CV%)를 비 교하여 모델의 상대적인 정도를 평가하였다. 추정치 잔 차의 절대값을 평균한 값인 평균절대편차(MAD)로 각 추
정치 편차의 평균적인 크기를 알 수 있었으며 이들 통계 량은 관측값와 추정값의 차이를 보여주는 것으로 값이 0 과 근접할수록 높은 정도를 나타낸다(Schlaegel, 1984;
Lee et al., 1999; Son et al., 2012; Kang et al., 2014; Son et al., 2017). 한편 검정통계량은 수간곡선모델의 식에 대 한 추정이행능력만을 확인 할 수 있다. 이에 추정치에 대 한 잔차의 분포도를 그려 추정된 재적값이 과대⋅과소치 의 경향을 나타내는지 확인 하여야 한다. 본 연구는 최적 모델을 결정하기 위해 SAS 9.4의 PROC NLIN를 이용하 여 모수를 추정하고 분석을 진행하였다(SAS Institute Inc., 2013).
결과 및 고찰
1. 수간재적모델 재적값 산출
본 연구에는 개체목별로 흉고직경과 수고값을 이용하 여 개체목의 재적값을 산출하였다. 수피제외 재적의 경 우 국립산림과학원에서 보고한 수종별 수피두께식을 이 용하여 조사된 흉고직경 값의 대입을 하여 수피를 제외 한 data를 이용하여 산출하였다(Table 5). 또한 추정된 수 피포함, 수피제외 개체목별 재적은 각각 흉고직경과 수 고와 양의 상관관계를 이루었다(Figure 1).
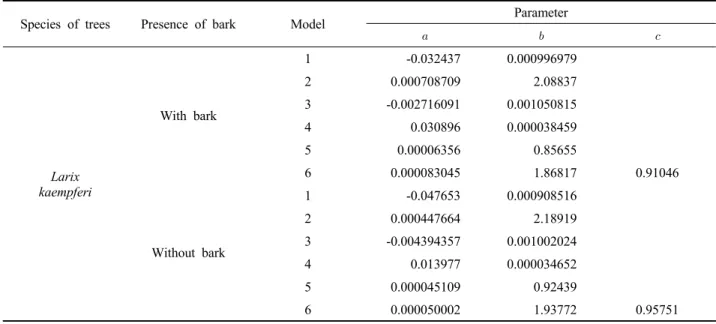
2. 수간재적모델의 파라미터 도출
수간재적모델의 파라미터값을 추정하기 위해 SAS PROC NLIN을 이용하여 도출한 수간재적모델의 파라미 터값은 다음 Table 6과 같다. 파리미터값의 통계적유의성 은 95% 신뢰수준에서 0을 포함하지 않아 통계적으로 유 의성이 있다고 판단되었다.
Statistics Calculation forms
Fitness index (FI)
Bias
Standard error of estimate as percent of the mean (SEE%) ×
Mean Absolute Deviation (MAD)
Coefficient of variation (CV%)
where = measurement, estimate and mean of weight, repectively, n = tne number of sample trees,
p = the number of model parameters
Table 4. Accuracy assessment for estimation of stem volume model.
Model Model form
Bark equation
where = double bark thickness,
= diameter at breast height,
= relative height,
= outside bark diameter by ground height,
= parameter Table 3. Bark thickness equation model.
Species of trees Parameter FI SEE
Larix kaempferi
a0 = 0.1315 a1 = 0.6852 b1 = 0.0042 b2 = 1.4640 b3 = 7.7464
0.772 0.217
Table 5. Parameters of Bark thickness model for Larix kaempferi (NIFos, 2004).
Figure 1. Relationship between diameter at breast height(DBH) and stem volume and between Height and stem volume (a: with bark, b: without bark).
Species of trees Presence of bark Model Parameter
Larix kaempferi
With bark
1 -0.032437 0.000996979
2 0.000708709 2.08837
3 -0.002716091 0.001050815
4 0.030896 0.000038459
5 0.00006356 0.85655
6 0.000083045 1.86817 0.91046
Without bark
1 -0.047653 0.000908516
2 0.000447664 2.18919
3 -0.004394357 0.001002024
4 0.013977 0.000034652
5 0.000045109 0.92439
6 0.000050002 1.93772 0.95751
Table 6. Parameters of stem volume model for Larix kaempferi.
Species of
trees Presence of
bark Model FI SEE BIAS MAD CV RANK
Larix kaempferi
With bark
1 0.9459 0.070 2E-12 0.05195 14.432 4
2 0.9443 0.071 -0.00348 0.05386 14.647 6
3 0.9452 0.071 -0.00131 0.05256 14.528 5
4 0.9907 0.029 -3E-10 0.01974 5.978 1
5 0.9887 0.032 0.00627 0.02046 6.591 3
6 0.9905 0.029 0.00144 0.01966 6.033 2
Without bark
1 0.9529 0.062 1.50E-12 0.0444 14.286 4
2 0.951 0.063 -0.0031879 0.0464 14.572 6
3 0.9524 0.062 -0.0008085 0.0445 14.359 5
4 0.9957 0.018 -2.98E-10 0.0133 4.296 1
5 0.9952 0.019 0.00285354 0.0138 4.523 3
6 0.9956 0.018 0.00081631 0.0133 4.327 2
Table 7. Statistics of stem volume model for Larix kaempferi.
Species of trees Presence of bark Model t value Pr>|t|
Larix kaempferi
With bark 1
-0.000079 0.999937
4
Without bark 1
-0.000060 0.999952
4 Table 8. Analysis of Paired T-test between Model 1 and Model 4.
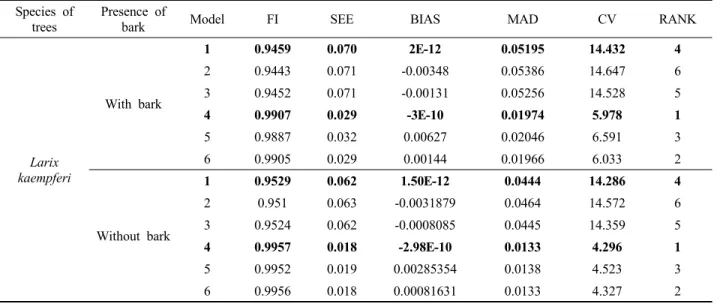
3. 수간재적모델의 적합성 검정
수간재적모델의 수종별 적합성 검정은 Table 7과 같다.
1에 근접할수록 높은 적합성을 나타내는 결정계수값은 수피를 포함한 수간재적모델은 0.945에서 0.9907까지 나 타났다. 모든 수종의 결정계수가 상당히 높은 것으로 나 타났으며 이는 적합성이 높은 것으로 판단된다.
추정값의 표준오차는 0에 근접한 값이 높은 값을 나타 내는 것으로 0.070에서 0.029로 나타났으며, 편의는 0의 값에 가깝게 나타났으며, 평균절대편의는 0.051에서 0.019로 높은 값들을 나타내었다. 변동계수는 14.43에서 5.978로 나타났으며 1변수식과 2변수식이 큰 차이를 나 타내었다. 이는 기존의 연구 된 지수식을 이용한 선행연 구 중 제주도의 동백나무 간재적모델을 추정한(Seo et al., 2016) 통계적 결과인 FI= 0.9381, SEE= 0.0258, Bias=
0.0012, MAD= 0.0192, CV= 30.4348과 비교하였을 때 전 체적으로 보다 높은 적합성을 나타냈으며, 전북 진안의 일본잎갈나무에 대한 선행연구(Jeon et al., 2007)의 최종 선정 된 모델의 통계적 결과인 FI= 0.9703, SEE= 0.0018, Bias= 0.0000, MAD= 0.0143와 비교 하였을 때 본 연구 에서 산출 된 모델의 통계값과 비슷한 수준의 적합성과 오차범위로 나타났다.
수피를 제외한 수간재적모델의 결정계수값은 0.951에 서 0.995까지 나타났으며, 추정값의 표준오차는 0.062에 서 0.019로 나타났다. 편의는 수피포함 수간재적모델과 같이 0의 값에 가깝게 나타났으며, 평균절대편의는 0.046 에서 0.013로 높은 값들을 나타내었다. 변동계수는 14.57 에서 4.29로 나타났으며 수간제외 수간재적모델 역시 흉 고직경과 수고를 이용한 2변수식이 높은 적합성을 나타 내었다. 6개의 Model 중 흉고직경과 수고를 이용한 Model 4가 가장 높은 순위를 보였다.
수피포함 수간재적모델과 수피제외 수간재적모델의 최 종선정 모델은 6개의 Model 중 2변수식인 Model 4의 순 위가 높아 최적의 식으로 판단하였다. 또한 1변수식과 2 변수식간의 통계적 유의성을 확인하고자 Model 1과 Model 4를 Paried t-test 한 결과, Model 1와 Model 4가 통계적으로 유의한 차이를 보이지 않았다. 이는 수고를 측정하는데 드는 측정시간과 고비용 작업을 줄일 수 있 고, 수고를 측정할 수 없는 상황에서는 2변수식보다 적합 성은 낮으나 1변수식 중 적합성이 가장 높은 Model 1을 이용하여 수피포함, 수피재외 수간재적을 추정할 수 있 을 것으로 판단된다(Table 8).
6개의 모델의 재적추정에 있어 Model의 정확도를 더욱
Figure 2. A comparison between residual by diameter class (a: with bark, b: without bark).
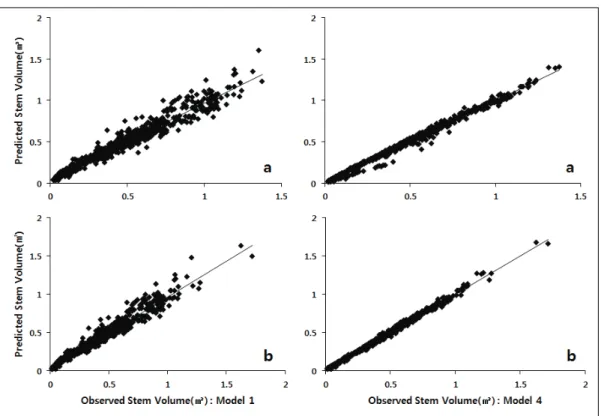
Figure 3. Comparison between Predicted stem volumes and Observed stem volumes using Model 1 and Model 4 (a: with bark, b: without bark).
판별하기 위해, 경급별 잔차를 비교하였다. 경급별 잔차 를 비교한 결과 중경목의 평균 잔차가 소경목과 대경목 의 비해 낮은 평균값을 나타내는 것을 알수있었다. 이는 중경목의 표본수가 소경목과 대경목에 비해 전체적으로 많은 표본을 가지고 있기 때문에 모형의 파라미터 추정 시 중경목을 중심으로 추정했기 때문으로 판단된다. 이 에 대경목의 재적계산은 조심스러워야 한다. 또한 대부 분의 평균 잔차값이 Table 7에서 통계값을 비교한 것과 마찬가지로 Model 4가 가장 적은 평균 잔차값을 보여주
었으며, 전체적으로 1변수식에 비해 2변수식의 평균 잔 차가 낮은 것으로 나타났다. 수피포함 수간재적모델과 수피제외 수간재적모델을 비교하여 보면 경향이 전체적 으로 비슷하게 나타으나 수피제외 수간재적모델이 보다 낮은 값으로 나타났다(Figure 2).
4. 최적 수간재적모델 검정
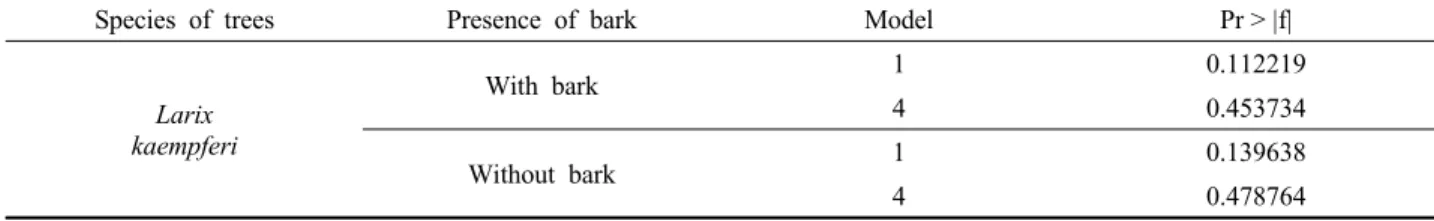
최적의 수간재적모델로 선발 된 2변수식인 Model 4과 1변수식인 Model 1을 이용하여 재적의 실측치와 추정치
를 비교하기 위하여 Zar(1996)이 이용한 F-test를 진행하 였다. 이론적으로 실측치와 추정치는 직선의 선형관계를 형성한다(Jeon et al., 2007). 즉 Predicted volume =
×observed volume으로 정의 할 수 있다. 앞에서 추 정된 Model 4와 Model 1의 추정값이 정확하다면 절편 ()는 통계적으로 0에서 다르지 않고 기울기()는 통계 적으로 1과 다르지 않을 것이다(Lee et al., 2001). 그 결 과, 수피포함, 수피제외 수간재적모델의 실측치와 추정치 의 p값이 유의수준 5%에서 통계적으로 유의한 차이가 없기 때문에 최적 수간재적모델로 Model 1과 Model 4가 적합한 것으로 판단된다. 이에 본 연구에서 제시 된 수피 포함 수간재적모델과 수피제외 수간재적모델을 이용하 여 현장에서 흉고직경 또는 흉고직경과 수고를 측정한 후 바로 재적을 추정할 수 있으며, 이는 주요 수종의 수 간재적 및 산림경영에 필요한 기초자료적 정보를 제공해 줄 것이라고 판단된다(Table 9).
결 론
본 연구는 전국에 분포하고있는 일본잎갈나무를 분석 하여 합리적인 산림경영에 필요한 정보를 제공하기 위하 여 재적에 가장 많은 영향을 주는 인자인 흉고직경과 수 고를 이용하여 수간재적모델을 추정하였다. 일본잎갈나 무의 수간재적을 추정하는데 가장 적합성이 높은 식을 선정하기 위하여 적합도지수 및 편의, 결정계수 등의 검 정통계량 값을 비교하여 분석한 결과 6개의 모델 중 Model 4( )가 가장 적합성이 높은 식으로 판명 되었고 이 식은 흉고직경과 수고를 이용하는 2변수 식으로 높은 적합성을 나타내었다. 또한 수고를 추정할 수 없는 상황에서는 흉고직경만 이용하는 1변수식은 Model 1( )이 가장 높은 높은 적합성을 나타 내었다. 비교 결과 흉고직경만 이용하는 것 보다 흉고직 경, 수고를 같이 이용하는 것이 전체적으로 수간재적의 추정력과 적합성이 높았으며 2가지 Model은 실측값과 예측값의 통계적인 유의성이 나타나지 않아 선정된 수간 재적모델로 일본잎갈나무의 재적을 구하는데 무리가 없 을 거라고 판단된다. 결과적으로 본 연구에서 제시 된 수
간재적모델은 기존에 일부지역에만 한정되어 있던 부분 을 보완하여 전국단위에 수간재적을 연구결과로 선정된 수간재적모델을 이용하여 현장에서 흉고직경 또는 흉고 직경과 수고를 측정한 후 바로 일본잎갈나무의 재적을 간단히 추정할 수 있다. 이에 산림경영에 필요한 수간재 적 및 임목축적과 같은 기초 정보를 제공해 줄 것이다.
그러나 본 수간재적모델은 일본잎갈나무의 흉고직경과 수고를 이용한 재적 추정식으로 수간의 형상은 고려하지 는 않았다. 이는 입목의 전체수간재적을 추정하는데는 무리가 없으나, 목재를 구간마다 나누는 상업적으로 이 용가능한 재적과 조재율의 산출은 어렵기 때문에 향후 수간곡선식을 이용하여 입목 단위 뿐만아니라 원목단위 의 재적을 산출할 수 있는 재적식 개발이 추가적으로 필 요한 것으로 사료된다.
References
Avery, T.E. and Burkhart, H.E. 1994. Forest Measurements.
Ed. 4th. McGraw-Hill, Inc., New York. pp. 408.
Burkhart, H.E. 1977. Cubic-Foot volume of loblolly pine to any merchantable top limit. Southern journal of applied forestry. pp. 7-9.
Dorado, F.C., Dieguez-Aranda, U., Anta, M.B., Rodriguez, M.S. and Gadow, K.V. 2006. A generalized heightdiameter model including random components for radiata pine plantation in northwestern Spain. Forest Ecology and Management. 22(9): 202-213.
Hjelm, B. 2011. Taper and volume equations for poplar trees growing on farmland in Sweden. swedish university of agricultural sciences. Department of energy and technology.
Honer, T.G. 1965. A new total cubic foot volume function.
Forestry Chronicle 41(4): 476-493.
Jeon, B.H., Lee, S.H., Lee, Y.J., Kim, H. and Kang, H.M.
2007. Estimation of Site Index and stem volume equations for Larix kaempferi stand in jinan, chonbuk. Journal of Korean Forest Society 96(1): 40-47.
Johansson, T. 2014. Stem and merchantable volume equations for hybrid aspen growing on farmland in Sweden. Swedish University of Agricultural Sciences. pp. 26.
Species of trees Presence of bark Model Pr > |f|
Larix kaempferi
With bark 1 0.112219
4 0.453734
Without bark 1 0.139638
4 0.478764
Table 9. Analysis of F-test between Model 1 and Model 4.
Kachamba, D.J. and Eid, T. 2016. Total tree, merchantable stem and branch volumemodels for miombo woodlands of Malawi. Journal of Southern Forests 2016(1): 1-11.
Kang, J.T., Son, Y.M., Kim, S.W., Park, H. and Hwang, J.S.
2014. Development of Local Stem Volume Table for Larix kaempferi using Kozak’s Stem Taper Model. Journal of Agriculture & Life Science 48(6): 119-131.
Kim, J.S., Lee, W.K., Byun, W.H. 1994. Regional stem curve and volume function model of pinus densiflora in Kangwon-province. Journal of Agriculture & Life Science 83(4): 521-530.
Ko, C.U., Kang, J.T., Son, Y.M. and Kim, D.G. 2019.
Estimating stem volume using stem taper equation for Quercus mongolica in South Korea. Forest Science and Technology 15(2): 58-62.
Korea Forest Service. 2013. Assessment of the Korea Forest Resources. pp. 59.
Korea Forest Service. 2018. Statistical Yearbook of Forestry.
pp. 444.
Kozak, A. 1988, A Variable-exponent Taper Equation.
Canadian Journal of Forest Research 18(11): 1363-1368.
Kozak, A. and Kozak, R. 2003. Does cross validation provide additional information in the evaluation of regression models. Canadian Journal of Forest Research. 33(6):
976-987
Lee, K.H., Son, Y.M., Chung, Y.G. and Lee, W.K. 1999. A taper and volume prediction system for Pinus densiflora in Kangwon province, Korea. Korea Forest Institute Journal of Forest Science 62: 155-166.
Lee, W.K. 1993. Wachstums-und Ertragsmodelle für Pinus densiflora in der Kangwon-Provinz. korea. Germany.
Dissertation, Göttingen Universtiy.
Lee, Y.J., Hong, S.C., Kim, D.G., Oh, S.H., Kim, O.S., Cho, J.U. 2001. Estimation of individual tree volumes for the Japanese red cedar plantations. Journal of Korean Forest Society 90(6): 742-746.
National Institute of Forest Science. 2004. Tree resources assessment and forecating system of major species tree.
Research Report on Korea Forest Research Institute. Seoul, Korea, pp. 123.
National Institute of Forest Science. 2012. Economic tree species4. Research Report on Korea Forest Research
Institute. Seoul, Korea, pp. 16.
National Institute of Forest Science. 2015. Stumpage volume
· Biomass and Stand yield table. Seoul, Korea, pp. 212.
SAS Institute Inc. 2013. SAS/STAT 9.4 User’s Guide. SAS Institute Inc., Cary, NC, USA.
Schlaegel, B.E. 1984. Sweetgum volume and weight tables.
Res. Pap. So-204. New Orleans, LA: U.S. Department of Agriculture, forest service, Southern Forest Experiment Station. pp. 14.
Seo, Y.O., Jung, S.C., Won, H.K. and Lee, Y.J. 2014. Taper Equation and Stem Volume Table of Cryptomeria japonica in Jeju Experimental Forests. Journal of Agriculture & Life Science 49(1): 71-77.
Seo, Y.O., Lumbres, R.I., Lee, Y.J. and Jung, S.C. 2016.
Development and Validation of Tree Volume Models for Camellia japonica in Jeju Island. Journal of Agriculture
& Life Science 50(6): 87-93.
Seo, Y.O., Lumbres, R.I., Won, H.K., Jung, S,C. and Lee, Y.J.
2015. Evaluation and validation of stem volume models for Quercus glauca in the subtropical forest of Jeju Island, Korea. Journal of Rcology and Environment 38(4):
485-491.
Son, Y.M., Jeon, J.H., Pyo, J.K., Kim, K.N., Kim, S.W. and Lee, K.H. 2012. Development of Stem Volume Table for Robinia pseudoacacia Using Kozak’s Stem Profile Model, Journal of Agriculture & Life Science 46(6): 43-49.
Son, Y.M., Kim, H., Lee, H.W., Kim, C.M., Kim, C.S., Kim, J.W., Joo, R.W. and Lee, K.H. 2009. Taper equations and stem volume table of Eucalyptus pellita and Acacia mangium plantations in Indonesia. Journal of Korean Forest Society 98(6): 633-638.
Son, Y.M., Lee, K.H., Kim, R.H. and Seo, J.H. 2007.
Development of Stem Profile and Taper Equation for Quercus acuta in Wando. Korean Journal of Forest Measurements 10 pp. 1-6.
Zar, J.H. 1996. Biostatistical Analysis. Ed. 3rd. Prentice-Hall, Inc., New Jersey. pp. 662.
Manuscript Received : August 16, 2019 First Revision : October 10, 2019 Accepted : October 11, 2019