INTRODUCTION
Measurement of nuchal translucency (NT) thickness during the first trimester has proven to be one of the single most ef- fective screening tests for fetal chromosomal abnormalities.1 However, accurate image acquisition and appropriate training of imaging professionals are essential for effective NT screen-
ing. The Fetal Medicine Foundation (FMF) has provided guide- lines in an effort to control image quality,2 and Herman, et al.3 suggested a novel image-scoring method, the Herman score, which demonstrated reliable and reproducible audit quality.
The reproducibility and compatibility of Volume NTTM soft- ware when compared with conventional two-dimensional (2D) and three-dimensional (3D) techniques has been proven in a previous study.4 Obtaining the NT measurement using the Vol- ume NTTM program is a three-stage process: 1) acquisition of the fetal head volume in the sagittal plane; 2) automatic manip- ulation of the volume to yield the mid-sagittal plane; and 3) au- tomatic vertical placement of the calipers along the widest part of the NT. Furthermore, given that image settings such as the angle of deviation from the mid-sagittal axis of the fetus, mag- nification status, tissue harmonic imaging (THI), and speckle reduction filter (SRF) influence NT measurements, these fac- tors may also affect the precision of Volume NTTM .5-8 THI en-
Image Settings Affecting Nuchal Translucency Measurement Using Volume NT TM Software
Hee Young Cho
1, Young Han Kim
1, Yong Won Park
1, Sung Yoon Kim
2, Kwang Hee Lee
2, Joon Sang Yoo
2, and Ja-Young Kwon
11Division of Maternal-Fetal Medicine, Department of Obstetrics and Gynecology, Institute of Women’s Life Medical Science, Yonsei University College of Medicine, Yonsei University Health System, Seoul;
2Samsung Medison Research and Development Center, Seoul, Korea.
Purpose: To evaluate the effects of the deviation from the mid-sagittal plane, fetal image size, tissue harmonic imaging (THI), and speckle reduction filter (SRF) on the measurement of the nuchal translucency (NT) thickness using Volume NTTM software.
Materials and Methods: In 79 pregnant women, NT was measured using Volume NTTM. Firstly, the three-dimensional volumes were categorized based on the angle of deviation in 10° intervals from the mid-sagittal plane. Secondly, the operator downsized the fetal image to less than 50% of the screen (Method A) and by magnifying the image (Method B). Next, the image was magni- fied until the fetal head and thorax occupied 75% of the screen, and the NT was measured (Method C). Lastly, NT values were ac- quired with THI and SRF functions on, with each function alternately on, and with both functions off.
Results: The mean differences in NT measurements were -0.09 mm (p<0.01) between two-dimensional (2D) and a deviation of 31–
40° and -0.10 mm (p<0.01) between 2D and 41–50°. The intraclass correlation coefficients (ICC) for 2D-NT and NT according to image size were 0.858, 0.923, and 0.928 for methods A, B, and C, respectively. The ICC for 2D-NT and NT with respect to the THI and SRF were 0.786, 0.761, 0.740, and 0.731 with both functions on, THI only, SRF only, and with both functions off, respectively.
Conclusion: NT measurements made using Volume NTTM are affected by angle deviation from the mid-sagittal plane and fetal image size. Additionally, the highest correlation with 2D-NT was achieved when THI and SRF functions were used.
Key Words: Volume NTTM software, nuchal translucency, angle deviation, image size, tissue harmonic imaging, speckle reduction filter
Yonsei Med J 2015 Sep;56(5):1345-1351
http://dx.doi.org/10.3349/ymj.2015.56.5.1345 pISSN: 0513-5796 · eISSN: 1976-2437
Received: August 29, 2014 Revised: December 10, 2014 Accepted: December 11, 2014
Corresponding author: Dr. Ja-Young Kwon, Division of Maternal-Fetal Medicine, Department of Obstetrics and Gynecology, Yonsei University College of Medicine, Yon- sei University Health System, 50-1 Yonsei-ro, Seodaemun-gu, Seoul 120-752, Korea.
Tel: 82-2-2228-2230, Fax: 82-2-313-8357, E-mail: [email protected]
•The authors have no financial conflicts of interest.
© Copyright: Yonsei University College of Medicine 2015
This is an Open Access article distributed under the terms of the Creative Com- mons Attribution Non-Commercial License (http://creativecommons.org/ licenses/
by-nc/3.0) which permits unrestricted non-commercial use, distribution, and repro- duction in any medium, provided the original work is properly cited.
ables a sharper image to be obtained without degrading the image quality caused by using a low frequency in the NT mea- surement.8 Also, speckle should be filtered out to measure the exact NT value, as speckle can be a confounding factor in the captured ultrasound image.9
In light of these findings, the aim of this study was to evalu- ate the influence of magnification, angle of acquisition, THI, and SRF on NT measurements using Volume NTTM.
MATERIALS AND METHODS
Study population and NT measurement
The present study was approved by the Institutional Review
Board of our institution. Between February 2011 and Febru- ary 2012, normal singleton pregnancies at 11+0 to 13+6 weeks of gestation that were subjected to NT screening were enrolled.
All fetuses included in this study presented normal NT values and normal neonatal outcomes. All 2D and Volume NTTM ex- aminations were carried out transabdominally using an Ac- cuvix V20 Prestige (Medison Co., Ltd., Seoul, Korea) ultrasound machine by a single expert (J.Y.K.) accredited by the FMF for the measurement of NT.
For the 2D ultrasound NT (2D-NT) measurements, a 2–6- MHz transabdominal transducer was used, while a 4–8-MHz volume transducer was used for 3D volume acquisition by Volume NTTM. The crown-rump length (CRL) and the 2D-NT were measured according to the FMF protocol.2 The 3D vol-
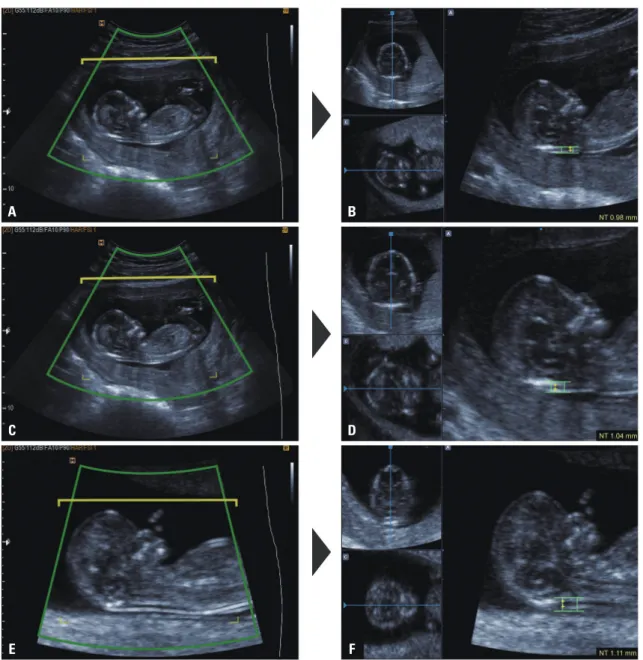
Fig. 1. Representative images of nuchal translucency (NT) thickness measurements using Volume NTTM at three different magnifications: (A and B) au- tomated NT measurement with the fetal head and thorax occupying less than 50% of the image (method A); (C and D) automated mid-sagittal recon- struction in low magnification then zoomed-in to magnify the fetus so as to occupy the whole screen (method B); (E and F) automated NT measurement with fetal head and thorax occupying the whole screen (method C).
A B
C D
E F
ume was obtained in a sagittal sweep of the fetus to include the head and thorax and stored for later analysis.
Automatic NT measurement was performed off-line using Volume NTTM as described previously.4 Briefly, the stored 3D volume was archived, and Volume NTTM was activated to yield a reconstructed mid-sagittal section. A box caliper was then placed manually at the posterior region of the fetal neck to ac- tivate automatic caliper placement at the widest NT.
Angle of acquisition
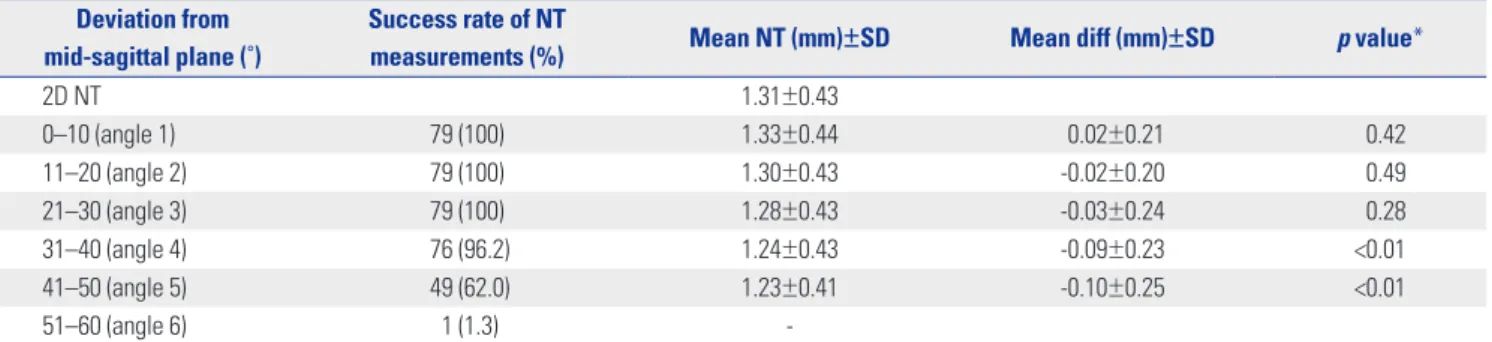
After obtaining a mid-sagittal section of the fetus with the transducer placed parallel to the nasal bone, the operator ro- tated the transducer sideways to an arbitrary angle in the range of 0–90°, and the 3D volume was acquired. When the 3D vol- ume was reconstructed using Volume NTTM to precisely deter- mine the mid-sagittal plane, the angle of deviation from the mid-sagittal plane was automatically calculated. The 3D vol- umes were categorized by the angle of deviation in 10° intervals in order to evaluate the influence of the angle of acquisition on the precision of Volume NTTM. The success rate was calcu- lated from 79 cases where NT measurements were possible at each angle deviation using Volume NTTM.
Magnification
The following magnification conditions were used to evaluate the effects of magnification on the NT measured automatical-
ly using Volume NTTM (Fig. 1):
1) Automated mid-sagittal section reconstruction and auto- mated caliper placement with the fetal head and thorax occu- pying less than 50% of the image (method A).
2) Automated mid-sagittal section reconstruction at low magnification, zoomed-in to magnify the fetus so that it occu- pied the whole screen and followed by automated caliper pla- cement (method B).
3) Automated mid-sagittal section reconstruction and auto- mated caliper placement with the fetal head and thorax occu- pying the whole screen (method C).
THI and SRF
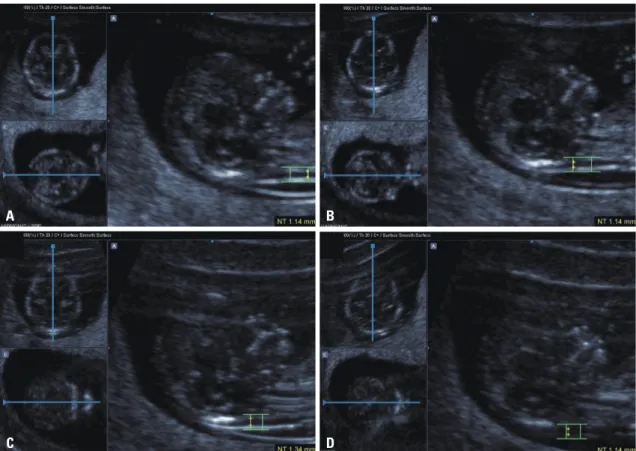
THI and a SRF were applied in order to evaluate the effect of noise reduction functions when using Volume NTTM (Fig. 2).
Values of 2D-NT with THI were acquired after achieving the best image quality by adjusting the depth, gray scale, gain, frame rate, focus, and magnification on conventional ultraso- nography. Next, THI and SRF were used when acquiring the 3D volume using Volume NTTM. These 3D volumes were acquired with both functions on, with each function on individually, and without either of the two functions. We measured the NT value using Volume NTTM on each of these four original images.
Statistical analysis
Data were analyzed using the Kolmogorov-Smirnov test to
Fig. 2. Images of effects of tissue harmonic imaging (THI) and speckle reduction filter (SRF): (A) THI and SRF functions on; (B) THI function on; (C) SRF function on; (D) both functions off.
A
C
B
D
confirm that they were normally distributed. To determine if there were differences in the NT values according to the angle of deviation, the mean difference values were compared with a paired t-test. Next, intraclass correlation coefficients (ICC) were used to examine the degree of agreement between 2D mea- surements and Volume NTTM measurements based on each image size and setting. In addition, mean differences among the values from 2D and Volume NTTM measurements were as- sessed using Bland-Altman plots. Continuous variables are presented as means±standard deviations (SDs). p-values less than 0.05 were considered statistically significant. Statistical analysis was carried out using SPSS version 18.0 (SPSS Inc., Chicago, IL, USA).
RESULTS
The characteristics of the 79 enrolled patients are summarized in Table 1. The mean NT thickness was 1.31 (±0.43) mm on 2D ultrasound, and this value was considered to be the NT value at the true mid-sagittal plane. The mean fetal NT thickness decreased as the deviation angle increased (Table 2), while the NT measurement success rate using Volume NTTM also de- creased. However, Volume NTTM did succeed in acquiring the mid-sagittal plane and measuring the NT value for all cases up to a deviation angle of 30°; nevertheless, it failed in three cases (3.8%) for deviation angles ranging from 31° to 40°. More- over, Volume NTTM was unable to obtain NT measurements for 78 cases (98.7%) at deviation angles from 51° to 60°. Four cases of NT measurement failure occurred at the stage of au-
tomated mid-sagittal plane acquisition, and once the mid- sagittal plane was acquired with Volume NTTM, NT measure- ment could be completed after placing the box caliper at the fetal posterior neck. Therefore, we believe that the angle of de- viation from the mid-sagittal plane has more of an effect on the success of Volume NTTM during acquisition of the mid- sagittal plane.
The mean differences in the NT measurements between 2D and 3D imaging were -0.09 mm (-0.14, -0.03; p<0.01) at a de- viation of 31–40° and -0.10 mm (-0.17, -0.03; p<0.01) at a devi- ation of 41–50°. Therefore, the NT value at a deviation angle greater than 31° was statistically different from the 2D-NT measurement (Table 2). Table 3 shows the mean 2D and Vol- ume NTTM measurements with respect to magnification. Mea- surements obtained using methods B and C showed greater correlation with the 2D-NT measurement than method A, and the Bland-Altman plots confirmed these results (Fig. 3).
Lastly, we evaluated the effect of THI and SRF on Volume NTTM. Table 4 shows the mean values obtained using the 2D image and Volume NTTM with respect to each function. The 2D-NT values and those obtained using Volume NTTM with THI and SRF were more highly correlated than the other func- tion conditions, and the lowest correlation between values was obtained when neither THI nor SRF were used (Fig. 4).
Table 1. Characteristics of the Study Population (n=79)
Variable Median Range
Maternal age (yrs) 32.0 26.0–42.0
Gestational age (wks) 12+1 11+0–13+6
CRL (mm) 55.1 39.0–77.9
BMI (kg/m2) 20.4 16.4–29.0
BMI, body mass index; CRL, crown-rump length.
Data are given as median (range).
Table 2. Comparison of NT Measurements According to Angle Deviation from the Mid-Sagittal Plane (n=79) Deviation from
mid-sagittal plane (˚)
Success rate of NT
measurements (%) Mean NT (mm)±SD Mean diff (mm)±SD p value*
2D NT 1.31±0.43
0–10 (angle 1) 79 (100) 1.33±0.44 0.02±0.21 0.42
11–20 (angle 2) 79 (100) 1.30±0.43 -0.02±0.20 0.49
21–30 (angle 3) 79 (100) 1.28±0.43 -0.03±0.24 0.28
31–40 (angle 4) 76 (96.2) 1.24±0.43 -0.09±0.23 <0.01
41–50 (angle 5) 49 (62.0) 1.23±0.41 -0.10±0.25 <0.01
51–60 (angle 6) 1 (1.3) -
SD, standard deviation; NT, nuchal translucency.
*p value was calculated for each NT measurement according to degree of deviation from the mid-sagittal plane, using 2D-NT as the reference.
Table 3. Mean NT Measurements and ICC for NT Measurements Using 2D and Image Size
NT measurement techniques
Mean NT
(mm)±SD ICC (95% CI)*
2D-US
FMF guideline 1.31±0.43
Volume NTTM
Method A: Zoom out_out 1.15±0.38 0.858 (0.787, 0.907) Method B: Zoom out_in 1.29±0.44 0.923 (0.882, 0.950) Method C: Zoom in_in 1.30±0.42 0.928 (0.889, 0.953) ICC, intraclass correlation coefficients; NT, nuchal translucency; FMF, Fetal Medicine Foundation; 2D, two-dimensional; US, ultrasonography; CI, confi- dence interval.
*ICC was calculated for each method, using 2D-NT as the reference.
DISCUSSION
This study suggests that Volume NTTM showed better correla- tion with 2D values when measured with a fetal head deviation of less than 30 degrees. When measuring NT with Volume NTTM, images should be magnified before setting the mid-sagit- tal plane or measuring NT according to FMF guidelines. Lastly, 2D-NT values correlated highly with NT measurements taken by Volume NTTM with THI and SRF.
Obtaining a proper fetal nuchal translucency plane for first trimester scanning requires a well-trained technician. This is the most important component of the screening procedure for achieving reproducible and standardized results. The impor- tance of the mid-sagittal plane in NT measurement has been emphasized by many authors,5,10 and NT measurement with Volume NTTM is no exception, as overestimated NT measure- ments lead to increased false-positive rates whereas underes- timated NT values lead to decreased detection rates of trisomy 21.9 Recently, use of Volume NTTM has been shown to be effec- tive in overcoming operator-dependency compared with con- ventional methods. Volume NTTM has many advantages such as high agreement with 2D-NT, more constant results, easy identification of the exact mid-sagittal plane, and time effec- tiveness in NT screening; thus, it is helpful for inexperienced operators.4
Previously, we observed that, in cases with large insonation angle deviations of over 30° from the mid-sagittal plane at the
time of volume sweep, fetal movements during volume acqui- sition, absence of amniotic fluid in front of the face, close con- tact of the fetal neck with the uterine wall, and acoustic shad- owing in the NT region caused by the maxilla led to unsucce- ssful or incorrect NT measurements using Volume NTTM.4 How- ever, exact guidelines for the effective use of Volume NTTM in the context of the plane of acquisition and image settings have not been established.
In this study, we evaluated the effects of the plane of acqui- sition, degree of magnification, and the influence of THI and SRF on measuring NT using Volume NTTM. The underestima- tion of fetal NT thickness determined using Volume NTTM in- creased as the deviation angle increased. The fetal NT values at a deviation angle greater than 40° from the mid-sagittal plane were significantly underestimated compared with the 2D measurement.
Abele, et al.5 obtained the 3D volume in the exact mid-sagit- tal plane of the fetus and measured each NT thickness by rotat- ing the head from 5° up to 25°. They found that the NT value us- ing the 3D volume was reduced by about 7% at a deviation of 5°
and the NT thickness could be measured at up to 25° of devia- tion from the mid-sagittal plane. Furthermore, Wah, et al.10 re- ported that when eight operators obtained a mid-sagittal plane using 3D volume, the mean angle of deviation was 5.7°, result- ing in an NT underestimation of 1.8%, although this did not reach statistical significance. As shown by our results, NT mea- surements did not have an effect on screening results while the angle of deviation remained less than 30°. Deviation angles ranging from 31° to 40° and from 41° to 50° were related with a decrease in the fetal NT measurement by 0.7 and 0.8 mm, re- spectively.
In addition, we demonstrated that the mean NT without magnification according to FMF guidelines differed signifi- cantly from the 2D NT measurement. Therefore, it is important to magnify images according to the FMF guidelines when us- ing Volume NTTM. Herman, et al.11 reported that NT measure- ment is significantly affected by fetal image size despite their finding that the effect of image size was negligible. Edwards, et al.6 showed that changes in image magnification from 60%
to 100% to 200% resulted in a constant decrease in the mean Fig. 3. Bland-Altman plots of the variability of nuchal translucency (NT) thickness measurements. (A) Using two-dimensional (2D) ultrasound and meth- od A of Volume NTTM, (B) 2D ultrasound and method B, and (C) 2D ultrasound and method C. Dotted lines represent mean±2 SD. US, ultrasonography.
0.4 0.2 0.0 -0.2 -0.4 -0.6 -0.8 -1.0
Mean NT: Volume NTTM method A and 2D-US (mm)
0.6 1.0 1.4 1.8 2.2 2.6 Diff between NT measurement: Volume NTTM method A and 2D-US (mm)
0.4 0.2 0.0 -0.2 -0.4 -0.6 -0.8 -1.0
Mean NT: Volume NTTM method B and 2D-US (mm)
0.6 1.0 1.4 1.8 2.2 2.6 Diff between NT measurement: Volume NTTM method B and 2D-US (mm)
0.4 0.2 0.0 -0.2 -0.4 -0.6 -0.8 -1.0
Mean NT: Volume NTTM method C and 2D-US (mm)
0.6 1.0 1.4 1.8 2.2 2.6 Diff between NT measurement: Volume NTTM method C and 2D-US (mm)
A B C
Table 4. Comparison of NT Measurements According to THI and SRF NT measurement
techniques Image setting Mean NT
(mm)±SD ICC (95% CI)*
2D-US THI 1.31±0.43
Volume NTTM THI+SRF 1.33±0.31 0.786 (0.691, 0.854) THI 1.33±0.30 0.761 (0.657, 0.836) SRF 1.50±0.33 0.740 (0.629, 0.821) None 1.39±0.34 0.731 (0.618, 0.815) THI, tissue harmonic imaging; SRF, speckle reduction filter; ICC, intraclass correlation coefficients; NT, nuchal translucency; 2D, two-dimensional; CI, confidence interval; US, ultrasonography.
*ICC was calculated for each method, using 2D-NT as the reference.
NT measurement. Another study demonstrated that 200% im- age magnification led to a significant reduction in the screen- positive rate.7 Both of these studies suggest that higher magni- fication results in greater pixelation and lower image resolution, subsequently resulting in blurring, which in turn makes the two NT margins look thicker and thereby causes relatively underestimated NT.7 Therefore, automatic tech- niques for enhancement of border detection have been devel- oped to supplement manual methods.12
We obtained the smallest NT value when using an unmag- nified fetal image or an image with a magnification of less than 50%, which is in contrast to previous studies. One reason for this discrepancy could be due to the use of an indepen- dent program algorithm by Volume NTTM for NT margin de- tection, which may be less affected by weak edges than man- ual methods. Furthermore, the two previous studies mentioned above reprocessed images acquired according to FMF guide- lines at 200% magnification, which then needed gain correc- tion8 to correct the blurred margin, whereas we used images without further processing.
We also demonstrated that NT measurements processed using THI and SRF in Volume NTTM showed similar agree- ment with 2D NT measurements. Among the four settings used in our study, THI and SRF resulted in the highest corre- lation with the 2D-NT values. However, the actual clinical sig-
nificance is likely low as the mean differences were very small.
The absolute paired differences were 0.2 mm when using SRF alone, and all others were less than 0.1 mm (data not shown).
Moreover, the SRF function caused an overestimation of the NT measurement using Volume NTTM; thus, the use of SRF should be consistent. The THI and SRF used in this study were acceptable to the clinician as these differences were not ex- treme. We found that the NT values varied: the NT value de- creased when THI was used, whereas it increased when SRF was used. This result was in line with a previous study of 2D- NT measurements.8 The use of THI with conventional 2D ul- trasound technique is associated with underestimation of NT measurement. Furthermore, one study on image setting using semi-automated methods developed by another ultrasound company also showed that the use of THI significantly re- duced the NT values.13 However, further study is necessary to determine other effects of image settings that were not exam- ined in this study, such as gain, gray map, contrast, etc., in ad- dition to different combinations of these settings.
In conclusion, for optimal results using the Volume NTTM program, we suggest that operators ensure that the sagittal volume is initiated at a plane deviated less than 30° from the precise mid-sagittal plane. Additionally, the fetus should be properly magnified prior to either volume acquisition or auto- mated caliper placement. Moreover, use of THI and SRF set- Fig. 4. Bland-Altman plots of the variability of nuchal translucency (NT) thickness measurements. (A) Using two-dimensional (2D) ultrasound and the tissue harmonic imaging (THI) and speckle reduction filter (SRF) features of Volume NTTM, (B) 2D ultrasound and THI of Volume NTTM, (C) 2D ultrasound and SRF of Volume NTTM, and (D) 2D ultrasound and both functions off. Dotted lines represent mean±2 SD. US, ultrasonography.
Mean NT: Volume NTTM THI+SRF and 2D-US (mm) 0.4 0.7 1.0 1.3 1.6 1.9 2.2 2.5 Diff between NT measurement: Volume NTTM THI+SRF and 2D-US (mm)
0.9 0.6 0.3 0.0 -0.3 -0.6 -0.9 A
Mean NT: Volume NTTM SRF and 2D-US (mm) 0.4 0.7 1.0 1.3 1.6 1.9 2.2 2.5 Diff between NT measurement: Volume NTTM SRF and 2D-US (mm)
0.9 0.6 0.3 0.0 -0.3 -0.6 -0.9 C
Mean NT: Volume NTTM THI and 2D-US (mm) 0.4 0.7 1.0 1.3 1.6 1.9 2.2 2.5 Diff between NT measurement: Volume NTTM THI and 2D-US (mm)
0.9 0.6 0.3 0.0 -0.3 -0.6 -0.9 B
Mean NT: Volume NTTM none and 2D-US (mm) 0.4 0.7 1.0 1.3 1.6 1.9 2.2 2.5 Diff between NT measurement: Volume NTTM none and 2D-US (mm)
0.9 0.6 0.3 0.0 -0.3 -0.6 -0.9 D
tings correlated with better 2D-NT measurements.
ACKNOWLEDGEMENTS
The Research and Development Center of Medison contrib- uted to the development of the algorithm for the Volume NTTM program. Part of this work by Dr. J.Y. Kwon was supported by a grant from the Korea Healthcare Technology R&D Project, Ministry for Health, Welfare & Family Affairs, Republic of Ko- rea (A084120).
REFERENCES
1. Nicolaides KH, Azar G, Byrne D, Mansur C, Marks K. Fetal nuchal translucency: ultrasound screening for chromosomal defects in first trimester of pregnancy. BMJ 1992;304:867-9.
2. The Fetal Medicine Foundation. Downs screening at 11 to 14 weeks [accessed on 2014 June]. Available at: https://fetalmedicine.org/.
3. Herman A, Dreazen E, Maymon R, Tovbin Y, Bukovsky I, Weinraub Z. Implementation of nuchal translucency image-scoring method during ongoing audit. Ultrasound Obstet Gynecol 1999;14:388-92.
4. Cho HY, Kwon JY, Kim YH, Lee KH, Kim J, Kim SY, et al. Compari- son of nuchal translucency measurements obtained using Vol- ume NT(TM) and two- and three-dimensional ultrasound. Ultra- sound Obstet Gynecol 2012;39:175-80.
5. Abele H, Wagner N, Hoopmann M, Grischke EM, Wallwiener D,
Kagan KO. Effect of deviation from the mid-sagittal plane on the measurement of fetal nuchal translucency. Ultrasound Obstet Gy- necol 2010;35:525-9.
6. Edwards A, Mulvey S, Wallace EM. The effect of image size on nu- chal translucency measurement. Prenat Diagn 2003;23:284-6.
7. Teoh M, Meagher SE, Choong S, Shekleton P, Wallace EM. The ef- fect of image size on screen-positive rates for nuchal translucency screening. BJOG 2006;113:479-81.
8. Pasquini L, Tondi F, Rizzello F, Pontello V, Paoletti E, Fontanarosa M. Impact of tissue harmonic imaging on measurement of nuchal translucency thickness. Ultrasound Obstet Gynecol 2010;36:423-6.
9. Munteanu C, Morales FC, Fernández JG, Rosa A, Déniz LG. En- hancing obstetric and gynecology ultrasound images by adapta- tion of the speckle reducing anisotropic diffusion filter. Artif Intell Med 2008;43:223-42.
10. Wah YM, Chan LW, Leung TY, Fung TY, Lau TK. How true is a ‘true’
midsagittal section? Ultrasound Obstet Gynecol 2008;32:855-9.
11. Herman A, Maymon R, Dreazen E, Caspi E, Bukovsky I, Weinraub Z. Image magnification does not contribute to the repeatability of caliper placement in measuring nuchal translucency thickness.
Ultrasound Obstet Gynecol 1998;11:266-70.
12. Lee YB, Kim MJ, Kim MH. Robust border enhancement and de- tection for measurement of fetal nuchal translucency in ultra- sound images. Med Biol Eng Comput 2007;45:1143-52.
13. Chen PW, Chen M, Leung TY, Lau TK. Effect of image settings on nuchal translucency thickness measurement by a semi-automat- ed system. Ultrasound Obstet Gynecol 2012;39:169-74.