• 검색 결과가 없습니다.

Utility of Radial Probe Endobronchial Ultrasound-Guided Transbronchial Lung Biopsy in Diffuse Lung Lesions

N/A
N/A
Protected

Academic year: 2021

Share "Utility of Radial Probe Endobronchial Ultrasound-Guided Transbronchial Lung Biopsy in Diffuse Lung Lesions"

Copied!
10
0
0

로드 중.... (전체 텍스트 보기)

전체 글

(1)

Introduction

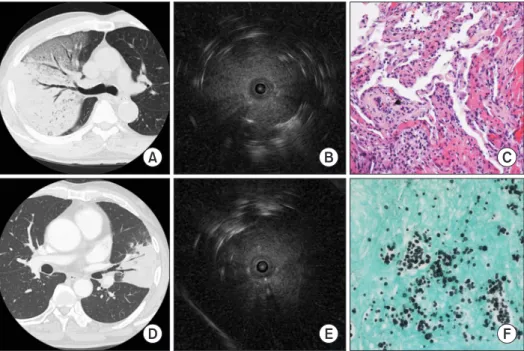
Radial probe endobronchial ultrasound (R-EBUS) is a procedure that shows the lung images around the bronchus by transmitting the ultrasound signals generated at the endo- scopic ultrasound center to the miniature probe through the driving unit. It shows a 360° view of the lung around the probe tip by advancing the probe till it reaches the pulmonary lesion through the working channel of the bronchoscope

1,2

. R-EBUS–

guided transbronchial lung biopsy (TBLB) is currently widely performed for peripheral pulmonary lesions (PPLs), such as lung nodules, to obtain tissue samples.

For PPLs, it is well known that the diagnostic yield of R- EBUS–guided TBLB is higher than that of the conventional TBLB without using R-EBUS

1,3,4

. Upon tissue diagnosis for PPLs, the diagnostic yield of conventional TBLB reportedly ranges from <20%

5

to 60%

6,7

. However, the diagnostic yield of R- EBUS–guided TBLB is known to be around 70%

1

. The reason

Utility of Radial Probe Endobronchial Ultrasound-Guided Transbronchial Lung Biopsy in Diffuse Lung Lesions

Eun Jin Kim, M.D. and Kyung Chan Kim, M.D.

Department of Internal Medicine, Daegu Catholic University Medical Center, Daegu Catholic University College of Medicine, Daegu, Korea

Background: Radial probe endobronchial ultrasound (R-EBUS) is widely used for diagnosing peripheral pulmonary lesions. However, the utility of R-EBUS–guided transbronchial lung biopsy (TBLB) for diffuse lung lesions (DLLs) remains unknown. We designed this study to evaluate the utility of R-EBUS–guided TBLB in DLLs.

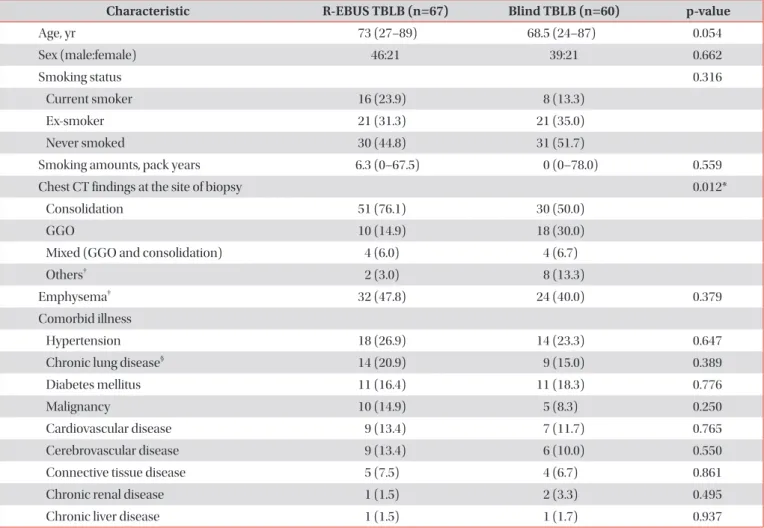
Methods: This retrospective study enrolled patients admitted from January 2016 to November 2017 who underwent TBLB for DLLs. The R-EBUS–guided TBLB and blind TBLB groups were compared. DLL was defined as any lung disorder that involved more than one segment of the lung. In both the groups, fluoroscopy and guided sheath were not used during TBLB.

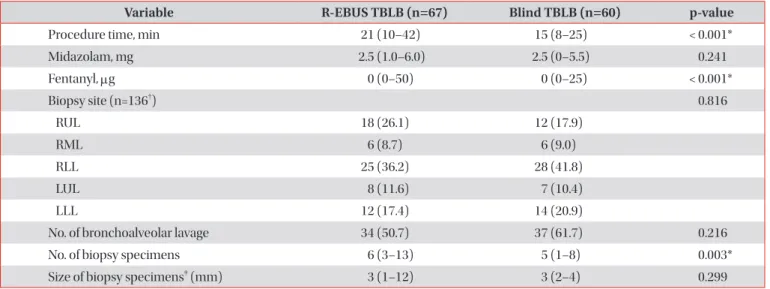
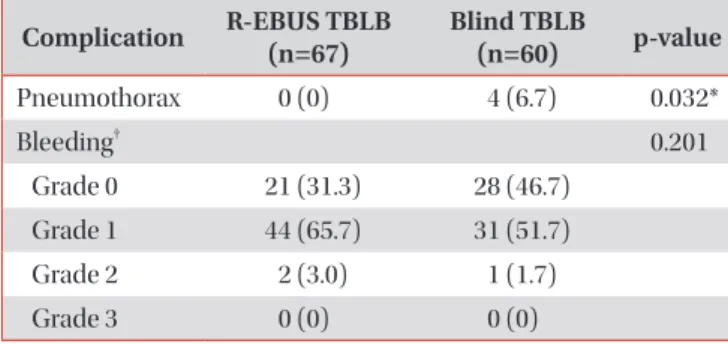
Results: A total of 127 patients underwent TBLB for DLLs (67 patients in the R-EBUS–guided TBLB group and 60 in the blind TBLB group). There were no differences in age, sex, and comorbid illnesses between the two groups. Furthermore, there was no difference in the TBLB diagnostic yield of the two groups (p=0.660) although more samples were collected from the R-EBUS–guided TBLB group (p=0.003). Procedure time was significantly longer in the R-EBUS–guided TBLB group than in the blind TBLB group (p<0.001). Thus, incidence of pneumothorax was significantly lower in the R-EBUS–

guided TBLB group than in the blind TBLB group (p=0.032).

Conclusion: Diagnostic yield in DLLs did not differ between the R-EBUS–guided TBLB and blind TBLB groups. Findings show that R-EBUS–guided TBLB in DLLs may reduce risk of pneumothorax.

Keywords: Biopsy; Bronchoscopy; Ultrasonography; Pneumothorax

Address for correspondence: Kyung Chan Kim, M.D.

Department of Internal Medicine, Daegu Catholic University Medical Center, 33 Duryugongwon-ro 17-gil, Nam-gu, Daegu 42472, Korea Phone: 82-53-650-4294, Fax: 82-53-622-2072

E-mail: [email protected] Received: Sep. 5, 2018 Revised: Dec. 18, 2018 Accepted: Mar. 27, 2019 Published online: May. 31, 2019

cc It is identical to the Creative Commons Attribution Non-Commercial License (http://creativecommons.org/licenses/by-nc/4.0/).

Copyright © 2019

The Korean Academy of Tuberculosis and Respiratory Diseases.

(2)

behind the higher diagnostic yield of R-EBUS–guided TBLB appears to be the fact that it can correctly guide the probe to- ward the location of the pulmonary lesion.

To the best of our knowledge, no studies have investigated the usefulness of R-EBUS–guided TBLB for the consolidation or ground-glass opacity (GGO) lesions involving one or more segments of the lung, namely diffuse lung lesions (DLLs), rath- er than PPLs. In this study, we aimed to determine the utility of R-EBUS–guided TBLB by performing it for diagnosing DLLs and comparing the results with those of conventional TBLB.

Materials and Methods

1. Study design and population

This retrospective study was conducted in a single institu- tion. The study population comprised patients who under- went TBLB via bronchoscopy for DLLs from among those admitted to the Department of Pulmonology of the Daegu Catholic University Medical Center from January 1, 2016 to November 30, 2017. During this period, 410 patients under- went TBLB, and excluding the 283 patients who underwent TBLB for PPLs, 127 patients underwent TBLB for DLLs.

Among the patients with DLLs, the 67 patients who under- went R-EBUS–guided TBLB were compared with the 60 who underwent conventional TBLB without using R-EBUS. This study was approved by the Institutional Review Board of the Daegu Catho lic University Medical Center (IRB No. CR-18- 109), and the requirement of written informed consent was waived due to the retrospective nature of the study.

2. Diffuse lung lesions

In general, diffuse lung diseases include all reticular, nodu- lar, alveolar, and cystic lung diseases. In a narrow sense, it refers to lung disorders, including infiltration, fibrosis, or fluid accumulation in the structures of the secondary pulmonary lobules, and has various differential diagnoses

8

. In this study, the term “DLLs” was used as a concept that contrasted PPLs.

PPLs refer to lesions surrounded by the lung parenchyma, which do not show endobronchial abnormalities in the bron- choscopy findings

9

. “DLL” was defined as a lung lesion show- ing an abnormal shadow of the lung involving one or more lung segments on chest computed tomography (CT), and the lung nodule or mass was excluded. Such abnormal shadows were mostly consolidation, GGO lesions, or a combination of both. Moreover, some micronodules, fibrosis, alveolar intersti- tial thickening, reticular opacity, and honeycombing were also included.

3. Implementation of bronchoscopy

All the bronchoscopies were performed by four experi- enced respiratory specialists with more than 10 years’ experi- ence. Two types of videobronchoscopes were used: BF-260 (Olympus, Tokyo, Japan) and BF-P260F (Olympus). For the video processor unit, EVIS LUCERA CLV-260SL (Olympus) was used, and for the ultrasonic videobronchoscope unit, EVIS EUS EU-ME2 (Olympus) was used. For the probe driv- ing unit, MAJ-1720 (Olympus) was used. For the R-EBUS probe, UM-S20-17S (Olympus) or UM-S20-20R (Olympus) was used, while for the biopsy forceps, FB-231D (Olympus) was used.

Before the procedure, in order to reduce the discomfort, pethidine was used. For the local anesthesia, lidocaine nebu- lizer was applied to the nasal cavity and the pharyngeal mucosa. Based on the patient’s pre-examination condition, conscious sedation was induced by adjusting the dose of mid- azolam, and based on the patient’s condition during the ex- amination, fentanyl was additionally used. The bronchoscopy procedure time was measured as the time from the insertion of the bronchoscope until its removal. After the procedure, in order to reverse the effect of midazolam, flumazenil was used.

During the bronchoscopy, the blood pressure, pulse rate, and oxygen saturation were monitored.

4. Blind TBLB

Blind TBLB was defined as TBLB performed using the con- ventional method, without R-EBUS guidance. All the TBLBs were performed without fluoroscopic guidance. We did not use fluoroscopy because our hospital does not possess the facility to perform fluoroscopy in the bronchoscopy suite, and fluoroscopy is not commonly used when performing TBLB.

Blind TBLB is performed in the following manner. Bronchus subjected to tissue diagnosis is checked in advance via chest CT, and a bronchoscope is inserted up to the orifice of the subsegmental bronchus. Forceps are introduced through the working channel of the bronchoscope and advanced into the part where resistance is felt or the patient complains of chest pain. After withdrawing the forceps by about 1–2 cm, the pa- tient is instructed to perform deep inspiration, and the practi- tioner waits while opening the forceps. Thereafter, the patient is instructed to perform deep expiration, at the end of which, the forceps are advanced into the distal portion by about 1 cm, and are then closed to perform biopsy

10

.

5. R-EBUS–guided TBLB

The method of performing R-EBUS–guided TBLB is as

follows. First, the biopsy site is checked in advance using the

chest CT image, and a bronchoscope is inserted up to the ori-

fice of the subsegmental bronchus. R-EBUS is introduced into

(3)

the subsegmental bronchus, and ultrasound image is used to determine whether it is a lesion site. If the image is not visible clearly, a proper position is searched by assessing the nearby subsegmental bronchus until a proper image is visible.

Once the location of the subsegmental bronchus of the lung lesions is confirmed with R-EBUS, adhesive medical tape is placed at the site where the orifice of the patient’s nostril meets the bronchoscope, to mark the location. Then, the assistant is instructed to tightly hold the part so that the bronchoscope does not move proximally or distally. The R-EBUS image is then observed while the R-EBUS is slowly pulled back proxi- mally after being pushed toward the end of the subsegmental bronchus, the location of which has been confirmed. The R- EBUS is pulled back proximally as far as possible, within the range where a proper and clear image is visible. If the original clear image is not visible, because the image changes while the R-EBUS is being moved proximally, the R-EBUS should again be slightly pushed distally to find the location where a clean image is visible. The R-EBUS is pushed about 0.5 cm fur- ther distally from the proximal portion where a proper image is visible. This position is considered the reference point for R- EBUS–guided TBLB.

At this reference point, adhesive medical tape is affixed to the junction where the R-EBUS probe and the inlet of the

working channel of the bronchoscope meet. The R-EBUS probe is then removed from the bronchoscope and is aligned with the biopsy forceps on the disinfected table. The location 1 cm proximal to the marked part with adhesive medical tape is then marked, thereafter, the adhesive medical tape is affixed to the same location on the forceps. The reason that the location indicated on the forceps was not marked the same as the loca- tion of the probe but was marked 1 cm outside of the location indicated on the probe was to make TBLB possible even at a 1 cm further distal area from the reference point.

The biopsy forceps prepared as mentioned above should then be introduced into the bronchoscope working channel, and the area marked with an adhesive medical tape should be located 1 cm away from the inlet of the working channel of the bronchoscope.

At this time, the tip of the forceps is located at the aforemen- tioned reference point. Then the forceps should be opened when the patient inhales deeply, as instructed. The forceps should then be closed when the patient exhales deeply, to per- form the biopsy. If the biopsy specimen is not obtained in this manner, the procedure should be repeated, and biopsy should be performed by pushing the forceps 0.5–1 cm further distal from the area marked with the adhesive medical tape.

The R-EBUS–guided TBLB performed in this study did not

Figure 1. Consolidation. Case 1 was that of a 74-year-old man with dyspnea. (A) Chest computed tomography (CT) showing lobar consolida-

tion with air bronchogram in the right upper lobe. (B) Radial probe endobronchial ultrasound (R-EBUS) in the posterior segmental bronchus

of the right upper lobe revealing a homogenous, isoechoic tissue-like pattern around the probe and some hyperechoic dots away from the

probe. (C) Histopathologic specimen from transbronchial lung biopsy (TBLB) showing chronic inflammation with organizing pneumonia

pattern (H&E stain, ×200). His final diagnosis was organizing pneumonia secondary to bacterial infection. Case 2 was that of a 73-year-old

man with febrile sensation. (D) Chest CT showing segmental consolidation in the lingular segment of the left upper lobe. (E) R-EBUS reveal-

ing a homogenous and isoechoic pattern around the probe. (F) Histopathologic specimen from TBLB showing round yeast-like fungi (Go-

mori’s methenamine silver stain, ×400). His final diagnosis was pulmonary cryptococcosis.

(4)

involve the use of a guided sheath (GS) because such a GS has not been approved for TBLB in DLLs in South Korea. More- over, fluoroscopy was not used for the same reason as blind TBLB when performing R-EBUS–guided TBLB.

6. R-EBUS image findings

Consolidation on chest CT was observed as an isoechoic tissue-like pattern

11

in R-EBUS (Figure 1). GGO lesions have the same snowstorm appearance observed in the normal lung; however, they show a more hyperechoic and coarse R- EBUS signal, called the “blizzard sign.” When a solid part or a consolidation component is included in the GGO lesions,

“mixed blizzard signs”

12,13

are visible. These signs show dif- fuse heterogeneity with several hyperechoic dots and vessels (Figure 2). In this study, when the probe was inserted and the aforementioned findings appeared, it was judged that the probe was in the target lesion. However, not only the above- mentioned typical findings, but also various other findings were observed in many lesions. Therefore, when similar or mixed findings were obtained, the probe was considered to have been inserted in the lesion. In this study, R-EBUS–guided TBLB was formally performed after six months of the learning period.

7. Final diagnosis

The final diagnosis was based on the patient’s symptoms, clinical course, chest CT, bronchoalveolar lavage (BAL) fluid results (if available), laboratory tests, microbiological results, and the pathology results of the biopsy.

In the final diagnosis, bacterial pneumonia was defined as (1) typical clinical manifestation of pneumonia (fever, in- creased cough with sputum production, change in the shadow on chest radiography, and increased inflammatory markers) and the presence of bacteria in the microbiological examina- tion; or (2) typical clinical manifestations of pneumonia but negative microbiological results of bacteria, neutrophil pre- dominance in the result of BAL (if available), and improved clinical manifestation following antibiotics treatment. Cryp- togenic organizing pneumonia was defined as a case where it was diagnosed through lung biopsy results, and the exclusion of any possible cause (which may be relatively evident or re- quire more laborious etiological tests)

14

. Secondary organizing pneumonia was defined as a case (1) where it was diagnosed based on the lung biopsy results, showed clinical manifesta- tion and positive results in etiological tests, or (2) where there were pneumonia-like chest radiography findings, lymphocyte predominance was shown in the result of BAL, and the clini- cal manifestation improved after steroid therapy

14

. Connective

Figure 2. Ground-glass opacity (GGO). Case 3 was that of an 82-year-old man with dyspnea. (A) Chest computed tomography (CT) showing

GGO in the posterior segment of the right upper lobe. (B) Radial probe endobronchial ultrasound (R-EBUS) revealing a mixed blizzard sign

containing a heterogeneous acoustic shadow with hyperechoic dots, linear arcs, and vessels. (C) Histopathologic specimen from transbron-

chial lung biopsy (TBLB) showing organizing pneumonia pattern with focal atypical cells (H&E, ×200). His final diagnosis was cryptogenic

organizing pneumonia. Case 4 was that of a 79-year-old man with febrile sensation. (D) Chest CT showing GGO in the right lower lobe. (E)

R-EBUS in the anterobasal segmental bronchus of the right lower lobe, revealing a mixed blizzard sign. (F) Histopathologic specimen from

TBLB showing organizing pneumonia (H&E stain, ×200). His final diagnosis was organizing pneumonia secondary to bacterial infection.

(5)

tissue disease (CTD)–associated interstitial lung disease (ILD) was defined as interstitial pneumonia on chest CT in patients with CTD without any evidence of infectious or other lung diseases

15

. Eosinophilic pneumonia included idiopathic acute eosinophilic pneumonia and chronic eosinophilic pneumo- nia.

8. TBLB diagnostic yield

The diagnostic yield was defined as the percentage of bi- opsy results that matched the final diagnosis. When chronic inflammation was indicated in the biopsy results, it was considered non-diagnostic while determining the diagnostic yield. Although most chronic inflammation cases show clini-

cal progression to pneumonia, and TBLB results help rule out other diseases, chronic inflammation is a nonspecific finding and cannot be diagnosed as a specific disease based only on the biopsy result. Organizing pneumonia was considered diagnostic regardless of whether it was secondary or crypto- genic. Malignancy was considered diagnostic when calculat- ing the TBLB diagnostic yield. Further, granulomatous inflam- mation was considered diagnostic if acid-fast bacilli smear or tuberculosis polymerase chain reaction assay was found to be positive in the biopsy tissue. Interstitial inflammation was con- sidered non-diagnostic, and if the finding suggesting bacterial pneumonia was reported in biopsy results, it was considered diagnostic.

Table 1. Baseline characteristics of the patients

Characteristic R-EBUS TBLB (n=67) Blind TBLB (n=60) p-value

Age, yr 73 (27–89) 68.5 (24–87) 0.054

Sex (male:female) 46:21 39:21 0.662

Smoking status 0.316

Current smoker 16 (23.9) 8 (13.3)

Ex-smoker 21 (31.3) 21 (35.0)

Never smoked 30 (44.8) 31 (51.7)

Smoking amounts, pack years 6.3 (0–67.5) 0 (0–78.0) 0.559

Chest CT findings at the site of biopsy 0.012*

Consolidation 51 (76.1) 30 (50.0)

GGO 10 (14.9) 18 (30.0)

Mixed (GGO and consolidation) 4 (6.0) 4 (6.7)

Others

2 (3.0) 8 (13.3)

Emphysema

32 (47.8) 24 (40.0) 0.379

Comorbid illness

Hypertension 18 (26.9) 14 (23.3) 0.647

Chronic lung disease

§

14 (20.9) 9 (15.0) 0.389

Diabetes mellitus 11 (16.4) 11 (18.3) 0.776

Malignancy 10 (14.9) 5 (8.3) 0.250

Cardiovascular disease 9 (13.4) 7 (11.7) 0.765

Cerebrovascular disease 9 (13.4) 6 (10.0) 0.550

Connective tissue disease 5 (7.5) 4 (6.7) 0.861

Chronic renal disease 1 (1.5) 2 (3.3) 0.495

Chronic liver disease 1 (1.5) 1 (1.7) 0.937

Values are presented as median (range) or number (%).

*Statistically significant difference between the R-EBUS and blind TBLB groups at p<0.05 with the chi-square test.

Others: micronodules, fibrosis and alveolar interstitial thickening.

It is defined when emphysema is observed on chest CT irrespective of presence of respiratory symptoms, or abnormal pulmonary function test results. The reason for distinguishing emphysema from other comorbidities, is that it exerts a considerable influence on the incidence of pneumothorax.

§

It includes the following diseases: chronic obstructive pulmonary disease, bron- chiectasis, post-tuberculous destroyed lung and pneumoconiosis.

R-EBUS: radial probe endobronchial ultrasound; TBLB: transbronchial lung biopsy; CT: computed tomography; GGO: ground-glass opacity.

(6)

9. TBLB complications

Chest radiography was performed within 3 hours after TBLB to confirm the presence of pneumothorax, and TBLB- related bleeding was also checked. The amount of endobron- chial bleeding was classified into four stages, ranging from grade 0 to grade 3. Grade 0 was defined as the condition where there was no need for other procedures because of no or little bleeding after the biopsy. Grade 1 comprised cases where suc- tion was performed because of bleeding after the biopsy; how- ever, other endoscopic procedures were not needed. Grade 2 defined cases where an endoscopic procedure for bronchial occlusion was required because of bleeding after the biopsy, or where ice-cold saline was instilled. Grade 3 included cases of severe bleeding requiring surgical intervention or admis- sion to the intensive care unit for hemodynamic or respiratory instability that could not be managed endoscopically

16,17

. 10. Statistical analyses

The test results were expressed as the absolute values, per- centages, as well as mean and standard deviation values for normal continuous variables. The median, maximum and minimum values were calculated for non-normal variables.

For comparing the various quantitative factors of the clinical characteristics and the biopsy-related outcomes between the R-EBUS–guided TBLB and blind TBLB groups, the Mann- Whitney U test was used. The qualitative factors and biopsy results of the two groups were compared using the chi-square test. Statistical significance was set at p<0.05. For statistical

analyses, SPSS version 25 (IBM Corp., Armonk, NY) was used.

Results

Total 127 patients were included in the study. R-EBUS–

guided TBLB was performed for 67 patients, and blind TBLB was performed for 60. The median age of the patients in the R-EBUS–guided TBLB group was 73 years (range, 27–89 years), higher than the median age of 68.5 years (range, 24–87 years) in the blind TBLB group, however, the difference was not statistically significant (p=0.054). There were no differ- ences in the male:female ratio, smoking status, presence of emphysema, and comorbid illnesses between the two groups.

In the chest CT findings of the lung lesions where biopsy was performed, consolidation was more frequent in the R-EBUS–

guided TBLB group, and GGO was more frequent in the blind TBLB group (p=0.012) (Table 1).

With respect to the procedure time, the median duration in the R-EBUS–guided TBLB group was 21 minutes (range, 10–42 minutes), significantly longer than the median of 15 minutes (range, 8–25 minutes) in the blind TBLB group (p<0.001). There was no difference in the administered dose of midazolam, the sedative used during the procedure, be- tween the two groups (p=0.241). However, the administered dose of the analgesic, fentanyl, was significantly higher in the R-EBUS–guided TBLB group than in the blind TBLB group (p<0.001). In terms of the TBLB location, the right lower lobe was the most common site in both the groups, and there was no difference between the groups. In nine cases, biopsy was

Table 2. Comparison of the TBLB-related outcomes

Variable R-EBUS TBLB (n=67) Blind TBLB (n=60) p-value

Procedure time, min 21 (10–42) 15 (8–25) < 0.001*

Midazolam, mg 2.5 (1.0–6.0) 2.5 (0–5.5) 0.241

Fentanyl, µg 0 (0–50) 0 (0–25) < 0.001*

Biopsy site (n=136

) 0.816

RUL 18 (26.1) 12 (17.9)

RML 6 (8.7) 6 (9.0)

RLL 25 (36.2) 28 (41.8)

LUL 8 (11.6) 7 (10.4)

LLL 12 (17.4) 14 (20.9)

No. of bronchoalveolar lavage 34 (50.7) 37 (61.7) 0.216

No. of biopsy specimens 6 (3–13) 5 (1–8) 0.003*

Size of biopsy specimens

(mm) 3 (1–12) 3 (2–4) 0.299

Values are presented as median (range) or number (%).

*Statistically significant difference between the R-EBUS and blind TBLB groups at p<0.05 with the Mann-Whitney U test.

Biopsy was per- formed in two lobes in nine patients.

The size of the biopsy specimens was directly measured on a pathology slide in a pathology laboratory.

TBLB: transbronchial lung biopsy; R-EBUS: radial probe endobronchial ultrasound; RUL: right upper lobe; RML: right middle lobe; RLL: right

lower lobe; LUL: left upper lobe; LLL: left lower lobe.

(7)

performed in two different lobes. The number of BAL tests be- tween the R-EBUS–guided TBLB and blind TBLB groups was similar (p=0.216). The median number of obtained biopsy specimens was 6 (range, 3–13 pieces) in the R-EBUS–guided TBLB group, significantly higher than the median number of 5 (range, 1–8 pieces) in the blind TBLB group (p=0.003). The median size of the obtained biopsy specimens was similar be- tween the two groups (p=0.299) (Table 2).

With respect to the procedure-related complications, pneu- mothorax did not occur in the R-EBUS–guided TBLB group while it was observed in four cases in the blind TBLB group, showing a significantly lower incidence of pneumothorax in the R-EBUS–guided TBLB group (p=0.032). Among the four cases of pneumothorax that occurred in the blind TBLB group, a chest tube was inserted in one case, and the three other cases improved after observation with the administra- tion of oxygen.

Bleeding was comparable in the two groups (p=0.201).

There were 21 cases in the R-EBUS–guided TBLB group that did not require other endoscopic procedures (grade 0), and 28 in the blind TBLB group. There were 44 cases requiring suction after the intrabronchial instillation of epinephrine or tranexamic acid (grade 1) in the R-EBUS–guided TBLB group, and 31 in the blind TBLB group. There were two cases with instillation of ice-cold saline due to severe bleeding (grade 2) in the R-EBUS–guided TBLB group and one case in the blind TBLB group. No patient required surgical intervention or admission to the intensive care unit due to endoscopically un- controlled bleeding (grade 3) in either group (Table 3).

In terms of the biopsy results, chronic inflammation was most common in both groups, followed by organizing pneu- monia, malignancy, and granulomatous inflammation (Table 4). There was no statistically significant difference in the biopsy results of the two groups (p=0.385). In terms of the final diag- nosis, bacterial pneumonia was the most common diagnosis

in both the groups, followed by malignancy, secondary orga- nizing pneumonia, and tuberculosis (Table 5). There was no statistically significant difference in the final diagnosis between the groups (p=0.287). The diagnostic yield was 52.2% in the R- EBUS–guided and 48.3% in the blind TBLB group (p=0.660).

Discussion

Various diseases exhibit DLL findings on chest CT, and dis- tinguishing these diseases is challenging before tissue diagno- sis. TBLB is the first procedure that should be performed for

Table 3. Comparison of the TBLB-related complications Complication R-EBUS TBLB

(n=67) Blind TBLB

(n=60) p-value

Pneumothorax 0 (0) 4 (6.7) 0.032*

Bleeding

0.201

Grade 0 21 (31.3) 28 (46.7)

Grade 1 44 (65.7) 31 (51.7)

Grade 2 2 (3.0) 1 (1.7)

Grade 3 0 (0) 0 (0)

Values are presented as number (%).

*Statistically significant difference at p<0.05 with chi-square test between the R-EBUS and blind TBLB groups.

Bleeding severity is classified on an adapted scale: Grade 0, no bleeding; grade 1, bleed- ing requiring suction to clear but no other endoscopic procedures;

grade 2, bleeding requiring endoscopic procedures (bronchial occlusion-collapse and/or instillation of ice-cold saline); grade 3, severe bleeding not controlled endoscopically, causing hemody- namic or respiratory instability, requiring surgical interventions or admission to the intensive care unit

16,17

.

TBLB: transbronchial lung biopsy; R-EBUS: radial probe endobron- chial ultrasound.

Table 4. Comparison of the TBLB results

Biopsy result R-EBUS TBLB (n=67) Blind TBLB (n=60) Total (n=127)

Chronic inflammation 28 (41.8) 25 (41.7) 53 (41.7)

Organizing pneumonia 21 (31.3) 11 (18.3) 32 (25.2)

Malignancy 9 (13.4) 10 (16.7) 19 (15.0)

Granulomatous inflammation 6 (9.0) 9 (15.0) 15 (11.8)

Interstitial inflammation 1 (1.5) 1 (1.7) 2 (1.6)

Pneumonia 0 (0) 2 (3.3) 2 (1.6)

Cryptococcosis 1 (1.5) 0 (0) 1 (0.8)

Others* 1 (1.5) 2 (3.3) 3 (2.4)

Values are presented as number (%).

There were no statistically significant differences in the chi-square test between the R-EBUS and blind TBLB groups (p=0.385).

*Others: anthracosis one case, atypical cell one case, atypical gland one case.

TBLB: transbronchial lung biopsy; R-EBUS: radial probe endobronchial ultrasound.

(8)

the diagnosis of DLLs. TBLB can help diagnose diseases that invade around the terminal and the respiratory bronchioles, such as respiratory bronchiolitis, tuberculosis, lobular infec- tious pneumonia, and cellular bronchiolitis. Moreover, tissue diagnosis for diseases distributed along the lymphatics, such as sarcoidosis and lymphangitic carcinomatosis, can be es- tablished relatively easily with TBLB

8,18

. However, when TBLB is performed without fluoroscopic guidance, the practitioner cannot ascertain if the location where the TBLB is performed is the target lesion on chest CT. In this case, if the accurate location information for the lesion can be obtained using R- EBUS, it will be helpful in performing TBLB. Moreover, R- EBUS does not involve radiation hazard and can be easily used with a probe when performing bronchoscopy.

In the study conducted by Descombes et al.

19

that ana- lyzed 530 transbronchial biopsy results, the diagnostic yield was 38% when there were 1–3 tissue fragments; however, it was significantly higher at 69% when there were 6–10 tissue fragments. In the R-EBUS–guided TBLB group, there were 6 (range, 3–13) biopsy specimens, while in the blind TBLB group, there were 5 (range, 1–8), showing that a significantly larger number of specimens was obtained in the R-EBUS–

guided TBLB group (p=0.003). However, in terms of the diag- nostic yield, there was no significant difference between the two groups (p=0.660). This may be attributable to the fact that

the difference in the number of tissues used in this study was not large enough to achieve a diagnostic difference, as in the study by Descombes et al.

19

(wherein the numbers of tissues were 1–3 vs. 6–10).

The use of same-size biopsy forceps in this study is believed to be a reason for the lack of a difference in the diagnostic yield of DLLs between the two groups. In fact, there was no signifi- cant difference in the size of the biopsy specimens obtained between the R-EBUS-guided TBLB and blind TBLB groups.

Recently, several studies have reported that transbronchial cryobiopsy in ILD increases the diagnostic yield

17,20

. This is believed to be attributable to the fact that the tissue was sig- nificantly larger than the one obtained using conventional for- ceps. As per the study by Loube et al.

21

, the large-forceps group can obtain significantly more tissues as compared to the small- forceps group, potentially affecting the diagnostic yield.

The most significant result of this study was the difference in the incidence of the TBLB complication pneumothorax. There was no case of pneumothorax in the R-EBUS–guided TBLB group while four cases were observed in the blind TBLB group, showing that the incidence of pneumothorax was significantly lower in the R-EBUS–guided TBLB group (p=0.032). The in- cidence of pneumothorax complication due to conventional TBLB has been reported as 5.0%–5.5%

22,23

, and up to 14.3%

cases have been reported with the use of mechanical venti- Table 5. Comparison of the final diagnosis

Final diagnosis R-EBUS TBLB (n=67) Blind TBLB (n=60) Total (n=127)

Diagnostic yield* 35/67 (52.2) 29/60 (48.3)

Bacterial pneumonia 20 (29.9) 13 (21.7) 33 (26.0)

Malignancy 10 (14.9) 11 (18.3) 21 (16.5)

Secondary organizing pneumonia 10 (14.9) 10 (16.7) 20 (15.7)

Tuberculosis 7 (10.4) 9 (15.0) 16 (12.6)

Cryptogenic organizing pneumonia 7 (10.4) 1 (1.7) 8 (6.3)

CTD-associated ILD 1 (1.5) 4 (6.7) 5 (3.9)

Eosinophilic pneumonia 2 (3.0) 2 (3.3) 4 (3.1)

Idiopathic pulmonary fibrosis 1 (1.5) 3 (5.0) 4 (3.1)

Hypersensitivity pneumonitis 0 (0) 4 (6.7) 4 (3.1)

NTM lung disease 2 (3.0) 1 (1.7) 3 (2.4)

Radiation pneumonitis 2 (3.0) 0 (0) 2 (1.6)

Nonspecific interstitial pneumonia 1 (1.5) 1 (1.5) 2 (1.6)

Sarcoidosis 1 (1.5) 1 (1.7) 2 (1.6)

Cryptococcosis 1 (1.5) 0 (0) 1 (0.8)

Others

2 (3.0) 0 (0) 2 (1.6)

Values are presented as number (%).

*The diagnostic yield was defined as the percentage of biopsy results that matched the final diagnosis (p=0.660).

Others: amyloidosis one case, pulmonary alveolar proteinosis one case.

R-EBUS: radial probe endobronchial ultrasound; TBLB: transbronchial lung biopsy; CTD: connective tissue disease; ILD: interstitial lung dis-

ease; NTM: non-tuberculous mycobacterium.

(9)

lation

24

. The incidence of total complications caused by R- EBUS–guided TBLB performed in PPLs varies from 0%

25-27

to 7.4%

28

. In particular, the incidence of pneumothorax is known to be between 0%

25,27,29,30

and 5.1%

31

. As per a meta-analysis of R-EBUS-guided TBLB studies conducted by Steinfort et al.

4

, the pooled rate of pneumothorax in 14 clinical studies was 1.0% (11 out of 1,090 cases). In the present study on DLLs, the incidence of pneumothorax was also lower in the R-EBUS–

guided TBLB group, indicating an apparent advantage of such a procedure.

Biopsy performed at a location <1 cm away from the pleura increases the risk of pneumothorax

32

. However, if biopsy is performed at a point that is extremely proximal to avoid the occurrence of pneumothorax, the risk of severe bleeding in- creases. For interstitial lung lesions, performing biopsy closer to the secondary pulmonary lobule (at a more distal location) is known to be appropriate for tissue diagnosis

33

. Therefore, the location for biopsy performance that allows us to obtain appropriate tissue samples and minimizes the occurrence of pneumothorax and bleeding complications is important. In the present study, the incidence of pneumothorax was low be- cause TBLB was performed in the proximal area, as far away as possible from the pleura, while observing the ultrasound images when performing R-EBUS. Moreover, the frequency of bleeding did not differ between the two groups. This may be because biopsy was performed at 1–1.5 cm distal to the posi- tion from where the R-EBUS image was properly observed.

Thus, R-EBUS–guided TBLB is considered a safe lung tissue acquisition method that can minimize the occurrence of pneumothorax and bleeding complications. R-EBUS can help determine the appropriate depth of TBLB without complica- tions in the DLLs.

The disadvantage of using R-EBUS–guided TBLB is its pro- longed procedure time. The procedure time of the R-EBUS–

guided TBLB group was 21 minutes (range, 10–42 minutes);

this was significantly longer than the procedure time of 15 minutes (range, 8–25 minutes) in the blind TBLB group. The reason for this longer duration is that the time for observing pulmonary lesion images through R-EBUS was included, and the number of samples for R-EBUS–guided TBLB was higher.

Despite the prolonged procedure time of R-EBUS–guided TBLB, there was no difference in the midazolam dose used during the procedure. This is believed to be attributable to the additional use of fentanyl instead of midazolam for appropri- ate sedation of the patients during R-EBUS–guided TBLB. In the future, if the same number of samples is used for R-EBUS–

guided TBLB as those for blind TBLB, the administered fen- tanyl dose will decrease, reducing the procedure time.

Lichtenstein et al.

11

reported that alveolar consolidation in lung ultrasound is an echo structure with a density similar to that of liver parenchyma, and has a tissue-like pattern. In R- EBUS, the interior of the large consolidation was homogenous and appeared to have an isoechoic and tissue-like pattern;

the borderline of the consolidation was seen as a hyperechoic shadow (Figure 1). Izumo et al.

12

reported that pure GGO was seen as a “blizzard sign” in R-EBUS (i.e., a diffuse hyperintense acoustic shadow). As the solid part of the GGO increased, the proportion of the “mixed blizzard sign” increased, indicating a combination of diffuse heterogeneity with hyperechoic dots, vessels and “blizzard sign.” Based on these findings, it may be possible to determine the precise location for TBLB if R-EBUS images suitable for each lesion type can be observed when the lung lesion is seen as a consolidation, GGO, or a mixed lesion.

In this study, TBLB was performed by observing the isoechoic tissue-like pattern or mixed blizzard sign rather than the bliz- zard sign (Figure 2). The R-EBUS findings that can define ILD lesions including honeycomb or reticular lesions remain un- known; this is a disadvantage of using R-EBUS.

This study has certain limitations. First, it is a retrospective study conducted in a single institution. Further, the number of biopsy specimens at the time of the R-EBUS–guided TBLB was large, and this influenced the procedure time, restricting the comparison of the results obtained under the same condi- tion in the two groups. TBLB was performed without fluoros- copy guidance; this may have partially affected the diagnostic yield of blind TBLB and the incidence of pneumothorax. In addition, in ILD consisting of honeycomb, reticulation or fi- brotic lesions, R-EBUS–guided TBLB could not be performed because a proper ultrasound image, could not be obtained;

this may be a reason for the non-occurrence of pneumotho- rax. To address these limitations, prospective studies are re- quired to be conducted in the future.

Authors’ Contributions

Conceptualization: Kim KC. Methodology: all authors. For- mal analysis: Kim EJ. Data curation: Kim EJ. Software: Kim EJ.

Validation: Kim KC. Investigation: Kim EJ. Writing - original draft preparation: Kim EJ. Writing - review and editing: Kim KC. Approval of final manuscript: all authors.

Conflicts of Interest

No potential conflict of interest relevant to this article was reported.

References

1. Ali MS, Trick W, Mba BI, Mohananey D, Sethi J, Musani AI.

Radial endobronchial ultrasound for the diagnosis of pe- ripheral pulmonary lesions: a systematic review and meta- analysis. Respirology 2017;22:443-53.

2. Anantham D, Koh MS, Ernst A. Endobronchial ultrasound.

(10)

Respir Med 2009;103:1406-14.

3. Wang Memoli JS, Nietert PJ, Silvestri GA. Meta-analysis of guided bronchoscopy for the evaluation of the pulmonary nodule. Chest 2012;142:385-93.

4. Steinfort DP, Khor YH, Manser RL, Irving LB. Radial probe endobronchial ultrasound for the diagnosis of peripheral lung cancer: systematic review and meta-analysis. Eur Respir J 2011;37:902-10.

5. Wallace JM, Deutsch AL. Flexible fiberoptic bronchoscopy and percutaneous needle lung aspiration for evaluating the solitary pulmonary nodule. Chest 1982;81:665-71.

6. Baaklini WA, Reinoso MA, Gorin AB, Sharafkaneh A, Manian P. Diagnostic yield of fiberoptic bronchoscopy in evaluating solitary pulmonary nodules. Chest 2000;117:1049-54.

7. Lee N, Kim SH, Kwon W, Lee MK, Yong SJ, Shin KC, et al. The effects of bronchoscope diameter on the diagnostic yield of transbronchial lung biopsy of peripheral pulmonary nodules.

Tuberc Respir Dis 2014;77:251-7.

8. Poletti V, Chilosi M, Olivieri D. Diagnostic invasive procedures in diffuse infiltrative lung diseases. Respiration 2004;71:107-19.

9. Huang CT, Tsai YJ, Liao WY, Wu PC, Ho CC, Yu CJ, et al. Endo- bronchial ultrasound-guided transbronchial biopsy of periph- eral pulmonary lesions: how many specimens are necessary?

Respiration 2012;84:128-34.

10. Huang Y, Huang H, Li Q, Browning RF, Parrish S, Turner JF Jr, et al. Transbronchial lung biopsy and pneumothorax. J Tho- rac Dis 2014;6(Suppl 4):S443-7.

11. Lichtenstein DA, Lascols N, Meziere G, Gepner A. Ultrasound diagnosis of alveolar consolidation in the critically ill. Inten- sive Care Med 2004;30:276-81.

12. Izumo T, Sasada S, Chavez C, Matsumoto Y, Tsuchida T. Radi- al endobronchial ultrasound images for ground-glass opacity pulmonary lesions. Eur Respir J 2015;45:1661-8.

13. Izumo T. Radial endobronchial ultrasound findings. In: Izumo T, Sasada S, Aso T, Nasu K, Arai Y, editors. Respiratory endos- copy. Singapore: Springer; 2015. p. 109-24.

14. Cordier JF. Cryptogenic organising pneumonia. Eur Respir J 2006;28:422-46.

15. Aparicio IJ, Lee JS. Connective tissue disease-associated in- terstitial lung diseases: unresolved issues. Semin Respir Crit Care Med 2016;37:468-76.

16. Ernst A, Eberhardt R, Wahidi M, Becker HD, Herth FJ. Effect of routine clopidogrel use on bleeding complications after transbronchial biopsy in humans. Chest 2006;129:734-7.

17. Pajares V, Puzo C, Castillo D, Lerma E, Montero MA, Ramos- Barbon D, et al. Diagnostic yield of transbronchial cryobiopsy in interstitial lung disease: a randomized trial. Respirology 2014;19:900-6.

18. Ryu JH, Olson EJ, Midthun DE, Swensen SJ. Diagnostic ap- proach to the patient with diffuse lung disease. Mayo Clin Proc 2002;77:1221-7.

19. Descombes E, Gardiol D, Leuenberger P. Transbronchial lung biopsy: an analysis of 530 cases with reference to the number

of samples. Monaldi Arch Chest Dis 1997;52:324-9.

20. Schumann C, Hetzel J, Babiak AJ, Merk T, Wibmer T, Moller P, et al. Cryoprobe biopsy increases the diagnostic yield in endobronchial tumor lesions. J Thorac Cardiovasc Surg 2010;140:417-21.

21. Loube DI, Johnson JE, Wiener D, Anders GT, Blanton HM, Hayes JA. The effect of forceps size on the adequacy of speci- mens obtained by transbronchial biopsy. Am Rev Respir Dis 1993;148:1411-3.

22. Herf SM, Suratt PM. Complications of transbronchial lung biopsies. Chest 1978;73(5 Suppl):759-60.

23. Pereira W Jr, Kovnat DM, Snider GL. A prospective coopera- tive study of complications following flexible fiberoptic bron- choscopy. Chest 1978;73:813-6.

24. O’Brien JD, Ettinger NA, Shevlin D, Kollef MH. Safety and yield of transbronchial biopsy in mechanically ventilated pa- tients. Crit Care Med 1997;25:440-6.

25. Paone G, Nicastri E, Lucantoni G, Dello Iacono R, Battistoni P, D’Angeli AL, et al. Endobronchial ultrasound-driven biopsy in the diagnosis of peripheral lung lesions. Chest 2005;128:3551- 7.

26. Chung YH, Lie CH, Chao TY, Wang YH, Lin AS, Wang JL, et al.

Endobronchial ultrasonography with distance for peripheral pulmonary lesions. Respir Med 2007;101:738-45.

27. Asano F, Matsuno Y, Tsuzuku A, Anzai M, Shinagawa N, Yamazaki K, et al. Diagnosis of peripheral pulmonary lesions using a bronchoscope insertion guidance system combined with endobronchial ultrasonography with a guide sheath.

Lung Cancer 2008;60:366-73.

28. Herth FJ, Eberhardt R, Becker HD, Ernst A. Endobronchial ultrasound-guided transbronchial lung biopsy in fluoroscopi- cally invisible solitary pulmonary nodules: a prospective trial.

Chest 2006;129:147-50.

29. Kurimoto N, Miyazawa T, Okimasa S, Maeda A, Oiwa H, Mi- yazu Y, et al. Endobronchial ultrasonography using a guide sheath increases the ability to diagnose peripheral pulmo- nary lesions endoscopically. Chest 2004;126:959-65.

30. Dooms CA, Verbeken EK, Becker HD, Demedts MG, Vansteenkiste JF. Endobronchial ultrasonography in broncho- scopic occult pulmonary lesions. J Thorac Oncol 2007;2:121-4.

31. Eberhardt R, Anantham D, Ernst A, Feller-Kopman D, Herth F. Multimodality bronchoscopic diagnosis of peripheral lung lesions: a randomized controlled trial. Am J Respir Crit Care Med 2007;176:36-41.

32. Casoni GL, Tomassetti S, Cavazza A, Colby TV, Dubini A, Ryu JH, et al. Transbronchial lung cryobiopsy in the diagnosis of fibrotic interstitial lung diseases. PLoS One 2014;9:e86716.

33. Hetzel J, Maldonado F, Ravaglia C, Wells AU, Colby TV, To-

massetti S, et al. Transbronchial cryobiopsies for the diagno-

sis of diffuse parenchymal lung diseases: expert statement

from the Cryobiopsy Working Group on Safety and Utility

and a Call for Standardization of the Procedure. Respiration

2018;95:188-200.

수치

Figure 1. Consolidation. Case 1 was that of a 74-year-old man with dyspnea. (A) Chest computed tomography (CT) showing lobar consolida- consolida-tion with air bronchogram in the right upper lobe
Figure 2. Ground-glass opacity (GGO). Case 3 was that of an 82-year-old man with dyspnea
Table 1. Baseline characteristics of the patients
Table 2. Comparison of the TBLB-related outcomes
+2

참조

관련 문서

Respiratory acidosis and metabolic alkalosis : chronic lung disease and diuretics 5.. Mixed acute and chronic respiratory acidosis : chronic lung disease

a prospective analysis of 50 cases. Preoperative staging of non-small-cell lung cancer with positron-emission tomography. Staging of non- small-cell lung cancer

1) Global Initiative for Chronic Obstructive Lung Disease (GOLD). Global strategy for the diagnosis, management and prevention of COPD. Yates, B.S., Jørgen Vestbo, M.D.,

Patients with breast cancer; ovarian cancer; renal cell carcinoma; pancreatic neuroendocrine cancer; colorectal cancer; head and neck cancer; non-small cell lung

Beichel,“Automated 3-D segmentation of lungs with lung cancer in CT data using a novel robust active shape model approach,” IEEE Trans.. 저작물의

Anti‑cyclic citrullinated peptide antibody testing is used to diagnose rheumatoid arthritis and associated with interstitial lung disease in RA.. Herein, we

Among the various pulmonary manifestations, interstitial lung disease (ILD) is known to be associated with substantial morbidity and mortality rates in RA patients.. As RA-ILD

Overall survival in elderly extensive-stage small cell lung cancer patients received no less than four cycles of the first-line chemotherapy according to