http://dx.doi.org/10.7779/JKSNT.2012.32.4.355
Nonlinear Time Reversal Focusing and Detection of Fatigue Crack
Hyunjo Jeong*
✝and Dan Barnard**
Abstract This paper presents an experimental study on the detection and location of nonlinear scattering source due to the presence of fatigue crack in a laboratory specimen. The proposed technique is based on a combination of nonlinear elastic wave spectroscopy(NEWS) and time reversal(TR) focusing approach. In order to focus on the nonlinear scattering position due to the fatigue crack, we employed only one transmitting transducer and one receiving transducer, taking advantage of long duration of reception signal that includes multiple linear scattering such as mode conversion and boundary reflections. NEWS technique was then used as a pre-treatment of TR for spatial focusing of reemitted second harmonic signal. The robustness of this approach was demonstrated on a cracked specimen and the nonlinear TR focusing behavior is observed on the crack interface from which the second harmonic signal was originated.
Keywords: Fatigue Crack, Nonlinear Scatterer, Nonlinear Elastic Wave Spectroscopy(NEWS), Time Reversal(TR), Harmonic Generation, Crack Localization
[Original paper]
Journal of the Korean Society for Nondestructive Testing Vol. 32, No. 4 (2012. 8)
[Received: June 29, 2012, Revised: July 27, 2012, Accepted: July 31, 2012] *Division of Mechanical and Automotive Engineering, Wonkwang University, Iksan 570-749, Korea, **Center for Nondestructive Evaluation, Ames, IA 50010, USA ✝ Corresponding Author: [email protected]
1. Introduction
One of the important roles of ultrasonic nondestructive evaluation (NDE) is to detect and characterize crack-like flaws in critical com- ponents and structures. Both linear and nonlinear ultrasonic techniques can be applied for these purposes. When cracks are open, linear methods based on the time-of-flight diffraction (TOFD) or a pulse-echo reflection can be a useful tool.
However, when cracks are closed or partially closed, it will be more challenging to detect them because the diffracted or reflected signal is too weak. An alternative technique to overcome this limitation is nonlinear ultrasonics. Ultrasonic nonlinearity is manifested as harmonic genera- tions (sub or super) in the power spectrum of the received signal when an intense ultrasonic wave is incident into imperfect interfaces. This effect is known as the contact acoustic
nonlinearity (CAN), and it has been the topic of much research work concerning the character- ization of closed cracks or imperfect bond interfaces [1]. Earlier theoretical investiga- tions [2-4] predicted that a weak or incompletely bonded interface will generate high second harmonics when subjected to sufficiently intense acoustic energy, and previous experiments have indicated that acoustic harmonic generation occurs on various types of interface, such as unbounded interfaces [5] microstructural changes [6-9], cracks [10-12] and adhesive joints [13,14].
In more recent years, nonlinear elastic wave
spectroscopy (NEWS) methods have been intro-
duced to assess nonlinear elastic effects of
damaged materials [15-18]. NEWS is a set of
techniques to determine the existence and degree
of nonlinearity in elastic systems. Nonlinear
elastic waves can be generated in a material
from a variety of reasons. They can be
distributed throughout the material or be highly localized. In this work, we are more concerned with detection and location of localized non- linear elastic features such as cracks.
In the last few years, NEWS methods have been combined with focusing techniques of time reversal acoustics (TRA) in order to enhance the detection and localization capabilities of NEWS [19,20]. As in the linear case, the nonlinear TRA is based on the principle of time reversal invariance and spatial reciprocity of the wave equation in a lossless medium, and it is usually composed of two steps. In the forward propa- gation step, the cracks must be stimulated with an external excitation in order to actively generate the nonlinear frequencies, thus becoming an active nonlinear source. The elastic waves scattering from the nonlinear source are recorded by a set of transducers [time reversal mirror (TRM)]. The nonlinear frequency com- ponents are then extracted from the signals acquired by the TRM elements. In the backward propagation step, the nonlinear waveform extracted from each TRM sensor is time reversed and reemitted into the medium in order to be focused back onto their original nonlinear source, the crack. Therefore, measuring this focused signal around the nonlinear scattering source (for instance, crack) will highlight the presence of crack.
TRM of finite bandwidth and aperture can limit the focusing quality. Nevertheless, it was demonstrated that the presence of a reverberant wave field (multiple scattering, mode conversion, and boundary reflections) enhances the spatial focusing of the reemitted signals. The effect is to create a virtual enlargement of the transducers angular aperture, thus to permit the reduction of the number of sensors needed to backpropagate the acquired waveforms, even to only one single element [21-24].
In this paper, a compact tension specimen with fatigue crack is used to apply the proposed
NEWS TR technique. The harmonic generation measurement is first conducted in a through transmission mode using a 10 MHz transmitter and a 20 MHz receiver. A high power amplifier is employed to generate harmonics from the crack interface. The second harmonic signal of 2f=20 MHz is filtered out of the received signal for long duration, time reversed and reemitted from the 20 MHz receiving transducer. Another 20 MHz contact transducer was used to measure the point-by-point surface displacement during the reemission process. The nonlinear TR focusing behavior is observed on the crack interface from which the second harmonic signal is originated.
2. Experiments
2.1 Harmonic Generation
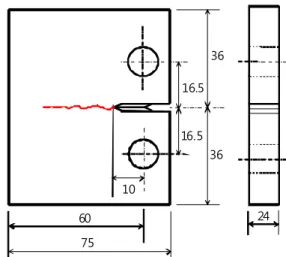
A compact tension (CT) specimen of Al 6061-T6 is used in this work. This cracked specimen was fabricated by applying a high cycle fatigue loading on a chevron notch. Fig. 1 shows the schematic configuration of the cracked CT specimen. The crack length was measured to be about 40 mm from the notch center.
60 24 75
36
36 16.5 16.5
10
Fig. 1 Configuration of CT specimen with fatigue
crack (unit: mm)
Current probe Oscilloscope
20 MHz Rx GPIB
Computer RPR 4000
amplifier Stepped
attenuator 10 MHz low pass filter 50 Ohm
load
10 MHz Tx
Fig. 2 Schematic diagram for harmonic generation measurement
Harmonic generation measurements are made in the through transmission mode as shown in Fig. 2. Fig. 2 shows a schematic representation of the harmonic generation measurement. The transmitting transducer is coupled to the sample for the transmission measurement. A mono- chromatic toneburst at the fundamental frequency is injected into the sample, propagates through the cracked interface of the sample and is received by the receiving transducer.
Fig. 2 also shows an equipment block diagram of the harmonic generation measurement system.
A high power amplifier (RITEC RPR 4000) tuned to the fundamental frequency (10 MHz for these measurements) provides the high power monochromatic toneburst for the harmonic generation. The two transducers are made of LiNbO3 wafers (longitudinal polarization) and coupled to the sample with a light oil. The size of the transducer is 12.7 mm in diameter. The transmitter has a center frequency of 10 MHz, while the receiver has a broad bandwidth with a center frequency of 20 MHz. (Both transducers are the product of CTS Valpey Corporation, Hopkinton, MA, USA). The two transducers are aligned with each other by being placed in a test fixture that can provide a constant pressure during the entire measurement.
The received signals with two different record lengths are shown in Fig. 3 together with their corresponding Fourier spectra. The input signal used is the monochromatic toneburst of the center frequency f = 10 MHz. The received signal in Fig. 3(a1) was recorded up to 19 μs, while the received signal in Fig. 3(b1) was recorded up to 34 μs. In addition to the fundamental component at f = 10 MHz, both the second harmonic and the third harmonic components are clearly seen at 2f = 20 MHz and 3f = 30 MHz. The longer is the record length, the higher are the magnitudes of harmonic components. It is also known that the longer is the record length, the better is the TR focusing effect. However, there was a limitation in record length because of the memory size of the oscilloscope used. We will use the longer received signal in the time reversal process of the second harmonic component and reemission.
1.4 1.5 1.6 1.7 1.8 1.9
x 10-5 -1.5
-1 -0.5 0 0.5 1 1.5
Time (s)
Amplitude (V)
(a1)
0 1 2 3 4 5
x 107 0
0.5 1 1.5
2x 10⁻⁸
Frequency (Hz)
Magnitude Spectrum of
2ndharmonics Spectrum of 3rdharmonics Spectrum of fundamental frequency
(a2) (a) Received signal from the through transmission
measurement and its Fourier spectrum (record length = 19 μs)
1.5 2 2.5 3
x 10-5 -1.5
-1 -0.5 0 0.5 1 1.5
Time (s)
Amplitude (V)
(b1)
0 1 2 3 4 5
x 107 0
0.5 1 1.5
2x 10⁻⁸
Frequency (Hz)
Magnitude
Spectrum of fundamental frequency
Spectrum of 2ndharmonics
Spectrum of 3rdharmonics Spectrum of 4thharmonics
(b2) (b) Received signal from the through transmission
measurement and its Fourier spectrum (record length = 34 μs)
Fig. 3 Received signals and their Fourier spectra
for two different record lengths
Function
generator 50 Ohm
load Stepped
attenuator ENI 2100L
amplifier
20 MHz Tx Current
probe Oscilloscope
GPIB Computer
Preamp Receiver 20 MHz/0.25 in
Fig. 6 Schematic diagram for time reversal and reemission of the 2nd harmonic signal
20 MHz transducer (0.5” dia) v1 v2
v3
v4 v5 h1 h2 h3 h4
h5
20 MHz transducer (0.25” dia)
Fig. 7 Schematic illustration for measuring the surface displacement during the reemission process
2.2 Time Reversal and Remission of Second Harmonic Signal
To extract the 2
ndharmonic component (2f = 20 MHz), a Hanning window of Fig. 4 was designed and multiplied on the Fourier spectrum of the received signal [Fig. 3(b2)]. The second harmonic signal in time domain, shown in Fig.
5(a), was then found from the inverse Fourier transform of the second harmonic spectrum. The extracted second harmonic signal was time- reversed and normalized as shown in Fig. 5(b) to be fed into the arbitrary waveform generator and then to be amplified by the ENI 2100L linear amplifier before it was used as an input source to excite the 20 MHz transducer used as the receiver in the harmonic generation measurement.
0 1 2 3 4 5
x 107 0
0.2 0.4 0.6 0.8 1
Frequency (Hz)
Magnitude
Fig. 4 A hanning window used to filter the 2nd harmonic components of 2f =20 MHz
1.5 2 2.5 3
x 10-5 -6
-4 -2 0 2 4 6x 10⁻³
Time (s)
Amplitude (V)
1.5 2 2.5 3
x 10-5 -1
-0.5 0 0.5 1
Time (s)
Normalized mplitude (V)