Radiation exposure has a greater potential risk in a pe- diatric CT than an adult CT because children have greater radio-sensitivity and a longer life expectancy (1).
Thus, particular emphasis has been posed on the reduc- tion of radiation dose for pediatric CT (2) by means of various strategies as follow (3-9). Adaptation of the tube current corresponding to the patient age (3) or body weight (4) is central to dose-saving for the CT protocol.
Moreover, the use of low tube potential and tube cur- rent modulation has recently been recommended for further optimization of CT dose (5-9).
To optimize a CT protocol, a radiologist should bal- ance dose reduction and image quality because adjust-
Pediatric 16-slice CT Protocols:
Radiation Dose and Image Quality
1Dong Hyun Yang, M.D., Hyun Woo Goo, M.D.
1Department of Radiology and Research Institute of Radiology, Asan Medical Center, University of Ulsan College of Medicine, Korea.
Received June 30, 2008 ; Accepted September 1, 2008
Address reprint requests to : Hyun Woo Goo, M.D., Department of Radiology and Research Institute of Radiology, Asan Medical Center, University of Ulsan College of Medicine, 388-1 Poongnap-2 dong, Songpa-gu, Seoul 138-736, Korea
Tel. 82-2-3010-4388 Fax. 82-2-476-4719 E-mail: hwgoo@amc.seoul.kr
Purpose: To assess radiation dose and image quality of our pediatric 16-slice CT protocols and to compare them with published standards.
Materials and Methods: For 540 weight-based pediatric 16-slice CT examinations in six anatomic regions, CTDIvol, DLP, effective dose, and image noise were determined.
Two radiologists evaluated the visual quality of CT images by consensus. We analyzed the relationship of CTDIvol and image noise with body diameter. Our results were compared with published data.
Results: The average CTDIvol(mGy), DLP (mGy・cm), effective dose (mSv), and im- age noise (HU) were as follows: 4.1/125.5/1.6/16.2 for chest CT, 3.3/54.2/1.2/13.7 for heart CT, 5.8/256.6/3.8/13.0 for abdomen-pelvis CT, 6.8/318.7/5.9/12.0 for dynamic ab- domen CT, 3.5/86.2/0.35/7.9 for neck CT and 25.4/368.0/1.6/3.7 for brain CT, respec- tively. All CT images were diagnostic upon visual analysis. The CTDIvoland image noise were proportional to body diameter. Our dose parameters were comparable to the first quartile of the cited German survey, whereas image noise in our study was similar to published data.
Conclusion: Our pediatric CT dose is at the lower end of published standards and our image noise can be used as a target noise for each protocol in developing better pedi- atric multi-slice CT protocols.
Index words : Child
Tomography, X-Ray Computed Quality assurance, health care Radiation dosage
ing each parameter represents a trade-off. Thus, one should be familiar with the parameters of radiation dose and image quality and their relationships. Although re- cent dose surveys have described current dose levels in pediatric CT imaging, no evaluations of image quality parameters, (e.g. image noise) have been made (10, 11).
For pediatric CT imaging, only a small number of phan- tom studies have simultaneously considered radiation dose and image quality (2, 12, 13). Since 2000, we have developed our own pediatric low-dose CT protocol to which a combination of body weight-based tube current adaptation, low tube potential, and tube current modu- lation were applied (6, 13). We carried out the present study to assess radiation dose and image quality of our pediatric multi-slice CT protocols and to compare them with published standards.
Materials and Methods
Our Institutional Review Board approved this retro- spective study and informed consent was waived.
Study group
During the six months from July 2006 to December 2006, 1142 pediatric CT examinations were performed using eight CT scanners following the low-dose protocol at our department. The majority of scans (n = 619, 54%) were performed with two 16-slice CT scanners (Somatom Sensation 16 with version VB10B; Siemens, Forchheim, Germany; gantry rotation time of 0.375 s).
The other six CT scanners included: a single-slice CT (n
= 1, HiSpeed; General Electric, Milwaukee, U.S.A.), four-slice CT (n = 2, LightSpeed; General Electric), 16- slice CT (n = 1, LightSpeed 16; General Electric), 16-slice CT (n = 1, Somatom Sensation 16; Siemens; gantry rota- tion time of 0.5 s), and a dual source CT (n = 1, Somatom Definition; Siemens). Among them, 64 CT examinations,
including upper abdomen CT images, high-resolution chest CT images, unenhanced body CT images and elec- trocardiography (ECG)-synchronized heart CT images were excluded because the number of examinations was too small to be analyzed. Thus, the six examination pro- tocols included in our study included chest, non-ECG- synchronized heart, abdomen-pelvis, dynamic abdomen, neck, and brain CT images (Table 1). Further, 15 exami- nations in which the dose report (CTDIvoland DLP) was not available were excluded from the study. Finally, a to- tal of 540 CT examinations from 319 children (198 boys, 121 girls; mean age, 5.8 years; range, 1 day-15 years) were enrolled in our study. The reasons for the CT exam- ination included: malignancies (n = 280), congenital anomalies (n = 124), infections (n = 59), inflammatory diseases other than infections (n = 34), benign tumors (n
= 17) and others (n = 26).
CT imaging
In our CT protocol, tube current and tube potential were adjusted for six body-weight groups (Table 1). All CT examinations other than brain CT imaging were per- formed with a spiral scan, followed by the application of tube current modulation (CARE Dose 4D; Siemens, Forchheim, Germany). For brain CT imaging, axial scans were used with a gantry rotation time of 1.0 sec- ond to avoid image blurring and artifacts related to mul- ti-slice spiral scans. A gantry rotation time of 0.375 sec- onds was chosen for all spiral scans to minimize motion artifacts. Beam collimation, reconstruction section thick- ness, reconstruction kernel, and scan range are summa- rized in Table 2. In all spiral scans, a beam pitch of 1.0 was used. In addition, iodinated contrast agent (Iomeron 300 or 400; Bracco Imaging SpA, Milan, Italy) was ad- ministered intravenously (1.2-1.5 mL/kg), followed by a saline flush using a dual power injector (Optivantage DH, Tyco Health/Mallinckrodt, St Louis, U.S.A.). For
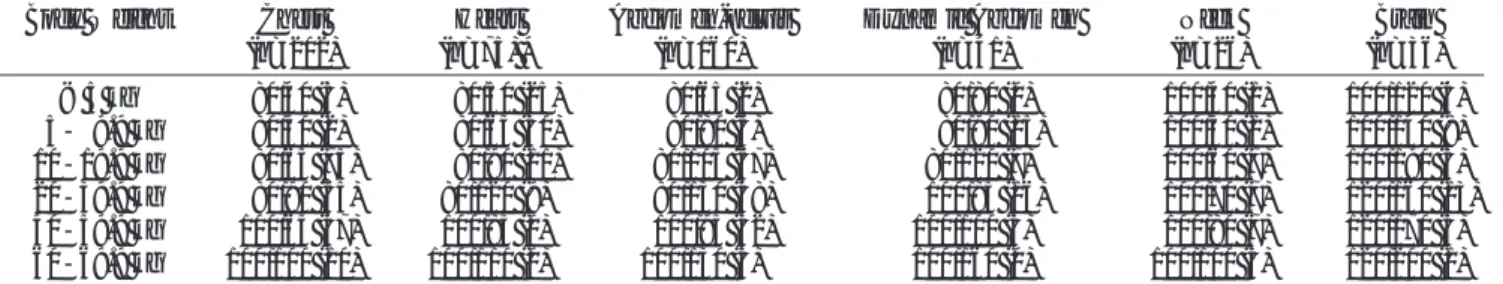
Table 1. Adapted Values of Tube Potential and Tube Current for Six Body Weight Groups and Six Anatomic Regions
Body Weight Chest Heart Abdomen-pelvis Dynamic Abdomen Neck Brain
(n=202) (n=75) * (n=160) (n=41) (n=26) (n=36)
< 5 kg 080/40 (3) 00080/50 (25) 0080/65 (2) 0080/80 (0) 0100/40 (1) 100/120 (4) 05-09.9 kg 080/50 (2) 00080/65 (30) 0080/80 (6) 00080/90 (15) 0100/50 (1) 100/140 (8) 10-19.9 kg 0080/65 (75) 00080/90 (11) 0080/105 (67) 080/120 (7) 0100/60 (7) 100/190 (5) 20-39.9 kg 0080/90 (65) 080/120 (9) 0080/130 (48) 00100/85 (16) 0100/70 (7) 0120/160 (13) 40-59.9 kg 0100/65 (47) 0100/85 (0) 00100/95 (32) 100/100 (3) 0100/80 (7) 120/170 (5) 60-69.9 kg 100/100 (10) 100/110 (0) 100/130 (5) 100/160 (0) 100/100 (3) 120/200 (1) Note - Data are presented as tube potential (kV) / effective tube current-time product (mAs).
* Heart CT was performed without electrocardiography gating.
The numbers in parentheses indicate the number of examinations.
heart and dynamic abdomen CT images in which vascu- lar opacification is of paramount importance, iodinated contrast agent containing 400 mg I/mL (Iomeron 400) was used, whereas iodinated contrast agent containing 300 mg I/mL (Iomeron 300) was used for all other CT ex- aminations. An injection rate ranging from 0.3 to 3.0 mL/sec was determined according to the gauge (24-18) of the peripheral venous catheter. Further, a scan delay time was determined using a bolus tracking method in chest CT, heart CT, and the arterial phase of dynamic abdomen CT. A fixed delay time was employed in ab- domen-pelvis CT (50 - 65 sec), the portal venous phase of dynamic abdomen CT (50 - 65 sec) and neck CT (40 - 60 sec). Conforming to the “As Low As Reasonably Achievable (ALARA)” principle, an unenhanced CT was not performed other than for a brain CT (unenhanced scan only, n = 22; unenhanced and enhanced scans, n
= 14).
Non-ECG-synchronized heart CT imaging was per- formed to assess the anatomy of the heart and thoracic great vessels in patients with congenital heart disease.
Dynamic CT imaging of the abdomen, which consists of arterial and portal venous phases, was performed to as- sess hepatic vessels for liver transplantation or enhance- ment patterns of focal hepatic lesions. In the two exami- nation protocols requiring multiplanar and three-dimen- sional reformations, a thinner collimation with a rela- tively greater radiation dose was used, compared to chest and abdomen-pelvis CT images requiring only axi- al images (Tables 1, 2).
Radiation dose parameters
A volume CT dose index (CTDIvol; mGy), dose length product (DLP; mGy・cm), and effective dose (mSv) were described in our study as the three important radi- ation dose parameters. CTDIvoland DLP were automati- cally generated and saved as a dose report after each CT examination. The dosimetric measurement of these pa- rameters was not performed. The CTDIvolis a phantom- based dose parameter and is based on the unit volume.
In a Sensation 16 CT, the phantom size used to calculate CTDIvolis predetermined by a specific scan mode (e.g., 16-cm phantom for head mode, 32-cm phantom for body mode) irrespective of patient size. In pediatric CT imaging, even in body scan mode, 16-cm phantom- based dose parameters have been commonly used be- cause these values provide more realistic estimates of ra- diation dose for children than 32-cm phantom-based dose parameters (10, 11). Moreover, the effective dose in pediatric CT images has been estimated from 16-cm phantom-based values (10, 11). In a Sensation 16 CT scanner, the radiation dose based on a 16-cm phantom is known to be approximately two times higher than the value based on a 32-cm phantom (15); consequently, we converted 32-cm phantom-based dose parameters for the CT protocols (chest, heart, abdomen-pelvis, and dy- namic abdomen) performed in body scan mode to 16- cm phantom-based ones by multiplying the 32-cm dose parameters by a factor of two.
In order to determine the effective dose, we applied a formula which had been used in a German pediatric CT
Table 2. CT Imaging Parameters and Scan Ranges in CT Examination Protocols
Chest Heart Abdomen-pelvis Dynamic Abdomen * Neck Brain
Beam Collimation (mm) 1.5×16 0.75 or 1.5×16 1.5×16 0.75 or 1.5×16 0.75×16 1.5×12 Reconstructed Section
Thickness (mm) 3-5 2-4 3-5 3-5 2-3 4.5
Reconstruction Kernel B30f B20f or B30f B30f B30f H30f H40s
Scan Range Upper Limit Lung apex Top of aortic arch ‡ Liver dome Liver dome Orbit floor Vertex Lower Limit left kidney Cardiac Symphysis Inferior liver Sternoclavicular Skull base
hilum apex ‡ pubis angle (arterial) junction
left kidney Iliac crest
upper pole † (venous)
Note ─ Beam collimation is expressed as the effective detector-row width multiplied by the number of data channels. Beam pitch (table feed per gantry revolution / beam collimation) was 1.0 for a chest, heart, abdomen-pelvis, dynamic abdomen, and neck CT.
* For a dynamic abdomen CT, enhanced scanning was performed in the arterial and portal venous phases: unenhanced scans were not obtained.
†When a chest CT and abdomen-pelvis CT were performed at the same time (n = 90), the lower scan range of the chest CT was adjusted to minimally overlap the upper range of the abdomen-pelvis CT.
‡A pediatric radiologist (G. H. W.) checked all parameters, including the scan range of all heart CT examinations, depending on the pur- pose of the examination and the category of cardiac defects.
** B30f = medium smooth kernel in body mode, B20f = smooth kernel in body mode, H30f = medium smooth kernel in head mode, H40s = medium kernel in head mode.
dose survey (10):
where E (mSv) is the effective dose, Pf refers to the phantom factor, Cf (mSv/mGy・cm) is the effective dose normalized to the DLP (mGy・cm), sC is the scan- ner correction factor in head mode (sChead) or body mode (sCbody), aC is the patient age correction factor, and x is a factor required for scanner correction in chil- dren (Appendix). The age correction factor was applied to five age groups (newborn [up to 1 month], up to 1 year, 2-5 years, 6-10 years, and 11-15 years).
Consistent with the aforementioned German survey,
the 11-15 year age group, a 32-cm phantom-based val- ue of DLP (DLP32 cm) was used to estimate the effective dose of body CT images, while a 16-cm phantom-based value (DLP32 cm×2 in our study) was used in other age groups. The commonly used software ImPACT CT dosimetry spreadsheet (16) was not employed for effec- tive dose calculation in our study because a pediatric mathematical phantom was not available in the soft- ware program.
Image quality
Image noise (HU), the standard deviation of the CT density, was measured in two organs and in background air for each protocol by placing a rectangular region of interest (ROI) (Table 3). The ROI measurement was per-
E = ×Cf×sC×aC×
sChead x
sCbody DLP
Pf
A B
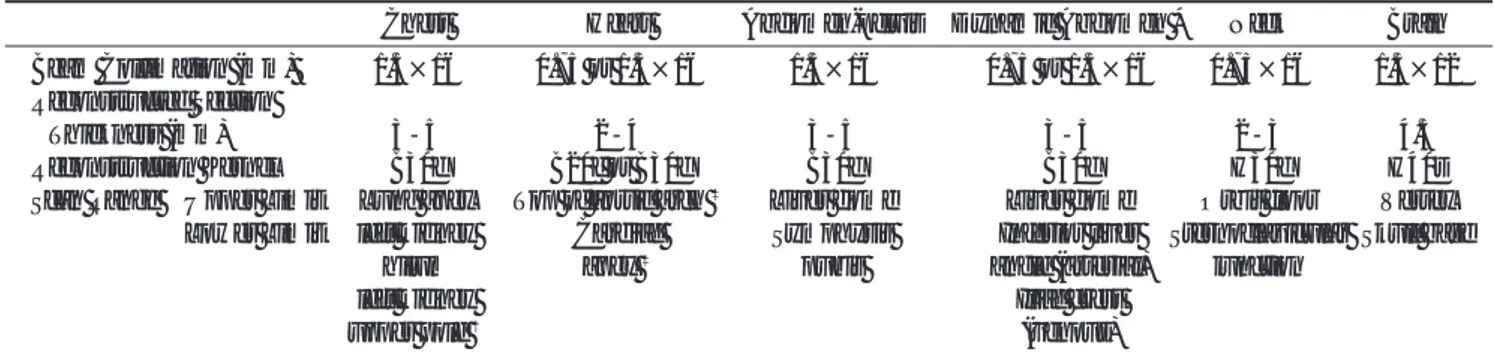
Fig. 1. Locations of the rectangular regions of interest for image noise measurement of the chest or heart CT images. Three sets of CT images with different window/width levels (HU) were merged (950/220 for the thoracic aorta, 300/50 for the paraspinal muscle, and 1500/-700 for the background air). The image noise was measured at the predefined three levels (i.e., carina (A), aortic valve (B), and cardiac apex (C). In this examination, the mean measured image noise (HU) was 17.6 for the thoracic aorta, 9.6 for the paraspinal muscle, and 7.1 for the background air.
C
formed at three predefined levels (Table 3) by a board- certified radiologist with three-years of experience using our PACS workstation. Following the measurement, the three measured values were averaged (Fig. 1). Because the target organs are diverse in size in the pediatric CT, the ROI was drawn as large as possible within a ho- mogenous area of each organ (for organs, ROI up to 100 mm2; for background air, ROI fixed at 100 mm2). To minimize the potential influence of window settings, image noise was measured under a fixed window set- ting (width/level) for each organ and for background air:
vessel (950/220), liver and muscle (300/50), background air (1500/-700) and brain (100/30) (Fig. 1). The measure- ment of image noise was performed at the portal venous phase for dynamic abdomen CT imaging and the unen- hanced scan for brain CT imaging.
The visual quality of the CT images was evaluated by two board-certified radiologists (11-years of experience
and three-years of experience, respectively) for image noise, beam hardening or motion artifacts, and enhance- ment of target organs. The overall image quality was then graded by consensus using a four-point scale (1 non-diagnostic images, 2 suboptimal but acceptable quality images, 3 good quality images, 4 excellent im- ages) (Fig. 2). The CT images showing grade 2 or more were regarded as diagnostic.
Body diameter
Body diameters were measured on all CT examina- tions at a predetermined level for each anatomic region.
The anterior-to-posterior and transverse diameters were measured on a PACS workstation by an experienced ra- diologist. The mean value represented the body diame- ter of a patient for that CT protocol. The measurement levels for each CT protocol included: the four cardiac chambers for chest and heart CT images, celiac axis for
A B
C
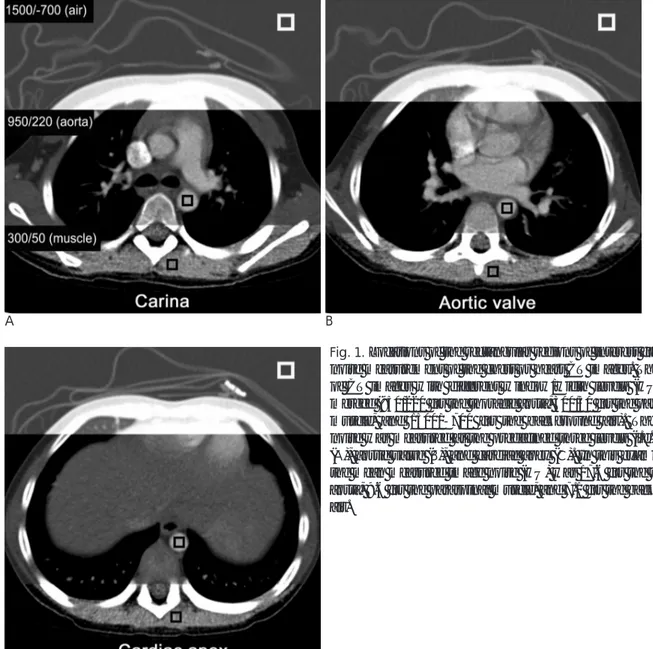
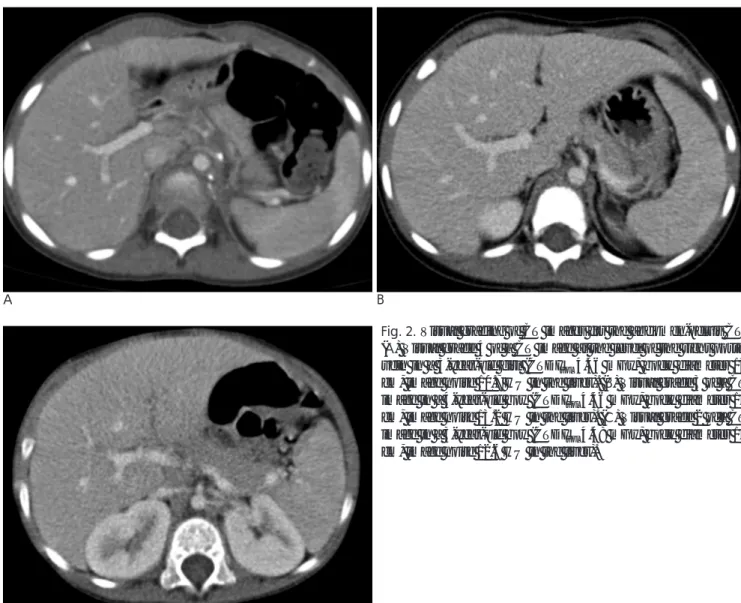
Fig. 2. Visual grading of CT images for the abdomen-pelvis CT.
(A) Visual grade 4 of a CT image at the level of the right portal vein in a 3-year-old girl (CTDIvol4.46 mGy, body diameter 15 cm, image noise 10.7 HU in the liver). (B) Visual grade 3 of a CT image in a 4-year-old boy (CTDIvol4.46 mGy, body diameter 17 cm, image noise 13.2 HU in the liver). (C) Visual grade 2 of a CT image in a 3-year-old boy (CTDIvol4.48 mGy, body diameter 17 cm, image noise 12.6 HU in the liver).
abdomen-pelvis and dynamic abdomen CT images, mandibular angle for neck CT, and the center of the thalamus for the brain CT images.
Data analysis and comparison with previously published data
Radiation dose and image noise were summarized for each protocol and for each body-weight group. All para- meters were expressed as the mean ± standard devia-
tion. We correlated the measured body diameter with CTDIvoland image noise using a linear regression analy- sis. The statistical analyses were performed using a sta- tistical software package (MedCalc 7.4; MedCalc Software, Mariakerke, Belgium). A p-value of 0.05 was considered to indicate a statistically significant differ- ence.
Our radiation dose parameters were compared with two recent German and UK CT dose surveys for each
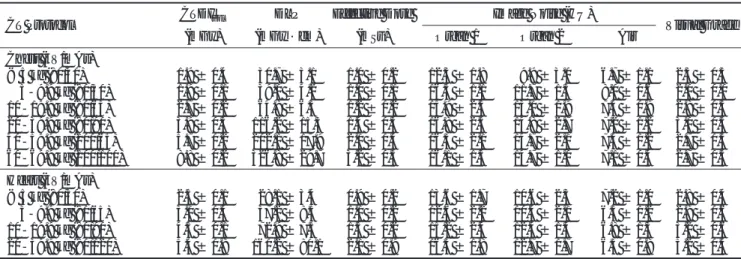
Table 5A. Summary of Radiation Dose Parameters, Image Noise, and Visual Grades for Chest CT images and Heart CT images as a func- tion of Body-weight Group
CT Protocol CTDIvol DLP Effective Dose Image Noise (HU)
Visual Grade
(mGy) (mGy・cm) (mSv) Organ 1 Organ 2 Air
Chest (kV/mAs)
< 5 kg (80/40) 1.9 ± 0.4 30.7 ± 3.1 1.0 ± 0.2 12.3 ± 1.8 09.9 ± 3.0 6.7 ± 1.1 2.3 ± 0.5 005-9.9 kg (80/50) 1.9 ± 0.1 39.0 ± 4.2 1.0 ± 0.1 16.3 ± 1.1 11.7 ± 1.3 8.0 ± 0.6 2.0 ± 0.0 10-19.9 kg (80/65) 2.7 ± 0.2 64.8 ± 6.3 1.2 ± 0.2 15.9 ± 2.5 13.0 ± 1.9 7.4 ± 0.9 2.8 ± 0.5 20-39.9 kg (80/90) 3.9 ± 0.3 116.2 ± 15.3 1.4 ± 0.3 16.8 ± 2.5 14.8 ± 2.7 7.2 ± 1.2 3.0 ± 0.5 40-59.9 kg (100/65) 5.7 ± 0.2 202.1 ± 17.9 2.0 ± 0.4 16.3 ± 2.1 14.7 ± 2.1 7.4 ± 1.2 2.7 ± 0.5 60-69.9 kg (100/100) 8.8 ± 0.2 326.8 ± 29.7 3.2 ± 0.5 16.1 ± 1.3 14.7 ± 1.0 7.1 ± 0.4 2.7 ± 0.5 Heart (kV/mAs)
< 5 kg (80/50) 2.5 ± 0.1 28.1 ± 3.4 0.9 ± 0.2 13.6 ± 1.7 10.6 ± 2.3 7.2 ± 1.0 2.8 ± 0.4 005-9.9 kg (80/65) 3.0 ± 0.4 37.2 ± 8.5 1.0 ± 0.2 12.6 ± 2.2 10.4 ± 2.1 6.5 ± 1.2 2.9 ± 0.6 10-19.9 kg (80/90) 4.5 ± 0.1 72.9 ± 7.5 1.5 ± 0.2 15.2 ± 2.4 12.4 ± 1.4 6.8 ± 1.3 3.2 ± 0.6 20-39.9 kg (80/120) 5.4 ± 0.8 160.2 ± 80.1 2.1 ± 0.9 16.3 ± 1.8 12.7 ± 1.7 6.3 ± 0.8 3.2 ± 0.4 Note ─ Data are expressed as the mean values ± standard deviation.
Table 3. Region of Interest Location for Each Scan Region
CT Protocol Organ 1 Organ 2 Level
Chest / Heart Thoracic aorta Paraspinal muscle Carina/ Aortic valve/ Cardiac apex (37.1 ± 22.0) (37.5 ± 22.1)
Abdomen-pelvis / Liver Paraspinal muscle Liver dome / Hilum/ Inferior angle
Dynamic Abdomen (95.1 ± 8.9) (78.0 ± 29.0)
Neck Internal jugular vein Sternocleidomastoid muscle Hyoid bone/ Vocal cord/ Thyroid
(20.1 ± 7.6) (20.1 ± 7.6) gland
Brain Gray matter Cerebrospinal fluid Cerebellum/ Thalamus/ Centrum
(51.8 ± 11.2) (16.5 ± 10.6) semiovale
Note ─ The numbers in parentheses indicate the size of the region of interest (mm2, mean ± standard deviation).
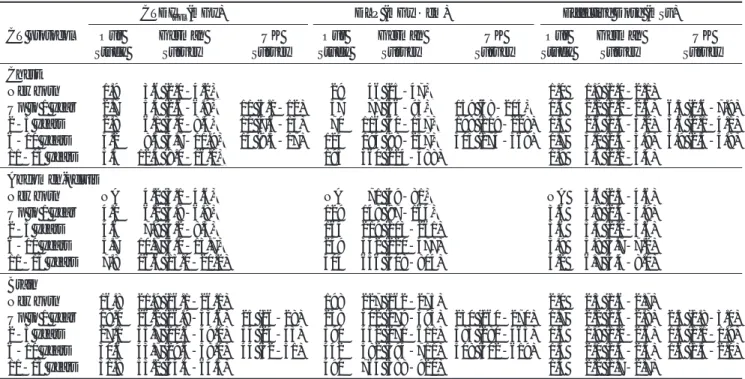
Table 4. Summary of Radiation Dose Parameters, Image Noise, and Visual Grades in Our CT Protocols
CT Protocol CTDIvol DLP Effective Dose Image Noise (HU)
Visual Grade
(mGy) (mGy・cm) (mSv) Organ 1 Organ 2 Air
Chest (n=202) 04.1 ± 1.6 125.5 ± 72.10 1.6 ± 0.6 16.2 ± 2.4 14.0 ± 2.4 7.3 ± 1.1 2.8 ± 0.5 Heart (n=75) 03.3 ± 1.1 054.2 ± 50.00 1.2 ± 0.5 13.7 ± 2.4 11.1 ± 2.2 6.7 ± 1.1 2.9 ± 0.5 Abdomen-pelvis (n=160) 05.8 ± 1.9 256.6 ± 131.8 3.8 ± 1.1 13.0 ± 1.8 12.1 ±1.7 6.7 ± 0.9 2.6 ± 0.6 Dynamic Abdomen (n=41)* 06.8 ± 1.9 318.7 ± 150.8 5.9 ± 1.8 12.0 ± 1.6 10.9 ± 1.6 6.5 ± 1.1 2.9 ± 0.5 Neck (n=26) 03.5 ± 0.8 86.2 ± 35.6 0.3 ± 0.1 07.9 ± 1.9 07.7 ± 1.6 4.1 ± 1.1 2.7 ± 0.5 Brain (n=36)† 25.4 ± 6.8 368.0 ± 129.8 1.6 ± 0.3 03.7 ± 0.5 03.7 ± 0.7 2.4 ± 0.5 2.7 ± 0.4 Note ─ Data are mean values ± standard deviation.
* DLP and effective dose for dynamic abdomen CT are the sum of those of the arterial and portal venous phases.
†DLP and effective dose for brain CT are those of the unenhanced CT scan. The radiation doses were equal for the unenhanced and en- hanced CT scans.
age group (10, 11). In addition to these surveys, the CTDIvol of our CT protocol was compared with previ- ously published CT protocols (4, 6, 13). We calculated the CTDIvol of the previous protocols based on their imaging parameters and CT models with the ImPACT program (16). In these pediatric CT protocols, imaging parameters were specific to either body-weight or age group. A known conversion table was used to convert body weight to patient age (13). Moreover, the image noises for the aorta, liver, muscle, and brain in our study were compared with corresponding data available in the literature (17-23).
Results
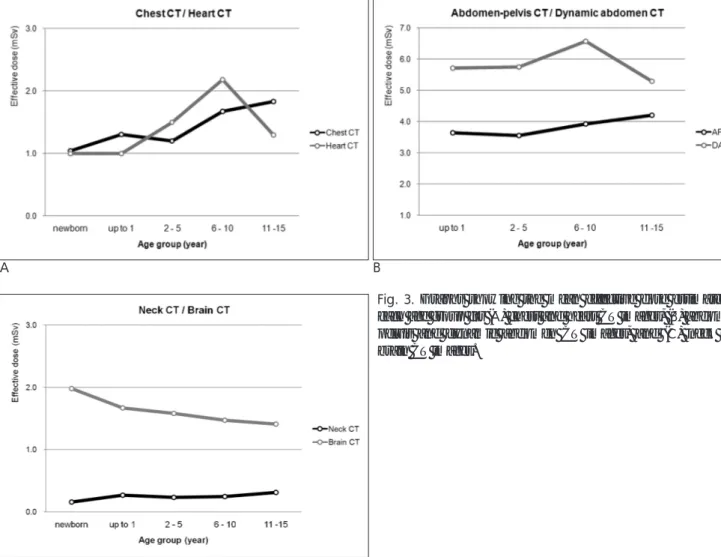
The radiation dose parameters, image noise, and visu- al image quality grades for each protocol and body- weight group are summarized in Tables 4 and 5. The ra- diation dose parameters revealed a tendency to be less in lighter-weight groups (Table 5) and in younger-age groups (Fig. 3), except for the effective dose for brain CT. Image noise showed a slight tendency to be less in lighter-weight groups, except for the neck CT. All CT images were of diagnostic quality and had mean scores
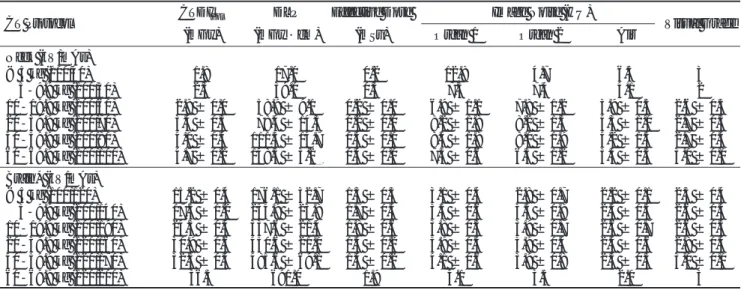
Table 5B. Summary of Radiation Dose Parameters, Image Noise, and Visual Grades for Abdomen-pelvis CT images and Dynamic Abdomen CT images as a function of Body-weight Group
CT Protocol CTDIvol DLP Effective Dose Image Noise (HU)
Visual Grade
(mGy) (mGy・cm) (mSv) Organ 1 Organ 2 Air
Abdomen-pelvis (kV/mAs)
< 5 kg (80/65) 02.6 ± 1.0 071.0 ± 29.7 2.3 ± 1.5 11.2 ± 2.2 11.6 ± 3.6 6.5 ± 1.3 2.5 ± 0.5 005-9.9 kg (80/80) 03.4 ± 0.2 101.3 ± 7.20 3.1 ± 0.5 11.3 ± 0.6 10.8 ± 1.2 6.2 ± 0.8 2.2 ± 0.4 10-19.9 kg (80/105) 04.5 ± 0.1 161.7 ± 13.3 3.5 ± 0.8 12.4 ± 1.4 11.3 ± 1.4 6.5 ± 0.9 2.7 ± 0.5 20-39.9 kg (80/130) 05.6 ± 0.4 252.4 ± 27.7 3.6 ± 0.9 13.7 ± 2.1 12.8 ± 1.6 6.8 ± 1.0 2.5 ± 0.6 40-59.9 kg (100/95) 08.4 ± 0.2 440.0 ± 23.2 4.6 ± 1.1 13.2 ± 1.7 12.6 ± 1.5 7.0 ± 0.9 2.5 ± 0.5 60-69.9 kg (100/130) 12.1 ± 0.8 654.8 ± 49.8 6.7 ± 0.9 13.9 ± 1.1 14.0 ± 1.7 7.1 ± 0.4 2.2 ± 0.7 Dynamic Abdomen (kV/mAs) *
005-9.9 kg (80/90) 4.8 ± 0.1 172.0 ± 25.6 5.5 ± 1.5 12.0 ± 1.7 10.0 ± 1.3 6.5 ± 1.2 2.8 ± 0.4 10-19.9 kg (80/120) 6.4 ± 4.0 0287.4 ± 165.2 5.6 ± 1.7 11.3 ± 1.4 11.1 ± 1.3 6.1 ± 0.6 2.9 ± 0.3 20-39.9 kg (100/85) 8.5 ± 0.1 426.3 ± 59.0 6.3 ± 2.1 12.2 ± 1.5 11.1 ± 1.3 6.5 ± 1.2 2.9 ± 0.6 40-59.9 kg (100/100) 9.3 ± 1.1 552.0 ± 59.0 6.4 ± 1.8 13.6 ± 1.6 13.7 ± 2.3 6.9 ± 0.8 2.7 ± 0.5 Note ─ Data are mean values ± standard deviation.
* DLP and effective dose of the dynamic abdomen CTs represent the sum of the arterial and portal venous phase CTs.
Table 5C. Summary of Radiation Dose Parameters, Image Noise, and Visual Grades for Neck CT images and Brain CT images as a func- tion of Body-weight Group
CT Protocol CTDIvol DLP Effective Dose Image Noise (HU)
Visual Grade
(mGy) (mGy・cm) (mSv) Organ 1 Organ 2 Air
Neck (kV/mAs)
< 5 kg (100/40) 1.8 17.0 0.2 12.8 4.7 6.5 3
005-9.9 kg (100/50) 2.3 39.0 0.3 7.3 7.4 4.1 2
10-19.9 kg (100/60) 2.8 ± 0.0 58.9 ± 9.1 0.2 ± 0.0 6.9 ± 1.1 7.8 ± 1.2 3.9 ± 0.5 2.6 ± 0.5 20-39.9 kg (100/70) 3.4 ± 0.3 078.4 ± 14.3 0.2 ± 0.0 8.2 ± 1.8 8.2 ± 1.5 4.3 ± 1.0 2.7 ± 0.5 40-59.9 kg (100/80) 4.1 ± 0.4 111.3 ± 14.7 0.3 ± 0.0 8.4 ± 1.8 8.0 ± 1.9 4.2 ± 1.5 2.7 ± 0.5 60-69.9 kg (100/100) 4.7 ± 0.2 148.3 ± 3.20 0.4 ± 0.0 7.3 ± 0.6 6.5 ± 1.2 3.4 ± 0.5 3.0 ± 0.0 Brain* (kV/mAs)
< 5 kg (100/120) 15.2 ± 0.4 176.1 ± 32.7 1.3 ± 0.3 3.1 ± 0.4 2.8 ± 0.7 2.2 ± 0.1 2.3 ± 0.4 005-9.9 kg (100/140) 17.5 ± 1.2 234.9 ± 23.8 1.7 ± 0.3 3.5 ± 0.6 3.5 ± 0.8 2.3 ± 0.3 2.6 ± 0.5 10-19.9 kg (100/190) 24.3 ± 0.4 337.6 ± 21.4 1.8 ± 0.6 3.8 ± 0.5 3.9 ± 0.7 2.6 ± 0.7 2.6 ± 0.5 20-39.9 kg (120/160) 30.9 ± 0.6 450.6 ± 21.0 1.5 ± 0.2 3.9 ± 0.3 3.9 ± 0.4 2.4 ± 0.6 2.8 ± 0.4 40-59.9 kg (120/170) 32.5 ± 0.4 485.6 ± 69.1 1.4 ± 0.2 4.1 ± 0.6 3.9 ± 0.8 2.3 ± 0.3 3.0 ± 0.0
60-69.9 kg (120/200) 36.3 691.0 1.9 4.1 3.5 2.0 3
Note ─ Data are expressed as the mean values ± standard deviation.
* DLP and effective dose for brain CT images are those for the unenhanced CT scan. The radiation doses were equal for unenhanced and enhanced CT scans.
of visual grade as follows: 2.8 in chest CT images, 2.9 in heart CT images, 2.6 in abdomen-pelvis CT images, 2.9 in dynamic abdomen CT images, 2.7 in neck CT images, and 2.7 in brain CT images (Table 6).
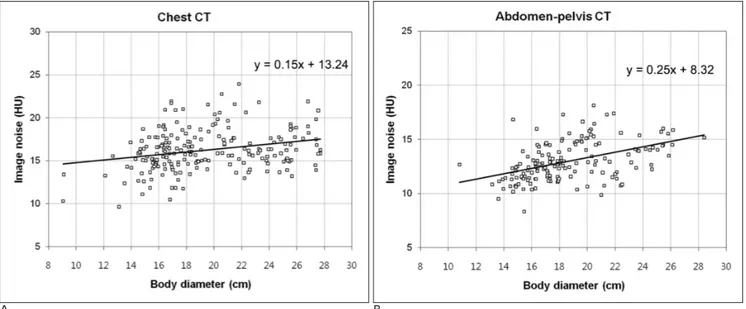
The CTDIvolof our CT protocols were highly correlat- ed with the measured body diameter (r = 0.88 in chest CT, r = 0.88 in heart CT, r = 0.87 in the abdomen- pelvis CT images, r = 0.91 in dynamic abdomen CT im- ages, r = 0.83 in neck CT images, and r = 0.90 in brain CT images; p <0.001 for all protocols). The scatter plots
between the CTDIvoland the measured body diameter appeared stepwise rather than linear due to the employ- ment of stepwise CT imaging parameters based on each body-weight group (Fig. 4). On the other hand, image noise showed variable degrees of association with the measured body diameter in all CT protocols except for neck CT images (r = 0.26, p < 0.001 in chest CT images, r = 0.49, p < 0.001 in heart CT images, r = 0.46, p <
0.001 in abdomen-pelvis CT images, r = 0.40, p = 0.01 in dynamic abdomen CT images; r = 0.78, p < 0.001 in
Table 6. Summary of Visual Image Quality Analyses
CT Protocol Grade 1 Grade 2 Grade 3 Grade 4
(Non-diagnostic) (Suboptimal but Acceptable) (Good) (Excellent)
Chest (n=202) 0 51 141 10
Heart (n=75) 0 13 053 09
Abdomen-pelvis (n=160) 0 69 089 02
Dynamic Abdomen (n=41) 0 08 031 02
Neck (n=26) 0 08 018 00
Brain (n=36) 0 10 026 00
Note ─ Data are expressed as the number of examinations.
A B
C
Fig. 3. Graphs showing the mean effective dose estimates in each age group for (A) chest and heart CT images, (B) abdomen- pelvis and dynamic abdomen CT images, and (C) neck and brain CT images.
brain CT; and r = - 0.07, p = 0.71 in neck CT) (Fig. 5).
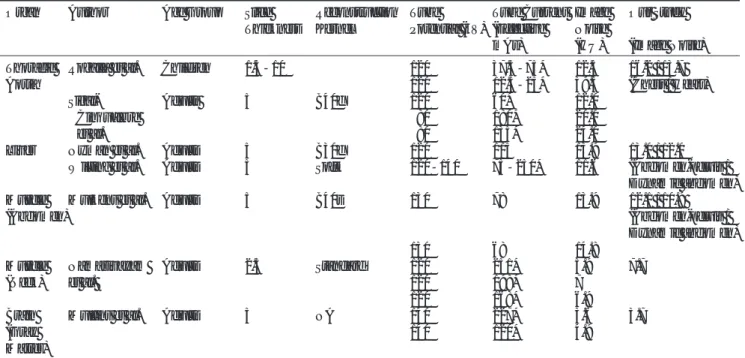
Our CT dose parameters were substantially lower than the reference doses, which comprised the third quartile of both the cited German and UK dose surveys (10, 11), and were comparable to the first quartile of the German survey (Fig. 6) (Table 7). Our mean effective doses were 46%, 61%, and 62% of the German refer- ence dose for chest, abdomen-pelvis, and brain CT im-
ages, respectively. The CTDIvol of our chest and ab- domen-pelvis CT images were also comparable to those by Greess et al. (6) and Huda et al. (13) (Fig. 6). Image noise levels of CT protocols were similar to that of previ- ously published data (17-23) (Table 8).
A B
Fig. 4. Scatter plots showing the correlation between CTDIvoland measured body diameter in (A) chest CT images and (B) ab- domen-pelvis CT images. The CTDIvolshows a statistically significant linear correlation between body diameter for the chest CT images (r = 0.88, p<.001) and abdomen-pelvis CT images (r = 0.87, p<.001). The best-fit lines are shown as a solid line (chest CT, intercept = -2.62, slope = 0.34; abdomen-pelvis CT, intercept = -3.66, slope = 0.51). The scatter plots appear stepwise rather than linear because of weight-group-based adjustment of the CTDIvol.
A B
Fig. 5. Scatter plots show a correlation between image noise and measured body diameter in the (A) chest CT images and (B) ab- domen-pelvis CT images. Image noise shows a positive correlation with body diameter for both the chest CT images (r = 0.26, p<0.01) and the abdomen-pelvis CT images (r = 0.46, p<0.01). For each scatter plot, the best-fit lines are shown as a solid line (chest CT, intercept = 13.24, slope = 0.15; abdomen-pelvis CT, intercept = 8.32, slope = 0.25).
Table 7. Summary of Radiation Dose for the current Study, the German Survey, and the UK Survey
CTDIvol(mGy) DLP (mGy・cm) Effective Dose (mSv)
CT protocol Our German UK Our German UK Our German UK
Study Survey Survey Study Survey Survey Study Survey Survey
Chest
Newborn 1.9 3.6 (2.0-4.2)0 029 46 (25-47)0 1.0 1.9 (1.0-2.1)
Up to 1 year 2.7 5.4 (2.6-6.9)0 11 (5.1-12) 057 77 (36-93)0 159 (68-204)0 1.3 2.2 (1.2-2.6) 6.3 (2.6-7.9) 2-5 years 2.8 6.1 (3.0-8.4)0 11 (7.6-13) 070 116 (60-137)0 198 (119-228) 1.3 2.6 (1.4-3.2) 3.6 (2.1-4.1) 6-10 years 4.2 08.5 (3.7-11.9)0 14 (9.5-17) 124 194 (98-257)0 303 (174-368) 1.7 3.0 (1.4-3.9) 3.9 (2.3-4.8)
11-15 years 5.5 12.4 (8.0-16.0)0 195 360 (224-488) 1.9 3.4 (2.1-4.4)
Abdomen-pelvis
Newborn NA 4.2 (3.1-4.6)0 NA 71 (49-81)0 NA 3.6 (2.3-4.6)
Up to 1 year 4.0 6.2 (4.8-6.8)0 129 148 (87-164)0 3.6 4.8 (2.4-4.9)
2-5 years 4.6 7.9 (4.2-8.3)0 164 219 (103-261) 3.6 5.4 (2.2-5.6)
6-10 years 5.7 10.7 (6.0-13.7)0 249 342 (220-477) 3.9 5.8 (3.7-7.2)
11-15 years 7.8 16.6 (13.0-20.2) 404 656 (408-804) 4.2 6.7 (4.4-8.0)
Brain
Newborn 16.8 21.9 (16.1-26.1) 198 227 (162-275) 2.0 2.3 (1.6-2.7)
Up to 1 year 18.0 26.2 (16.9-33.6) 25 (16-28) 238 302 (179-393) 230 (160-270) 1.7 2.2 (1.3-2.8) 2.5 (1.8-3.0) 2-5 years 27.1 35.7 (21.6-49.0) 34 (24-43) 390 452 (271-611) 383 (280-465) 1.6 1.9 (1.2-2.6) 1.5 (1.1-1.9) 6-10 years 30.6 43.7 (29.3-58.0) 44 (32-51) 442 582 (394-711) 508 (402-619) 1.5 2.0 (1.4-2.5) 1.6 (1.3-2.0)
11-15 years 31.8 53.2 (44.4-64.5) 490 764 (588-920) 1.4 2.2 (1.7-2.7)
Note ─ Data are expressed as mean values. The numbers in parentheses indicate the first-third quartile in each age group.
NA = not available.
A B
C
Fig. 6. The graphs show the CTDIvol(16 cm-phantom-based val- ue) of our protocols and previously published CT protocols for the (A) chest CT images, (B) abdomen-pelvis CT images, and (C) brain CT images. The amount and pattern of CTDIvol in our study are comparable to those of previous protocols with the ex- ception of the protocol by Donnelly et al. (6) (dashed line). In this protocol, the CTDIvolis higher in the younger age group (2- 5 years) than the older age group (6-15 years) due to an abrupt change in pitch between the two.
Discussion
In the present study, we described radiation dose pa- rameters and image noise in our weight-based pediatric multi-slice CT protocol. Our study group of 540 clinical CT examinations encompassed nearly the entire range of children’s body-weight groups and anatomical re- gions. To the best of our knowledge, a study compre- hensively describing radiation dose parameters, image noise, and visual image quality for pediatric brain, neck, and body CT protocols has not been performed. It should be noted that our CT protocols utilized all avail- able dose reduction strategies, including body-weight- based tube current adaptation, low tube potential, and tube current modulation.
We found that our CTDIvolapproximates the German first quartile (10) and recently proposed pediatric CT protocols (6, 13) in both its values and pattern among the different age groups (Fig. 6). As expected, radiation dose parameters showed a tendency to be less in lighter- weight and younger-age groups. The only exception was the effective dose for brain CT images, in which the val- ue showed a tendency to be less in older age groups (Fig.
3C). Notably, other researchers previously demonstrat- ed that the effective dose from pediatric brain CT de- creases exponentially with increasing body length (24).
For heart and dynamic abdomen CT protocols, the ef- fective dose was less in the 11-15-year age group than in the 6-10-year age group (Fig. 3A, B). This might be due to a change in imaging parameters or suboptimal parameters. Similarly, CTDIvolwas higher in the 2-5-
Table 8. Image Parameters and Image Noise of Previously Published CT Protocols (24-30)
Organ Author Age Group Slice Reconstruction Tube Tube Current Image Our Study Thickness Kernel Potential (kV) (Effective Noise
mAs) (HU) (Image Noise)
Thoracic Rogalla et al. Children 1.5-10 120 37.5-75* 12.5 16.2 / 13.7
Aorta 120 12.5-25* 39.5 (Chest / Heart)
Sigal- Adults 5 B40f 120 60* 12.0
Cinqualbre 080 180* 20.0
et al. 080 135* 24.0
Liver Nyman et al. Adults 5 B30f 120 115 13.9 13.0 / 12.0
Wilting et al. Adults 5 Soft 120-140 75-250* 11.6 (Abdomen-pelvis /
Dynamic abdomen)
Muscle Mulkens et al. Adults 5 B40s 130 78 13.9 12.1 / 10.9
(Abdomen) (Abdomen-pelvis /
Dynamic abdomen)
130 68 14.8
Muscle Namasivayam Adults 2.5 Standard 120 251* 5.9 7.7
(Neck) et al. 120 198* 7
120 168* 6.9
Brain Mullins et al. Adults 5 NA 140 227* 3.6 3.7
(Gray 140 120* 4.9
Matter)
Note ─ * The values of effective tube current-time product (effective mAs) were calculated using given values of mAs and pitch in the literature (effective mAs = mAs/pitch).
Appendix
Variables for Effective Dose Calculation in the Sensation 16 CT [12]
Scan Phantom Effective Dose
Scanner Correction
Region Factor Normalized to DLP Age Correction Factor (aC)
(Pf) (Cf) (mGy・cm) Factor (sC)
16-cm 32-cm Male Female Head Body (sCbody)
Newborn Up to 2-5 6-10 11-15
(sChead) 16-cm 32-cm 1 year years years years
Chest 0.77 0.45 0.0068 0.0088 0.90 0.90 1.00 3.90 (1.5) 2.70 (1) 2.03 (1) 1.53 (0.5) 1.11 (0) Abdomen 0.77 0.45 0.0072 0.0104 0.90 0.90 1.00 4.47 (1.5) 2.94 (1) 2.12 (1) 1.55 (0.5) 1.10 (0) Head / Neck 0.76 0.0022 0.0024 0.90 0.90 3.53 (1.5) 2.63 (1) 1.51 (1) 1.25 (0.5) 1.05 (0) The number in parentheses is the value of x.
year age group than in the 6-15-year age groups in body CT protocols by Donnelly et al. (4) (Fig. 6) proba- bly due to a change in pitch between the two groups.
Overscanning or overranging is defined as extra-expo- sure along the z-axis that extends beyond the planned scan region for data interpolation. The value is scanner- specific and is proportional to beam collimation, recon- structed slice width, and pitch (25, 26). However, over- scanning is not related to the planned scan length. Thus, the contribution of overscanning to the total CT dose should be greater when the planned scan length is short, as in pediatric CT imaging. In a study using pediatric an- thropomorphic phantoms and a Sensation 16 CT scan- ner (pitch = 1.0) (25), the overscanning contribution to the total dose was up to 43% for the head-neck CT, 70%
for the chest CT, and 36% for the abdomen-pelvis CT, which were approximately twice the adult values (26).
Therefore, overscanning should be taken into considera- tion in dose estimation of pediatric CT imaging. In our study, the overscanning length was taken into account in the calculation of the effective dose because the DLP is a product of CTDIvoland total scan length (planned length + overscanning length). Fortunately, this over- scanning, which is a growing dose concern in pediatric multi-slice CT imaging, is expected to be excluded from the total CT dose by a new collimation technique.
The diagnostic level of image noise in clinical CT ex- aminations is difficult to determine because the level must differ among the different diagnostic tasks or radi- ologists (27). In addition, multiple factors, including ra- diation dose, image reconstruction kernel, and method of contrast enhancement, influence the image noise.
Since image noise is anticipated to be greater as a result of the lower tube potential used in our study, the mean image noise values in our CT protocols are similar to those of previous studies (17-23) (Table 8). This unex- pected finding in image noise may be attributed to the differences in the section thickness (equal or thicker in our study), reconstruction kernel (smoother in our study), and the application of tube current modulation.
Nevertheless, the aforementioned result may partly sup- port the speculation that our pediatric multi-slice CT protocols may provide acceptable image noise.
Moreover, the results of visual image quality assessment may also support the clinical acceptability of our image noise level. Comparative studies between image noise and subjective image quality in adults proposed cut-off values for acceptable image noise (10 HU for the liver, 20 HU for the thoracic aorta, and 6 HU for the brain)
(18, 28-30). Because there are only a few studies re- garding image quality in pediatric CT imaging studies, further work is needed to establish the diagnostic level of image quality for specific pediatric CT protocols.
From this viewpoint, our results of image noise for vari- ous pediatric CT protocols seem to be helpful for future studies.
In our study, image noise was slightly less in children with smaller body diameters than in those with larger body diameter in all CT protocols except for neck CT images (Fig. 5). Previous studies have found that it is un- reasonable to require the same level of image noise, in- dependent of body diameter (10, 20). There are several reasons why CT images in smaller children require slightly lower image noise than that of larger children.
Smaller patients generally have a small amount of body fat, which is an inherent contrast agent. Also, for a con- stant noise level, subjectively scored image quality was worse in smaller patients (20). Therefore, the pattern of correlation between image noise and body diameter suggests that our CT protocols adapt well to patient size.
Based on X-ray physics, radiation dose is reduced by half for every 4-cm decrease in body diameter (the so- called “factor of 2 per 4-cm” rule) for the same level of image noise (9, 20). To obtain slightly less image noise in smaller patients, dose reduction should be slightly less than the amount determined by the ‘factor of 2 per 4- cm’ rule. Some researchers proposed a ‘factor of 2 per 8- cm’ rule as an appropriate dose reduction rate in body CT images (10, 31). Interestingly, the slopes of the corre- lation between CTDIvoland body diameter in our body CT seemed to be a good fit with the ‘factor of 2 per 8- cm’ rule (Fig. 4). For example, a chest CT demonstrated a factor of 1.96 per 8-cm between CTDIvoland body di- ameter (5.54 mGy and 2.82 mGy in 24-cm and 16-cm body diameters, respectively), whereas abdomen-pelvis CT images demonstrated a factor of 1.91 per 8-cm be- tween CTDIvoland body diameter (8.58 mGy and 4.50 mGy in 24-cm and 16-cm body diameters, respectively).
As mentioned above, the stepwise pattern of the correla- tion was a result of CT imaging parameters determined in an interrupted manner by body-weight groups rather than contiguously by an algebraic equation. Currently, such a group-based CT protocol (either body weight or age) is the most commonly used protocol for pediatric CT imaging (32). However, cross-sectional dimensions and attenuation of the scanned body region provide a more homogeneous CT image quality than body weight does (33). Tube current modulation is usually regarded
as insufficient for that purpose in pediatric CT imaging.
Dose reduction by tube current modulation was report- ed to be lower in newborns due to a symmetric cross- section of the body (7). Nevertheless, tube current mod- ulation should be always used in pediatric CT since it is poses no risk of harm.
The benefit of low tube potential in pediatric CT im- ages is two-fold (7, 9, 11); First, lowering the tube poten- tial is a reasonable option for dose saving in children (9, 12, 22). Second, low tube potential increases the signal- to-noise ratio or contrast-to-noise ratio of tissue contain- ing a relatively high concentration of iodine (9, 18).
However, low tube potential may provide unacceptable high image noise in the scanned body regions that are large size or high attenuation. Therefore, we did not use 80 kVp for the brain CT because this study requires a very low level of image noise and because the head is encircled by the skull. In abdomen CT imaging, a low kVp was employed with high tube current to compen- sate for increased image noise in our study. Other inves- tigators reported that the contrast-to-noise ratio of hy- pervascular liver lesion can be substantially increased and the CT dose reduced by using an 80-kVp, high tube current CT technique (34). In addition, the low tube po- tential should be carefully used in combination with tube current modulation because the use of low tube po- tential in larger patients may deactivate the tube current modulation by reaching its maximal capacity of the X- ray tube (8).
Several limitations exist in our study. First, our results should be appropriately modified to other CT models because they were determined from one particular CT model. However, it is probable that our results could be used as a reference by other pediatric radiologists be- cause we provided both the radiation dose parameters and image noise. Therefore, our results can be modified to a different CT model by cross-referencing these para- meters. A report concerning radiation dose in various CT models may be helpful for such a modification (35).
Secondly, validation of radiation dose with dosimetric measurement was not performed in our study. In a Sensation 16 CT, the difference between the measured CTDI and the value displayed on the console was re- ported to be within a range of 10% in our beam collima- tion and tube potentials used in our study (15), and we considered this range to be acceptable in the clinical set- ting. Further validation studies of dose estimation meth- ods are necessary. Finally, some body weight groups had a small number of examinations, particularly in the
less than 5 kg group, which represents an unequal sam- ple effort (Table 1). We believe that a paucity of CT ex- aminations in this small baby group has been a common problem in other studies dealing with pediatric CT im- ages(10, 17). For instance, newborn CT images account- ed for only 3% of all pediatric CT examinations in the German survey (10).
In conclusion, various dose-saving strategies reduce our pediatric multi-slice CT dose to the lower end of published standards. Moreover, the image noise mea- sured in our study can be used as a target noise level for each protocol in developing better pediatric multi-slice CT protocols.
Acknowledgments
The authors thank Joo Kim, RT, and other CT techni- cians for their support and participation in performing pediatric CT at our institution.
References
1. Brenner DJ, Hall EJ. Computed tomography-an increasing source of radiation exposure. N Engl J Med 2007;357:2277-2284
2. Slovis TL. Introduction to seminar in radiation dose reduction.
Pediatr Radiol 2002;32:707-708
3. Cody DD, Moxley DM, Krugh KT, O’Daniel JC, Wagner LK, Eftekhari F. Strategies for formulating appropriate MDCT tech- niques when imaging the chest, abdomen, and pelvis in pediatric patients. AJR Am J Roentgenol 2004;182:849-859
4. Donnelly LF, Frush DP. Pediatric multidetector body CT. Radiol Clin North Am 2003;41:637-655
5. Siegel MJ. Multiplanar and three-dimensional multi-detector row CT of thoracic vessels and airways in the pediatric population.
Radiology 2003;229:641-650
6. Greess H, Nomayr A, Wolf H, Baum U, Lell M, Bowing B, et al.
Dose reduction in CT examination of children by an attenuation- based on-line modulation of tube current (CARE Dose). Eur Radiol 2002;12:1571-1576
7. Goo HW, Suh DS. Tube current reduction in pediatric non-ECG- gated heart CT by combined tube current modulation. Pediatr Radiol 2006;36:344-351
8. Goo HW, Suh DS. The influences of tube voltage and scan direc- tion on combined tube current modulation: a phantom study.
Pediatr Radiol 2006;36:833-840
9. Suess C, Chen X. Dose optimization in pediatric CT: current tech- nology and future innovations. Pediatr Radiol 2002;32:729-734 10. Nagel MG, Stamm G. Paediatric CT exposure practice in the federal
republic of Germany: results of a nation-wide survey in 2005/06.
Hannover: Hannover Medical School. 2006. Available from URL : http://www.mh-hannover.de/fileadmin/kliniken/diagnostische_ ra- diologie/download/Report_German_Paed-CT-Survey_2005_06.pdf.
11. Shrimpton PC, Hillier MC, Lewis MA, Dunn M. National survey of doses from CT in the UK: 2003. Br J Radiol 2006;79:968-980 12. Siegel MJ, Schmidt B, Bradley D, Suess C, Hildebolt C. Radiation
dose and image quality in pediatric CT: effect of technical factors and phantom size and shape. Radiology 2004;233:515-522 13. Huda W, Vance A. Patient radiation doses from adult and pedi-
atric CT. AJR Am J Roentgenol 2007;188:540-546
14. Goo HW. Pediatric CT: understanding of radiation dose and opti- mization of imaging techniques. J Korean Radiol Soc 2005;52:1-5 15. Theocharopoulos N, Perisinakis K, Damilakis J, Karampekios S,
Gourtsoyiannis N. Dosimetric characteristics of a 16-slice comput- ed tomography scanner. Eur Radiol 2006;16:2575-2585
16. ImPACT CT Patient Dosimetry Calculator (version 0.99x 20/01/06). London : ImPACT. 2006. Available from URL : http://
www.impactscan.org/ctdosimetry.
17. Rogalla P, Stover B, Scheer I, Juran R, Gaedicke G, Hamm B. Low- dose spiral CT: applicability to paediatric chest imaging. Pediatr Radiol 1999;29:565-569
18. Sigal-Cinqualbre AB, Hennequin R, Abada HT, Chen X, Paul JF.
Low-kilovoltage multi-detector row chest CT in adults: feasibility and effect on image quality and iodine dose. Radiology 2004;231:
169-174
19. Nyman U, Ahl TL, Kristiansson M, Nilsson L, Wettemark S.
Patient-circumference-adapted dose regulation in body computed tomography. A practical and flexible formula. Acta Radiol 2005;46:
396-406
20. Wilting JE, Zwartkruis A, van Leeuwen MS, Timmer J, Kamphuis AG, Feldberg M. A rational approach to dose reduction in CT: in- dividualized scan protocols. Eur Radiol 2001;11:2627-2632 21. Mulkens TH, Bellinck P, Baeyaert M, Ghysen D, Van Dijck X,
Mussen E, et al. Use of an automatic exposure control mechanism for dose optimization in multi-detector row CT examinations: clini- cal evaluation. Radiology 2005;237:213-223
22. Namasivayam S, Kalra MK, Pottala KM, Waldrop SM, Hudgins PA. Optimization of Z-axis automatic exposure control for multide- tector row CT evaluation of neck and comparison with fixed tube current technique for image quality and radiation dose. AJNR Am J Neuroradiol 2006;27:2221-2225
23. Mullins ME, Lev MH, Bove P, O’Reilly CE, Saini S, Rhea JT, et al.
Comparison of image quality between conventional and low-dose nonenhanced head CT. AJNR Am J Neuroradiol 2004;25:533-538 24. Chapple CL, Willis S, Frame J. Effective dose in paediatric com-
puted tomography. Phys Med Biol 2002;47:107-115
25. Tzedakis A, Damilakis J, Perisinakis K, Karantanas A, Karabekios S, Gourtsoyiannis N. Influence of z overscanning on normalized
effective doses calculated for pediatric patients undergoing multi- detector CT examinations. Med Phys 2007;34:1163-1175
26. Tzedakis A, Damilakis J, Perisinakis K, Stratakis J, Gourtsoyiannis N. The effect of z overscanning on patient effective dose from mul- tidetector helical computed tomography examinations. Med Phys 2005;32:1621-1629
27. Kalra MK, Maher MM, Toth TL, Hamberg LM, Blake MA, Shepard JA, et al. Strategies for CT radiation dose optimization.
Radiology 2004;230:619-628
28. Haaga JR. Radiation dose management: weighing risk versus bene- fit. AJR Am J Roentgenol 2001;177:289-291
29. Cohnen M, Fischer H, Hamacher J, Lins E, Kotter R, Modder U.
CT of the head by use of reduced current and kilovoltage: relation- ship between image quality and dose reduction. AJNR Am J Neuroradiol 2000;21:1654-1660
30. Starck G, Lonn L, Cederblad A, Forssell-Aronsson E, Sjostrom L, Alpsten M. A method to obtain the same levels of CT image noise for patients of various sizes, to minimize radiation dose. Br J Radiol 2002;75:140-150
31. Honnef D, Wildberger JE, Stargardt A, Hohl C, Barker M, Gunther RW, et al. Multislice spiral CT (MSCT) in pediatric radiology: dose reduction for chest and abdomen examinations. Rofo 2004;176:1021-1030
32. Verdun FR, Lepori D, Monnin P, Valley JF, Schnyder P, Gudinchet F. Management of patient dose and image noise in rou- tine pediatric CT abdominal examinations. Eur Radiol 2004;14:835- 841
33. Jung YY, Goo HW. The optimal parameter for radiation dose in pediatric low dose abdominal CT: cross-sectional dimensions ver- sus body weight. J Korean Radiol Soc 2008;58:169-175
34. Schindera ST, Nelson RC, Mukundan S Jr., Paulson EK, Jaffe TA, Millder CM, et al. Hypervascular liver tumors: low tube voltage, high tube current multi-detector row CT for enhanced detection- phantom study. Radiology 2008;246:125-132
35. National Health Service: purchasing and Supply Agency. Report 06012, sixteen slice CT scanner comparison report version 14. 2006 London: National Health Service. 2006. Available from URL:
http://www.impactscan.org/reports/Report06012.htm
대한영상의학회지 2008;59:333-347
16-절편 소아 CT 프로토콜: 방사선량과 영상의 질1
1울산대학교 의과대학 서울아산병원 영상의학과교실, 영상의학연구소
양 동 현・구 현 우
목적: 이 연구의 목적은 16-절편 CT를 이용한 소아 CT 프로토콜의 방사선량과 영상의 질을 평가하고 이를 이전 연구와 비교하는 것이다.
대상과 방법: 환자의 몸무게를 기준으로 방사선량을 조절하여 검사한 16-절편 소아 CT 540예에서 CTDIvol, DLP, 유효선량, 그리고 영상잡음을 평가하였다. 두 명의 영상의학 전문의가 합의로 시각적인 영상의 질을 평가 하였다. CTDIvol과 영상소음의 체직경에 대한 상관관계를 분석하였다. 우리의 연구결과를 출간된 자료들과 비교 하였다.
결과: 각 신체부위의 CT에서 평균 CTDIvol (mGy), DLP (mGy・cm), 유효선량 (mSv), 그리고 영상소음 (HU)은 다음과 같다: 4.1/125.5/1.6/16.2 흉부 CT, 3.3/54.2/1.2/13.7 심장 CT, 5.8/256.6/3.8/13.0 복부-골반 CT, 6.8/318.7/5.9/12.0 역동적 복부 CT, 3.5/86.2/0.3/7.9 경부 CT, 그리고 25.4/368.0/1.6/3.7 두부 CT. 모든 CT 검 사는 진단 가능한 영상의 질을 보였다. CTDIvol과 영상소음은 체직경에 각각 양의 상관 관계를 보였다. 방사선량 지표들은 최근 독일의 전국적 방사선량 조사의 일사분위수와 비슷했다. 영상소음은 출간된 자료들과 비슷했다.
결론: 저자들의 소아 CT 방사선량은 출간된 자료들의 낮은 극단에 속한다. 본 연구의 영상소음은 앞으로 좀더 개 선된 소아 다중 절편 CT 프로토콜을 확립할 때 목표치로 사용될 수 있을 것이다.