INTRODUCTION
Although the prevalence of allergic rhinitis (AR) has increased over the past few decades, the majority of the epidemiological surveys have been conducted mainly in Europe and North America, and to a lesser extent in the developed Asian coun- tries such as, Japan, Korea, and Singapore. These surveys have demonstrated that there is considerable variation in the preva- lence of AR in these regions and ranges from 11.8% to 46%.1,2 By comparison, there are fewer published data on the prevalence of AR in other developing countries around the world.3
Presently, data from only a few surveys are available on the prevalence of AR in Mainland China, which is undergoing a rap- id economic and cultural development. In 1998, the Interna- tional Study on Asthma and Allergy in Childhood (ISAAC) re- vealed that the prevalence of allergic rhinoconjunctivitis symp- toms and other allergic symptoms among children aged 13-14 years in 5 major cities (Beijing, Chongqing, Guangzhou, Shang- hai, and Urumqi) varied from 5% to 10%, which was lower than those in the USA and Europe, as well as in Hong Kong with a
prevalence of 24%.4 A population-based, cross-sectional study employing validated questionnaires-based telephone inter- views in over 38,000 adults in 11 major cities on Mainland Chi- na has recently reported that the age-and gender-adjusted self- reported prevalence of AR was highly variable across the cities and ranged from the lowest prevalence of 8.7% in Beijing in east China to the highest prevalence of 24.1% in Urumqi in west Chi- na.5 However, another study in 3-6 years old children in Wuhan city in central China has suggested that use of only question- naires may lead to overestimation of the true prevalence of AR.6 We reported that the prevalence of AR in these children based on only a diagnostic criterion of nasal symptoms was 27.1%, whereas the adjusted prevalence based on both the diagnostic criterion of nasal symptoms and positive skin prick test (SPT) re-
Original Article
Allergy Asthma Immunol Res. 2014 Forthcoming.
Posted online 2014
pISSN 2092-7355 • eISSN 2092-7363
Prevalence of Allergic Rhinitis Among Adults in Urban and Rural Areas of China: A Population-Based Cross-Sectional Survey
Ming Zheng,
1Xiangdong Wang,
1,2Mingyu Bo,
1Kuiji Wang,
1Yan Zhao,
1,2Fei He,
2Feifei Cao,
1Luo Zhang,
1,2* Claus Bachert
31Department of Otolaryngology Head and Neck Surgery, Beijing TongRen Hospital, Capital Medical University, Beijing, China
2Key Laboratory of Otolaryngology Head and Neck Surgery (Ministry of Education of China), Beijing Institute of Otolaryngology, Beijing, China
3Upper Airways Research Laboratory, Department of Oto-Rhino-Laryngology, Ghent University Hospital, Ghent, Belgium
This is an Open Access article distributed under the terms of the Creative Commons Attribution Non-Commercial License (http://creativecommons.org/licenses/by-nc/3.0/) which permits unrestricted non-commercial use, distribution, and reproduction in any medium, provided the original work is properly cited.
Purpose: The aim of the present study was to compare the prevalence of self-reported and confirmable allergic rhinitis (AR) with positive skin prick test (SPT) results among adults living in urban and rural areas of China. Methods: Adults from a community in Beijing and a village in Baoding were selected as representative urban and rural dwellers, respectively. All eligible residents were enrolled from the population register and received a face-to-face interview using modified validated questionnaires. Equal sets of randomly selected self-reporting AR-positive and AR-negative partici- pants who responded to the questionnaires were also investigated using skin prick tests. Results: A total of 803 participants in the rural area and a total of 1,499 participants in the urban area completed the questionnaires, with response rates being 75.9% and 81.5% respectively. The prevalence of self-reported AR of the rural area (19.1%) was significantly higher than that of the urban area (13.5%). The elementary school of educational lev- el increased the risk of having AR (adjusted OR=2.198, 95% CI=1.072-2.236) .The positive SPT rates among subjects with self-reported AR in the rural and urban areas were 32.5% and 53.3%, respectively; the confirmable AR prevalence of 6.2% and 7.2% among the rural and urban adults, re- spectively. Conclusions: The prevalence of confirmable AR is similar between rural and urban areas in China, although there is a higher prevalence of self-reported AR in the former.
Key Words: Allergic rhinitis; prevalence; epidemiology; skin prick test; China
Correspondence to: Luo Zhang, M.D, Beijing Institute of Otolaryngology No. 17, HouGouHuTong, DongCheng District, Beijing 100005, China.
Tel: +86-10-65141136; Fax: +86-10-85115988; E-mail: [email protected] Received: April 13, 2014; Revised: August 5, 2014; Accepted: August 28, 2014
•There are no financial or other issues that might lead to conflict of interest.
Allergy Asthma Immunol Res. 2015 March;7(2):148-157.
http://dx.doi.org/10.4168/aair.2015.7.2.148 pISSN 2092-7355 • eISSN 2092-7363
sults was 10.8%. Indeed, an earlier review of several population- based studies has shown that the proportion of rhinitis cases at- tributable to atopy was lower than the overall proportion of rhi- nitis cases identified in these studies, suggesting that inclusion of IgE-mediated tests is likely to provide a more accurate esti- mate of prevalence than epidemiological data alone.7
The prevalence of AR has not yet been investigated in urban and rural areas in China. Because the majority of the popula- tion (about 800 millions) of Mainland China live in rural areas, where the overall lifestyle, socioeconomic status and education are much different from urban areas, the purpose of the present study was primarily to compare the prevalence of AR between urban and rural areas estimated on the basis of data obtained using a combination of validated questionnaires and SPTs.
MATERIALS AND METHODS Study sites
There are 6,262 villages in the rural area of Baoding and 2,657 communities in the urban area of Beijing according to national census data files. In order to obtain a representative sample, 1 community, called Fang Zhuang, in the urban region of Beijing and one village, named Xin Zhuang, in the rural region of Baod- ing were randomly recruited for the present study using the ran- dom number table. Both regions are located in Hebei province in China; with Baoding being located about 140 km to the south- west of Beijing, and at same altitude and with similar climatic conditions as Beijing. Although traditions and customs are simi- lar in Beijing and Baoding, the level of economic development and urbanization is much lower in Baoding than in Beijing. In particular, the per capita gross national product (Per Capita GNP) of Baoding, well-known for agriculture and tourism, reached US$ 2,090 in 2008, whereas for Beijing, a commercial, industrial, and administrative center of China, the Per Capita GNP was US$ 9,075 in the same year. Although 31.76% and 83.6% of Baoding and Beijing, respectively, are urbanized, all the subjects investigated from Baoding were living in a rural area.
Study design
This was a population-based cross-sectional survey, carried out from April 2008 to August 2008 in 2 phases. In the first phase, a questionnaire was completed during a face-to-face in- terview by consenting adult residents in the 2 study areas. In the second phase, equal sets of randomly selected self-report- ing AR-positive and AR-negative subjects who had completed the questionnaire from each study area were invited to visit a local testing center and undergo SPTs using a panel of stan- dardized allergens. The study protocol (shown in Figure) was approved by the Ethics Review Committee of Beijing Institute of Otolaryngology and written informed consent was obtained from each participant prior to entry into the study.
Face-to-face interview
Face-to-face interviews were conducted by 10 specifically trained interviewers, either during the weekday from 17:30 to 21:00 or during the weekend from 9:00 to 22:00. All participants were enrolled from the population register of the local govern- ment. We interviewed only permanent residents aged ≥18 years old, who lived continuously in the rural or urban study ar- eas for over 1 year and at the same time had their household cards in the care of the local public security bureau. Face to face interviews were conducted in the community service center in Fang Zhuang or in the village committee office in Xin Zhuang, and only subjects who could complete the face-to-face ques- tionnaire by themselves were considered eligible for entry into the study.
Questionnaire design
The study questionnaire−comprising 15 questions regarding nasal symptoms, duration and severity, self-reported allergens, self-reported diagnoses of concomitant allergic diseases (in- cluding chronic sinusitis, asthma and atopic dermatitis), and family history of allergic disease−was derived from the well- documented and validated questionnaires employed in the ISAAC and the European Community Respiratory Health Sur- vey (ECRHS) studies as we have previously described.9
The criteria used to diagnose AR from the questionnaires were consistent with those of the ARIA, and subjects were clas- sified positive if they had typical symptoms, such as sneezing, runny, blocked, or itchy nose within the last 12 months, unre- lated to suffering from upper respiratory infections.5 AR sub- jects were further classified into intermittent or persistent sub- types based on the self-reported duration of symptoms. Inter- mittent AR was defined as AR with nasal symptoms lasting less than 4 days/week or less than 4 weeks/year, whereas persistent AR was defined as AR with nasal symptoms lasting more than 4 days/week and more than 4 weeks within the last 12 months.
Similarly, the severity of AR was classified as mild or moderate- severe on the basis of symptoms as well as the quality of life of the subject. Mild AR was defined as AR with normal sleep, no impairment of daily activities, sport, or leisure, normal work and school, and no troublesome symptoms. Moderate-severe AR was defined as AR with 1 or more items of abnormal sleep, impairment of daily activities, sport or leisure, abnormal work and school, and troublesome symptoms.8
SPTs
Prior to testing, all eligible participants were instructed to ab- stain from taking any antihistamines for at least 72 hours before the examination. SPTs were performed using the Allergophar- ma (Allergopharma, Reinbeck, Germany) employing a panel of 20 standardized allergen extracts (100,000 BU for Phazet and 10 HEP for Soluprick) that were used regularly in our department.
The panel comprised extracts of mixed animal hair, trees (Tree I,
Tree II, pine and Locust black), weeds (humulus, chenopodium album, mugwort, ragweed, and English plantain), cereals, dan- delion, Blattella Germanica, mites (Dermatophagoides pteronys- sinus and Dermatophagoides farinae), and fungi (Curvularia lu- nata, Candida albicans, Penicillium notatum, Alternaria tenuis, and Aspergillus fumigatus). Histamine (10 mg/mL) and saline were used as positive and negative controls, respectively.
The skin reaction to each allergen was observed after 15 min- utes and the size of the reaction was evaluated by tracing and measuring the perimeter of the wheal developed in response to any specific allergen. The largest and smallest diameters (at the widest point and at the midpoint at perpendicular to it, respec- tively) of each wheal were measured and calculated as the mean wheal diameter. SPT reactivity was graded as the aller- gen: histamine wheal ratio (AHWR), as described by Aas & Be- lin.9 A positive skin reaction to allergens was defined as an AHWR >0.5.
Confirmable prevalence of AR
Confirmable AR in the 2 study areas was defined as positivity
of both the self-reported AR and SPT to at least 1 aeroallergen.
As only a proportion of the subjects among the urban or rural population agreed to undergo SPTs, it was not possible to di- rectly calculate the positive rates of SPTs in total population.
Thus, the confirmable prevalence of AR in the population was calculated by multiplying self-reported prevalence by the per- centage of subjects with positive SPTs in self-reported AR pop- ulations.
Statistical analysis
All data were assessed by 2 independent investigators, using SPSS 11.5 for Windows (SPSS Inc., Chicago, IL, USA) Statistical Package for Social Sciences. The t and χ2 and t tests was used to assess the target population characteristics and any difference in the prevalence of AR between the 2 areas. Multivariate logis- tic regression was performed using the Enter method, a step- wise regression model, to assess the relationship of AR with the potential risk factors, such as area, age, gender, yearly income, and educational level. Subjects with missing values were ex- cluded from the regression model. All tests were based on Figure. Study flow chart. AR, allergic rhinitis; SPTs, skin prick test.
Adult residents in urban
(n=1,840) Adult residents in rural
(n=1,058)
Valid questionnaires
(n=1,499) Valid questionnaires
(n=803)
Self-report positive AR
(n=203) Self-report positive AR
(n=153) Failed face-to-face
interview (n=341) Failed face-to-face
interview (n=255)
Self-report negative AR
(n=1,296) Self-report negative AR
(n=650)
Sample equal negative AR
subjects randomly (n =203) Sample equal negative AR subjects randomly (n =153)
Accept SPTs (n =60)
SPTs (+) (n =32)
Refuse SPTs (n =143)
SPTs (-) (n =28)
Accept SPTs (n =68)
SPTs (+) (n =15)
Refuse SPTs (n =135)
SPTs (-) (n =53)
Refuse SPTs (n=115)
SPTs (-) (n=29)
Accept SPTs (n=38)
SPTs (+) (n=9)
Refuse SPTs (n=73)
SPTs (-) (n=54)
Accept SPTs (n=80)
SPTs (+) (n=26)
2-tailed tests using a significance level of P<0.05.
RESULTS
Sociodemographic characteristics
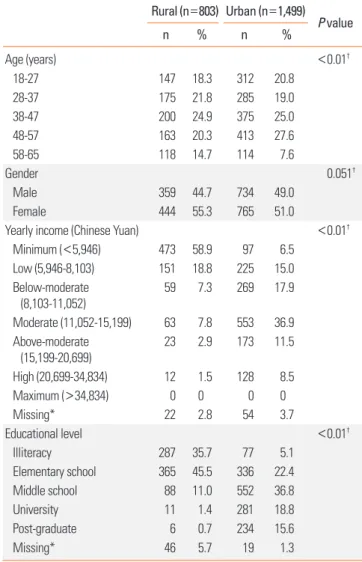
Among 1,732 adult residents in the rural area, 674 were mi- grant workers or students and therefore not considered perma- nent residents. Thus, a total of 1,058 eligible residents were in- terviewed face-to-face, and 803 (75.9%) of these individuals completed the study questionnaires. Similarly, 1,840 permanent adult residents in the urban community attended the face-to- face interview, of whom 1,499 (81.5%) completed the AR study questionnaires. Table 1 shows the sociodemographic character- istics of the 2 studygroups and indicated that both groups were significantly different with regard to age (mean age=41.4 years for the rural group vs 40.7 years for the urban group) and gender (female=55.3% in the rural group vs 51.0% in the urban group).
The individual household income per year, calculated in Chi- nese Yuan (CNY), for the urban and rural dwellers was classified according 1 of the 7 scales: minimum (<5,946 CNY), low (5,946- 8,103 CNY), below-moderate (8,103-11,052 CNY), moderate (11,052-15,199 CNY), above-moderate (15,199-20,699 CNY), high (20,699-34,834 CNY), and maximum income (>34,834 CNY) as recommended by “The 2008 Statistics Yearbook in Chi- na” published by National Bureau of Statistics of China. Most of the rural respondents belonged to minimum income house- hold (473 subjects; 58.9%) and low income (151 subjects; 18.8%) households, whereas the majority of the urban respondents be- longed to moderate (553 subjects; 36.9%) and below moderate (269 subjects; 17.9%) households. Similarly, data on the educa- tion background of the interviewees was classified as illiteracy, elementary school, middle school, university, and post-gradu- ate. While under 50% of the rural respondents (365 subjects, 45.5%) were educated only to the elementary school level and around one-third (287 subjects; 35.7%) were illiterate, over 70%
of the urban respondents (1,067 subjectssubjects, 71.2%) were educated to the middle school level or above (Table 1). The overall mean annual salary and education in the 2 areas were significantly different between the rural and urban subjects (P<0.01 for each) (Table 1).
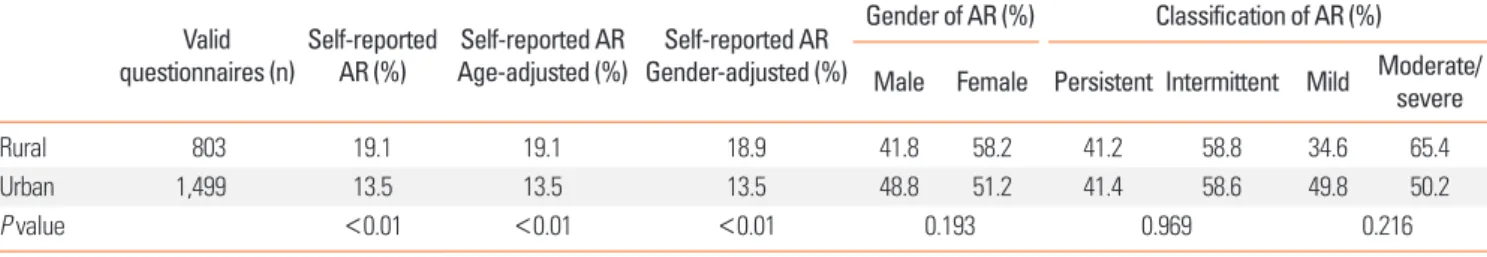
Prevalence of self-reported AR and potential risk factors Overall, 153 subjects (19.1%, SE=0.0139) were self-reported AR patients in 803 rural participants. After adjustment for the age and gender structure of the population, the age-adjusted prevalence of self-reported AR was 19.1%, and gender-adjusted prevalence was 18.9%. Among the 1,499 urban respondents, 203 (13.5%, SE=0.0088) reported AR. Both the age-and gender- adjusted prevalence of self-reported AR were still 13.5%. Ninety of these 153 rural subjects (58.8%) were shown to be intermit- tent AR suffers, and 63 (41.2%) persistent AR sufferers. Addition- ally, 87 (56.9%) of the 153 subjects were shown to suffer from
moderate/severe AR (Table 2). A total of 119 of the 203 urban subjects (58.6%) were diagnosed with intermittent AR sufferers and 84 (41.4%) persistent AR sufferers. Overall, 102 (50.2%) of these 203 were moderate/severe AR suffers (Table 2). A com- parison of self-reported AR prevalence between the rural and urban areas indicated the prevalence to be significantly higher in the rural area.
Multivariate logistic regression analysis of potential risk fac- tors for AR in the 2 areas further showed that the educational level of elementary school increased the risk of having AR (OR=
1.557, adjusted OR=2.198, 95% CI=1.072-2.236), but there was no significant association between AR and higher educational levels, such as middle school, university, and postgraduate. In contrast, low, below-moderate, and above-moderate yearly in- comes significantly decreased the risk for AR (OR=0.608, ad- justed OR=0.551, 95% CI=0.377-0.805; OR=0.589, adjusted OR=0.495, 95% CI=0.306-0.799; OR=0.598, adjusted OR=
Table 1. Prevalence of self-reported AR and socio-demographic characteristics of the study population
Rural (n=803) Urban (n=1,499) P value
n % n %
Age (years) <0.01†
18-27 147 18.3 312 20.8
28-37 175 21.8 285 19.0
38-47 200 24.9 375 25.0
48-57 163 20.3 413 27.6
58-65 118 14.7 114 7.6
Gender 0.051†
Male 359 44.7 734 49.0
Female 444 55.3 765 51.0
Yearly income (Chinese Yuan) <0.01†
Minimum (<5,946) 473 58.9 97 6.5
Low (5,946-8,103) 151 18.8 225 15.0
Below-moderate (8,103-11,052)
59 7.3 269 17.9
Moderate (11,052-15,199) 63 7.8 553 36.9 Above-moderate
(15,199-20,699) 23 2.9 173 11.5
High (20,699-34,834) 12 1.5 128 8.5
Maximum (>34,834) 0 0 0 0
Missing* 22 2.8 54 3.7
Educational level <0.01†
Illiteracy 287 35.7 77 5.1
Elementary school 365 45.5 336 22.4
Middle school 88 11.0 552 36.8
University 11 1.4 281 18.8
Post-graduate 6 0.7 234 15.6
Missing* 46 5.7 19 1.3
*Subjects who did not answer the question; †Overall mean value for rural sub- jects vs overall mean value for urban subjects.
0.489, 95% CI=0.275-0.868, respectively) compared to mini- mum yearly income. Moderate and high yearly income neither increased nor decreased the risk for AR (Table 3).
Self-reported symptoms, allergens and treatment
In the self-reported AR subjects from the rural area, sneezing was the most commonly reported AR symptom (57.7%), followed
by blocked nose (54.1%), runny nose (50.0%), itchy nose (42.7%), ocular symptoms (36.8%), and throat symptoms (32.3%). Self- awareness of olfactory disorders (20.0%) was less common. In contrast, in the self-reported AR subjects from the urban area, runny nose was the most commonly reported symptom (55.5%) and olfactory disorders (3.6%) the least common reported symp- tom (Table 4). Self-awareness of symptoms, including blocked nose, itchy nose olfactory disorders, and ocular symptoms, was significantly different between the rural and urban areas (P<
0.01).
The most commonly reported allergens were pollen and dust mite in the urban and rural regions, respectively (Table 4).
In the past 12 months, 2.1% of the self-reported AR subjects in the rural area presented at the clinic for their nasal complaints, among whom only 14 (1.5%) were diagnosed with AR by physi- cians, and 12 patients (1.5%) received surgical and/or medical treatment. Less than half of these subjects (41.7%) receiving treatment reported that their symptoms improved after the treatment. In the urban community, 5.9% of the self-reported subjects attended the clinic for a nasal problem, of whom 58 (3.9%) were diagnosed with AR by physicians. Overall, 76 (5.1%) of these subjects received treatment, of whom 37 reported no improvement or worsening of symptoms after the treatment (Table 4).
Nasal symptoms of the rural self-reporting AR respondents in the rural area were most common in November (49.7%) and December (48.3%), and generally decreased from June (23.5%) to September (20.8%). Urban participants’ nasal symptoms were most common in November (33.6%), and decreased sub- stantially from June (4.4%) to August (7.7%) (Table 4). These dif- ferences were statistically significant between the rural and ur- ban subjects from May to December and January (P<0.01).
Self-reported comorbidities of chronic sinusitis, asthma and atopic dermatitis
Chronic sinusitis was the most frequently mentioned comor- bidity in the self-reported AR subjects in the urban area (40.2%), whereas atopic dermatitis was the most frequent comorbidity in the self-reported AR subjects in the rural area (33.3%). Fur- thermore, for allergies in the family members of participants, AR (40.5%) was most frequently found in the rural self-report- ing AR individuals, followed by chronic sinusitis, asthma, and Table 2. Prevalence of self-reported AR
Valid
questionnaires (n) Self-reported
AR (%) Self-reported AR
Age-adjusted (%) Self-reported AR Gender-adjusted (%)
Gender of AR (%) Classification of AR (%) Male Female Persistent Intermittent Mild Moderate/severe
Rural 803 19.1 19.1 18.9 41.8 58.2 41.2 58.8 34.6 65.4
Urban 1,499 13.5 13.5 13.5 48.8 51.2 41.4 58.6 49.8 50.2
P value <0.01 <0.01 <0.01 0.193 0.969 0.216
AR, allergic rhinitis.
Table 3. Multivariate logistic regression models of potential risk factors for al- lergic rhinitis between the rural and urban areas
OR OR
(adjusted) 95% CI
(adjusted) P value (adjusted) Area
Urban (n=1,499) - - - -
Rural (n=803) 1.505 1.439 0.974-2.125 0.068
Gender
Male (n=1,093) - - - -
Female (n=1,209) 0.923 0.926 0.721-1.189 0.546 Age
18-27 (n=459) - - - -
28-37 (n=460) 0.875 0.900 0.604-1.342 0.606
38-47 (n=575) 0.839 0.846 0.575-1.244 0.394
48-57 (n=576) 0.895 1.170 0.788-1.736 0.437
58-65 (n=232) 1.002 1.282 0.778-2.112 0.330
Educational level
Illiteracy (n=364) - - - -
Elementary school (n=701) 1.557 2.198 1.072-2.236 0.02 Middle school (n=640) 1.417 1.879 0.966-2.078 0.074 University (n=292) 1.352 1.556 0.86-2.124 0.191 Post-graduate (n=240) 1.367 1.453 0.852-2.195 0.195 Yearly income
Minimum (n=570) - - - -
Low (n=376) 0.608 0.551 0.377-0.805 ﹤0.01
Below-moderate (n=328) 0.589 0.495 0.306-0.799 ﹤0.01 Moderate (n=616) 0.851 0.615 0.328-1.154 0.13 Above-moderate (n=196) 0.598 0.489 0.275-0.868 0.015
High (n=140) 0.661 0.531 0.28-1.005 0.052
Maximum (n=0) - - - -
Not all 803 rural subjects and 1,499 urban subjects are included in this analysis due to missing data.
atopic dermatitis; however, chronic sinusitis (40.3%) was most frequently found in the urban self-reporting AR individuals, fol- lowed by atopic dermatitis, AR, and asthma (Table 4).
Confirmable prevalence of AR
The rural and urban subjects self-reporting AR and an equal number of randomly selected subjects reporting negative AR were asked to undergo SPTs, and 118 rural subjects and 128 ur- ban subjects agreed to SPTs (Table 5). Table 5 shows that the positive rate of SPTs in self-reporting AR subjects was signifi- cantly different between the rural and urban areas (32.5% in the rural subjects vs 53.3% in the urban subjects, P<0.01). Accord- ing to the positive rate of SPTs in self-reporting AR between 2 ar- eas, we were able to deduce that the prevalence of confirmable AR in subjects with both positive self-reporting AR and positive SPTs were 6.2% in rural area and 7.2% in urban area, respective- ly. Although this was not significantly different (P=0.376) be- tween rural and urban area, the confirmable prevalence of AR was markedly lower in both the rural and urban areas than esti- mated on the basis of self-reported AR alone (19.1% and 13.5%, respectively).
DISCUSSION
To our knowledge, this is the first epidemiologi¬cal survey us- ing a combination of a questionnaire-based self-reported AR and positive SPTs (i.e., confirmable prevalence of AR) to deter- mine the prevalence of AR in adults in both rural and urban ar- eas in Mainland China. The assessment of the potential risk factors for AR in the 2 areas showed that only attaining the ele- mentary school education was associated with a significantly increased risk of AR, whereas low, below-moderate, and above- moderate yearly incomes were associated with significant pro- tective factors for AR.
The prevalence of self-reported AR in adults is much lower in our country than in many Westernized nations, such as Austra- lia (up to 41.3%), Europe (up to 41%), and the USA (30.2%),3,10,11 as well as in other developed/developing countries, such as Co- lombia (32%),12 Japan (35.5%),3 and Nigeria (29.6%).13 It is likely Table 4. Additional aspects of self-reported AR investigated.
Related contents Rural (%) Urban (%) P value
Self-awareness of symptoms
Blocked nose 54.1 26.2 <0.01
Runny nose 50.0 55.5 0.014
Itchy nose 42.7 21.1 <0.01
Sneezing 57.7 51.0 <0.01
Olfactory disorders 20.0 3.6 <0.01
Ocular symptoms 36.8 8.7 <0.01
Throat symptoms 32.3 40.8 <0.01
Reported allergen
Pollen 20.0 34.9 <0.01
Dust mite 22.3 15.1 <0.01
Fungi 9.4 9.4 1
Weed 8.0 7.5 0.676
Tree 2.0 5.7 <0.01
Animal fur 2.0 5.7 <0.01
Medical history
Present at the clinic 2.1 5.9 <0.01
Physician diagnosed AR 1.7 3.9 <0.01
Surgical/medical treatment 1.5 5.1 <0.01
Effective treatment 41.7 51.3 <0.01
Comorbidities
Chronic sinusitis 29.0 40.2 <0.01
Asthma 15.4 25.5 <0.01
Atopic dermatitis 33.3 6.4 <0.01
Allergies in the family members
AR 40.5 16.9 <0.01
Chronic sinusitis 32.4 40.3 <0.01
Asthma 18.9 11.3 <0.01
Atopic dermatitis 16.2 34.7 <0.01
Month for nasal symptoms
January 36.2 28.5 <0.01
February 23.5 27.4 0.045
March 35.6 32.5 0.144
April 32.2 29.9 0.266
May 28.9 15.0 <0.01
June 23.5 4.4 <0.01
July 24.2 6.9 <0.01
August 22.8 7.7 <0.01
September 20.8 10.2 <0.01
October 32.9 12.8 <0.01
November 49.7 33.6 <0.01
December 48.3 28.1 <0.01
AR, allergic rhinitis.
Table 5. Comparison of the results of SPTs Groups of accepted SPTs Total
number Positive
number Positive
prevalence P value
Rural total 118 35 29.7% 0.241
Urban total 128 47 36.7%
Rural self-reported AR 80 26 32.5% 0.327
Rural self-reported negative-AR
38 9 23.7%
Urban self-reported AR 60 32 53.3% <0.01*
Urban self-reported
negative-AR 68 15 22.1%
Rural self-reported AR 80 26 32.5% <0.01*
Urban self-reported AR 60 32 53.3%
*P<0.05.
AR, allergic rhinitis; SPTs, skin prick test.
that these differences in the prevalence of AR among different countries could be attributed to multiple conventional and nonconventional risk factors, including differences in genetic predisposition to allergic disease, environmental factors (geo- graphical, climatic, and air quality), allergen exposure (time, dose, number, and types of allergens), industrialization, and lifestyles (dwellings, exotic foods, pets, furnishings, etc.).1,3
Increasing evidence suggests that urbanization of an area has generally been associated with increased prevalence of respira- tory allergic disease, including AR and asthma in both adults and children.3,14-18 Indeed, a population-based study in Mongo- lia demonstrated that the prevalence of allergic sensitization was progressively increased from 13.6% in villages, to 25.3% in rural towns, to 31.0% in the city,18 suggesting that the degree of socioeconomic development and urbanization may directly in- fluence the prevalence rate of allergic sensitization. The find- ings of a higher prevalence of self-reported AR in the rural area than in the urban area investigated in the present study are sim- ilar to those in Korea, the Philippines, and Turkey; however, the higher prevalence of AR in urban areas was reported in Europe and Africa as well as West Germany after reunification (Table 6).18-25 This difference in the rural and urban areas in the pres- ent study may be due to several factors. In particular, interview response rates was lower in the rural area (75.9%) than in the urban area (81.5%), which possibly led to underreporting and underdiagnosis of AR in the rural area. Indeed, a recent study by Liu and colleagues14 investigating the prevalence of chronic
disease among the elderly in the urban and rural areas of Bei- jing has suggested that chronic disease in the rural area of Bei- jing was likely to be underdiagnosed and underreported par- tially as a result of limited availability of local health services, rural poverty, the lack of effective insurance coverage after the collapse of the rural Cooperative Medical System, and sharp in- creases in charges under the new fee-for-service system.
Since the 2 study cohorts in the present study were similar in terms of ethnicity (Han Chinese) and both were surveyed con- currently using the same instruments, it is likely that the preva- lence of AR in the 2 areas was influenced by environmental and/or sociodemographic factors. While Rona and colleagues26 have reported that a low socio-economic status may be associ- ated with an increase in the severity of asthma. In this regard, our results indirectly support Rona’s findings.26 Our study has demonstrated that the economic status of residents of the urban and rural areas was significantly different and that compared to minimum yearly income, low, below-moderate, and above- moderate yearly incomes were protective factors for AR and de- creases in prevalence. Moreover, evidence suggests that in indi- viduals at a low socioeconomic status, poor housing conditions (involving increased exposure to dampness, mould, and gener- ally poorer indoor air quality),27,28 lower intake of fruits and veg- etables, and higher consumption of unsaturated fat29 are associ- ated with an increased risk of atopic diseases. Although a lower prevalence of atopic diseases in rural areas has been associated with the “hygiene hypothesis”,30 epidemiological evidence Table 6. The overall prevalence of AR between the urban and rural areas in several countries, including Germany after reunification
Author Year Nation Study method Study population Number of subjects (n) Prevalence of AR (%)
Nicolai [19] 1994 Germany Questionnaire Children aged 9-11 years West 5,030 West 8.6
East 2,623 East 2.7
Heinrich [20] 1990 Germany Questionnaire Adults aged 20-44 years West 3,934 West 22.9
East 4,429 East 13.3
1994 Germany Questionnaire Adults aged 20-44 years West 4,327 West 24.6
East 3,819 East 15.9
Kim [21] 2002 Korea Questionnaire Children aged 7-18 years Urban 7,131 Urban 30.1-30.2
Rural 9,493 Rural 24.1-33.6
Graif [22] 2004 Israel Questionnaire Children aged 13-14 years Urban &
Rural 10,057 Urban 9.8
Rural 8.1
Viinanen [18] 2005 Mongolia Questionnaire Subjects aged 10-60 years City 896 City 18.4
Town 537 Town 12.9
Village 304 Village 9.3
Kowalski [23] 2007 Poland Questionnaire Children aged 12-16 years Urban 201 Urban 38.81
Rural 203 Rural 10.84
Guner [24] 2010 Turkey Questionnaire Children aged 6-18 years Urban 354 Urban 22.6
Rural 253 Rural 21.3
Abong [25] 2012 Philippines Questionnaire Adults Urban 3,418 Urban 18
Rural 3,714 Rural 22.1
AR, allergic rhinitis.
emerging from Germany following reunification of East and West Germany clearly suggests that the prevalence rates of self- reported AR and asthma-related respiratory symptoms in the eastern part of Germany tend to increase to West-German lev- els20 and that increases in the prevalence of allergic diseases in East Germany are likely to be a result of increased sensitization to aeroallergens rather than the study area.19 Our findings of similar confirmable prevalence of AR of 6.2% and 7.2% in the rural and urban areas, respectively, based on a positive self-re- ported AR and positive SPT results, are in accord with findings from studies in Germany after reunification. Moreover, in China it is also likely that the indoor air pollution is a more important determinant of allergic sensitization in rural areas than in urban areas, especially for low economic status subjects, because of the presence of a larger number of locally bred and raised pets, such as dogs and cats, as well as combustion of more organic fuels in rural areas.
In the present study, more than 80% of the rural respondents only received primary education, while over 70% of the urban interviewees received middle school or higher education. In this regard, it is possible that the interviewee’s poor educational background could possibly influence their understanding of AR, so they mistakenly self-report infectious rhinitis or vasomo- tor rhinitis as AR. The results of our study indicating that the ed- ucational level of elementary school increased the risk of AR also support our inference. Since health education, awareness, and media promotion of asthma and AR have been increased over the past few years on Mainland China, it is possible that the prevalence of AR may have been overestimated in individuals with poor educational background, considering that 45.5% of the rural participants only received elementary school educa- tion in the present study. Indeed, a questionnaire study aimed at investigating the prevalence of self-reported asthma and AR in adults after reunification of Germany showed that while the prevalence of asthma and AR remained stable in West Germa- ny, it appeared to significantly increased in East Germany, ap- proaching the levels in West Germany.20 We speculated that the apparent increase was primarily due to heightened awareness of atopic diseases among the public and health care providers.
In another survey from Turkey, researchers found that the risk of progression to asthma and atopic diseases was higher in fam- ilies in which the paternal educational level was low and that the sensitivity and awareness of these disorders may cause the prevalence to appear higher than it was.24 A cross-sectional sur- vey among otolaryngologists in Mainland China has recently demonstrated that while most of the otolaryngologists (61%) diagnosed AR based on medical history and nasal examina- tion, only 35% of the otolaryngologists used skin prick tests or specific IgE serum tests.31 It is thought that the diagnosis and management of AR in China was suboptimal and that Chinese otolaryngologists needed continuous education for proper un- derstanding of AR and non-AR. Therefore, these results suggest
that in view of this suboptimal understanding of the disease on the part of both patients and clinicians, the possibility of mises- timating the true prevalence of AR in China is high.
Moreover, our study showed that among the self-reporting AR subjects, only 32.5% in the rural area were found to have posi- tive SPT results, while 53.3% in the urban area had positive SPT result. Consequently, the prevalence of confirmable AR was found to be much lower at 6.2% in the rural area and 7.2% in the urban area, with no significant difference between the 2 ar- eas. This relationship between positive SPTs and self-reported AR in our study is consistent with that in a study by Zacha- rasiewcz and colleagues,7 who showed that the attributable fraction of IgE-mediated allergy in patients with a diagnosis of AR by questionnaires was slightly over 50%, indicating an over- estimation of the true prevalence of AR.
Furthermore, this result clearly demonstrates that in the pres- ent study, the self-reported prevalence of AR was overestimated for several reasons, of which a low educational level and poor understanding of differentiation between AR and non-AR are likely to feature prominently in our study cohort. Collectively, these studies suggest that overestimation of AR prevalence in the positively self-reporting subjects with negative SPT results may be attributed to the presence of other forms of rhinitis, such as infectious rhinitis, idiopathic rhinitis, non-AR with eosinophilia syndrome, and chronic rhinosinusitis.32 Indeed, our study has also shown that the positive rates of SPT are lower in self-report- ing negative AR subjects than in self-reporting AR subjects in the 2 areas (23.7% vs 32.5% in the rural area and 22.1% vs 53.3% in the urban area; Table 5), which is consistent with the SPT results of Kong’s study involving children with and without rhinitis symptoms10 and Mpairwe’s study33 involving women with and without a history of asthma. Considering seasonality of AR, our study has demonstrated that the nasal symptoms reported by rural subjects peak during the winter months of November to January, whereas they do not in urban subjects. While it is possi- ble that symptoms in rural subjects may be predominantly asso- ciated with specific allergens/air pollutants during this period, symptoms in urban subjects are likely be related to a larger vari- ety of allergens/air pollutants present throughout the year, with no specific seasonality being demonstrated. However, it is possi- ble that although subjects from both rural and urban areas have a similar cognitive degree of the presence or absence of nasal symptoms, they cannot easily differentiate the forms of rhinitis.
Although earlier assessment of data from the European Com- munity Respiratory Health Survey I showed that a panel of 7 out of 9 most common aeroallergens, including Dermatophagoides pteronyssinus, cat, grass, birch, olive pollen, Alternaria, and Cladosporium, allows identification of almost all sensitized sub- jects in an previous epidemiologic study,34 subsequent analysis has suggested that the estimation of the prevalence of AR may actually have been underestimated because some important al- lergens had not been tested.6 In the study, 20 standardized ex-
tracts were selected for SPT, in order to avoid underestimation of the confirmable prevalence of AR. However, with respect to the concept of entropy which means local production of IgE in nasal mucosa in up to 40% of non-AR patients,35 the prevalence of AR may also be underestimated by the confirmable tests of SPTs.
In conclusion, it is clear that factors for a similar prevalence of confirmable AR and a higher prevalence of self-reported AR in rural and urban areas are multiple and complex and that there is not a single explanation or hypothesis yet. As the first study to be conducted specifically for the assessment of adult AR preva- lence in urban and rural areas in Mainland China, this research may provide the basis for further explorations.
Presently, the study has limitations in that the sample size is small and only a limited number of risk factors were evaluated.
Furthermore, it is likely that the self-reporting nature of the study contributed to some selection bias, and despite the best efforts of the investigators to persuade the study subjects to un- dergo SPTs for the confirmation of atopic sensitization, many subjects did not agree to. Thus, future studies would need to in- vestigate larger cohorts using standardised survey forms, more specific allergy tests, and a larger number of risk factors, includ- ing endotoxins, parasites, air pollution, and diet, in an attempt to better understand the prevalence, difference, and relation- ship of confirmable and self-reporting AR in urban and rural areas in Mainland China.
ACKNOWLEDGMENTS
This work was supported by grants from National Science Fund for Distinguished Young Scholars (81025007), Program for Changjiang Scholars and Innovative Research Team in Uni- versity (IRT13082), The twelfth five year science and technology support program of the Ministry of Science and Technology (2014BAI07B04), National Natural Science Foundation of Chi- na (81100704), Beijing Natural Science Foundation (7131006), the Special Fund of Sanitation Elite Reconstruction of Beijing (2009-2-007), the development of Healthcare Fund of Beijing (2011-1017-06), Ministry of Health Foundation (201202005), and Beijing Science and Technology program (Z121107009212032) to LZ.
REFERENCES
1. Bousquet J, Khaltaev N, Cruz AA, Denburg J, Fokkens WJ, Togias A, et al. Allergic Rhinitis and its Impact on Asthma (ARIA) 2008 up- date (in collaboration with the World Health Organization, GA(2) LEN and AllerGen). Allergy 2008;63 Suppl 86:8-160.
2. Bousquet PJ, Leynaert B, Neukirch F, Sunyer J, Janson CM, Anto J, et al. Geographical distribution of atopic rhinitis in the European Community Respiratory Health Survey I. Allergy 2008;63:1301-9.
3. Katelaris CH, Lee BW, Potter PC, Maspero JF, Cingi C, Lopatin A, et al. Prevalence and diversity of allergic rhinitis in regions of the world beyond Europe and North America. Clin Exp Allergy 2012;
42:186-207.
4. Worldwide variation in prevalence of symptoms of asthma, allergic rhinoconjunctivitis, and atopic eczema: ISAAC. The International Study of Asthma and Allergies in Childhood (ISAAC) Steering Com- mittee. Lancet 1998;351:1225-32.
5. Zhang L, Han D, Huang D, Wu Y, Dong Z, Xu G, et al. Prevalence of self-reported allergic rhinitis in eleven major cities in China. Int Arch Allergy Immunol 2009;149:47-57.
6. Kong WJ, Chen JJ, Zheng ZY, Shi QM, Zhou Y. Prevalence of allergic rhinitis in 3-6-year-old children in Wuhan of China. Clin Exp Aller- gy 2009;39:869-74.
7. Zacharasiewicz A, Douwes J, Pearce N. What proportion of rhinitis symptoms is attributable to atopy? J Clin Epidemiol 2003;56:385- 90.
8. Bousquet J, Van Cauwenberge P, Khaltaev N; Aria Workshop Group; World Health Organization. Allergic rhinitis and its impact on asthma. J Allergy Clin Immunol 2001;108:S147-334.
9. Aas K, Belin L. Standardization of diagnostic work in allergy. Int Arch Allergy Appl Immunol 1973;45:57-60.
10. Nathan RA, Meltzer EO, Derebery J, Campbell UB, Stang PE, Corrao MA, et al. The prevalence of nasal symptoms attributed to allergies in the United States: findings from the burden of rhinitis in an America survey. Allergy Asthma Proc 2008;29:600-8.
11. Tomassen P, Newson RB, Hoffmans R, Lötvall J, Cardell LO, Gunn- björnsdóttir M, et al. Reliability of EP3OS symptom criteria and na- sal endoscopy in the assessment of chronic rhinosinusitis--a GA2 LEN study. Allergy 2011;66:556-61.
12. Dennis RJ, Caraballo L, García E, Rojas MX, Rondon MA, Pérez A, et al. Prevalence of asthma and other allergic conditions in Colom- bia 2009-2010: a cross-sectional study. BMC Pulm Med 2012;12:17.
13. Desalu OO, Salami AK, Iseh KR, Oluboyo PO. Prevalence of self re- ported allergic rhinitis and its relationship with asthma among adult Nigerians. J Investig Allergol Clin Immunol 2009;19:474-80.
14. Liu Z, Albanese E, Li S, Huang Y, Ferri CP, Yan F, et al. Chronic dis- ease prevalence and care among the elderly in urban and rural Beijing, China - a 10/66 Dementia Research Group cross-sectional survey. BMC Public Health 2009;9:394.
15. Soto-Quiros ME, Silverman EK, Hanson LA, Weiss ST, Celedón JC.
Maternal history, sensitization to allergens, and current wheezing, rhinitis, and eczema among children in Costa Rica. Pediatr Pulm- onol 2002;33:237-43.
16. Crockett AJ, Cranston JM, Alpers JH. The changing prevalence of asthma-like respiratory symptoms in South Australian rural schoolchildren. J Paediatr Child Health 1995;31:213-7.
17. Nicolaou N, Siddique N, Custovic A. Allergic disease in urban and rural populations: increasing prevalence with increasing urbaniza- tion. Allergy 2005;60:1357-60.
18. Viinanen A, Munhbayarlah S, Zevgee T, Narantsetseg L, Naidans- uren T, Koskenvuo M, et al. Prevalence of asthma, allergic rhino- conjunctivitis and allergic sensitization in Mongolia. Allergy 2005;
60:1370-7.
19. von Mutius E, Martinez FD, Fritzsch C, Nicolai T, Roell G, Thiemann HH. Prevalence of asthma and atopy in two areas of West and East Germany. Am J Respir Crit Care Med 1994;149:358-64.
20. Heinrich J, Richter K, Magnussen H, Wichmann HE. Is the preva- lence of atopic diseases in East and West Germany already con- verging? Eur J Epidemiol 1998;14:239-45.
21. Kim YK, Chang YS, Lee MH, Hong SC, Bae JM, Jee YK, et al. Role of environmental exposure to spider mites in the sensitization and the
clinical manifestation of asthma and rhinitis in children and ado- lescents living in rural and urban areas. Clin Exp Allergy 2002;32:
1305-9.
22. Graif Y, Garty BZ, Livne I, Green MS, Shohat T. Prevalence and risk factors for allergic rhinitis and atopic eczema among schoolchil- dren in Israel: results from a national study. Ann Allergy Asthma Immunol 2004;92:245-9.
23. Majkowska-Wojciechowska B, Pełka J, Korzon L, Kozłowska A, Kaczała M, Jarzebska M, et al. Prevalence of allergy, patterns of al- lergic sensitization and allergy risk factors in rural and urban chil- dren. Allergy 2007;62:1044-50.
24. Guner SN, Gokturk B, Kilic M, Ozkiraz S. The prevalences of aller- gic diseases in rural and urban areas are similar. Allergol Immuno- pathol (Madr) 2011;39:140-4.
25. Abong JM, Kwong SL, Alava HD, Castor MA, De Leon JC. Preva- lence of allergic rhinitis in Filipino adults based on the National Nutrition and Health Survey 2008. Asia Pac Allergy 2012;2:129-35.
26. Rona RJ. Asthma and poverty. Thorax 2000;55:239-44.
27. Bråbäck L, Hjern A, Rasmussen F. Social class in asthma and aller- gic rhinitis: a national cohort study over three decades. Eur Respir J 2005;26:1064-8.
28. Blanc PD, Yen IH, Chen H, Katz PP, Earnest G, Balmes JR, et al. Ar-
ea-level socio-economic status and health status among adults with asthma and rhinitis. Eur Respir J 2006;27:85-94.
29. Devereux G, Seaton A. Diet as a risk factor for atopy and asthma. J Allergy Clin Immunol 2005;115:1109-17.
30. Valet RS, Perry TT, Hartert TV. Rural health disparities in asthma care and outcomes. J Allergy Clin Immunol 2009;123:1220-5.
31. Zhang L, Wei JM, Han DM. Current state of diagnosis and treat- ment of allergic rhinitis in China. Zhonghua Er Bi Yan Hou Tou Jing Wai Ke Za Zhi 2010;45:420-3.
32. Bachert C. Persistent rhinitis - allergic or nonallergic? Allergy 2004;
59 Suppl 76:11-5.
33. Mpairwe H, Muhangi L, Ndibazza J, Tumusiime J, Muwanga M, Rodrigues LC, et al. Skin prick test reactivity to common allergens among women in Entebbe, Uganda. Trans R Soc Trop Med Hyg 2008;102:367-73.
34. Bousquet PJ, Hooper R, Kogevinas M, Jarvis D, Burney P. Number of allergens to be tested to assess allergenic sensitization in epide- miologic studies: results of the European Community Respiratory Health Survey I. Clin Exp Allergy 2007;37:780-7.
35. Forester JP, Calabria CW. Local production of IgE in the respiratory mucosa and the concept of entopy: does allergy exist in nonallergic rhinitis? Ann Allergy Asthma Immunol 2010;105:249-55.