© 2013 The Korean Academy of Medical Sciences.
This is an Open Access article distributed under the terms of the Creative Commons Attribution Non-Commercial License (http://creativecommons.org/licenses/by-nc/3.0) which permits unrestricted non-commercial use, distribution, and reproduction in any medium, provided the original work is properly cited.
pISSN 1011-8934 eISSN 1598-6357
Patients with Persistent New-Onset Diabetes after
Transplantation Have Greater Weight Gain after Kidney Transplantation
The purpose of the present study was to evaluate the difference in BMI pattern between patients with persistent new-onset diabetes after transplantation (P-NODAT) and without new-onset diabetes after transplantation (N-NODAT) in a retrospective matched case- control (1:3) analysis. Thirty-six patients who developed P-NODAT were identified among 186 adult renal transplant recipients with no evidence of pretransplant diabetes mellitus who underwent kidney transplantation from September 1997 to March 2008 and were treated with a triple regimen including tacrolimus. The controls were selected to match the patients for pretransplant BMI, age at transplantation ( ± 5 yr), and date of transplantation (± 12 months). Finally, 20 P-NODAT patients and 60 N-NODAT patients were selected. The pre- and posttransplant BMI data were collected every 16 weeks for up to 80 weeks. The clinical characteristics did not differ between the P-NODAT group and N-NODAT group.
BMI increased faster in the P-NODAT group than in the N-NODAT group. The mixed-model analysis showed that patients with P-NODAT exhibited a faster increase in BMI. P-NODAT is associated with posttransplant weight gain. The risk of P-NODAT should be considered in patients with rapid weight gain after transplantation.
Key Words: Transplantation; Diabetes Mellitus; Obesity Yoonjung Kim,1* Jung-Ryul Kim,2*
Heejung Choi,3 Jung-won Hwang,4 Hye Ryoun Jang,1 Jung Eun Lee,1 Sung-Joo Kim,5 Yoon-Goo Kim,1 Dae Joong Kim,1 Ha Young Oh,1 and Wooseong Huh1,2
1Department of Medicine, and 2Department of Clinical Pharmacology and Therapeutics, Samsung Medical Center, Sungkyunkwan University School of Medicine, Seoul; 3Department of Medicine, Konkuk University Chungju Hospital, Chungju; 4Department of Anesthesiology and Pain Medicine, Seoul National University Bundang Hospital, Seongnam;
5Department of Surgery, Samsung Medical Center, Sungkyunkwan University School of Medicine, Seoul, Korea
*Yoonjung Kim and Jung-Ryul Kim contributed equally to this work.
Received: 17 June 2013 Accepted: 19 August 2013 Address for Correspondence:
Wooseong Huh, MD
Department of Medicine, Samsung Medical Center, Sungkyunkwan University School of Medicine, 81 Irwon-ro, Gangnam-gu, Seoul 135-710, Korea
Tel: +82.2-3410-3443, Fax: +82.2-3410-0064 E-mail: wooseong.huh@samsung.com
This work was supported by IN-SUNG Foundation for Medical Research, Seoul, Korea.
http://dx.doi.org/10.3346/jkms.2013.28.10.1431 • J Korean Med Sci 2013; 28: 1431-1434
ORIGINAL ARTICLE
Cell Therapy & Organ Transplantation
INTRODUCTION
Pretransplant obesity is a well-known risk factor for posttrans- plant outcomes such as patient and graft survival, delayed graft function, rejection, and wound complications (1-5). Several re- cent studies have shown that significant posttransplant weight gain is also a risk factor for patient and graft survival (6-10). Iden- tifying patients at high risk of significant posttransplant weight gain and using various methods to help control their body wei- ght may improve patient and graft survival. The relationship between new-onset diabetes after transplantation (NODAT) and posttransplant weight gain remains undetermined (10-12).
However, persistent NODAT (P-NODAT) may be associated with posttransplant weight gain.
To determine whether weight gain after transplantation is as-
sociated with P-NODAT, we measured the changes in BMI in patients with P-NODAT and in those who did not develop dia- betes mellitus (N-NODAT).
MATERIALS AND METHODS Study design and population
This study was a retrospective matched case-control (1:3) study.
One hundred eighty-six consecutive patients who received a kidney transplant at Samsung Medical Center, Seoul, Korea, between September 1997 and March 2008 were enrolled. The inclusion criteria were: 1) patients who were treated with tacro- limus, mycophenolate mofetil, and steroids; 2) patients 18 yr of age or older at the time of transplantation; and 3) patients who survived with no graft loss for at least 2 yr. The exclusion criteria
Kim Y, et al. • Weight Gain after Kidney Transplantation
1432 http://jkms.org http://dx.doi.org/10.3346/jkms.2013.28.10.1431 were: 1) the presence of diabetes mellitus (DM) before trans-
plantation; and 2) receipt of multiorgan transplantation. Pa- tients were classified into three groups: P-NODAT, transient NODAT, and N-NODAT. NODAT was defined according to the 2003 International Consensus Guidelines for NODAT as a fast- ing blood glucose level of 126 mg/dL or greater confirmed by repeated testing on a different day (13). P-NODAT was defined as DM that persisted for the duration of the follow-up period (median 150 weeks, range 58-484 weeks); transient-NODAT was defined as DM that recovered to normal glucose tolerance within 1 yr (median 20 weeks, range 4-32 weeks); N-NODAT was defined as the absence of DM during the follow-up period.
Of the 186 patients, 36 were classified as having P-NODAT, 11 as having transient NODAT, and 139 as having N-NODAT.
We focused on the differences in the change in BMI for 2 yr after kidney transplantation. We compared the change in BMI between patients with P-NODAT and N-NODAT. Twenty of the 36 patients with P-NODAT and 60 matched patients with N- NODAT were included. The matching criteria were baseline BMI, age at transplantation (± 5 yr), and date of transplantation ( ± 12 months). The following clinical characteristics at the time of transplantation were recorded: source of the organ (living or deceased donor), age and sex of the donor and recipient, pres- ence of hepatitis C virus (HCV) antibodies, family history of DM, total cholesterol, and triglycerides. The following variables were reviewed after transplantation: acute rejection episodes, cytomegalovirus (CMV) infection, tacrolimus blood trough lev- els for the first 1 yr, total steroid amount administered for the first 24 weeks, creatinine at 1 yr, and comorbid conditions in- cluding hypertension, cardiovascular disease, cerebrovascular disease, malignancy and infection episodes which need hospi- talization. Posttransplant BMI was calculated every 16 weeks for up to 80 weeks.
Statistical analysis
Continuous variables are expressed as mean ± standard devia- tion (SD). Categorical variables are described as counts and percentages. The chi-square test was used to examine the dif- ferences in categorical data and the independent t test and the Mann-Whitney U test were used to analyze the differences in continuous values between groups. The change in BMI over time was analyzed using a linear mixed-effect model. We con- sidered the time at which BMI was measured as the repeated- measures factor. Because there was a strong tendency for mea- surements on the same patient recorded closer in time to be more highly associated than measurements made further apart in time, a first-order antedependence covariance structure was selected. Statistical analysis was performed using SPSS software version 18.0 (IBM, NY, USA) and differences at P < 0.05 were considered significant.
Ethics statement
This study was approved by the institutional review board of Samsung Medical Center (SMCIRB 2010-03-020). Informed consent was exempted by the board.
RESULTS
Clinical characteristics
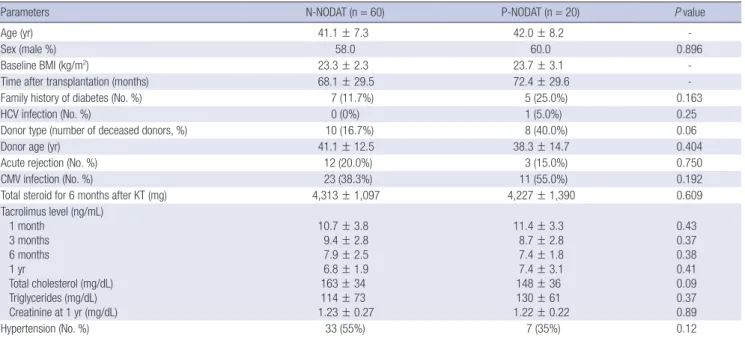
The mean age of the study cohort at the time of transplantation was 41.3 ± 7.5 yr and 47 (58.8%) were men. The duration of fol- low-up was 68.2 ± 29.4 months. The pretransplant BMI was 23.4 ± 2.5 kg/m2. Of the 20 patients with P-NODAT, 13 patients were diagnosed with NODAT within 1 yr after kidney transplan- tation, and 7 patients were diagnosed after 1 yr of kidney trans- plantation. Two patients were treated with insulin, and 16 pa- tients received oral hypoglycemic agents. Table 1 presents the clinical characteristics of the N-NODAT and P-NODAT groups.
There were no significant differences in sex, family history of DM, HCV infection, donor age, donor type, acute rejection rate, CMV infection, total steroid amount administered for 24 weeks after kidney transplant, trough levels of tacrolimus at 1, 3, 6 mon- ths and 1 yr, total cholesterol, triglycerides, creatinine at 1 yr, and hypertension after transplantation. Target trough level of tacrolimus in our center is 10-12 ng/mL for the first month after kidney transplantation, 8-10 ng/mL for months 2 and 3, and 5-8 ng/mL after 3 months. We found 35 comorbid conditions among 31 patients: 24 events (1 cerebrovascular, 3 malignancy and 20 infections) in the control group and 11 events (1 cerebrovascu- lar, 1 malignancy and 9 infections) in the P-NODAT group. Car- diovascular disease did not occur in the study period. There is no significant difference in total steroid dose for 6 months and tacrolimus level at 1, 3, 6, and 12 months between living and deceased donor kidney transplantation.
Change in BMI
The mixed-model analysis showed that BMI increased steadily over the 80 weeks (P < 0.001, Table 2) and that baseline BMI was a significant covariate (P < 0.001). P-NODAT had a signifi- cant effect on the increase in BMI over time (P < 0.001). BMI increased faster in the P-NODAT group than in the N-NODAT group (Fig. 1). BMI did not differ significantly between patients with and without acute rejection (P = 0.287); however, the three- way interaction of time, P-NODAT, and rejection was significant (P = 0.014), indicating that the linear trend over time for BMI in the P-NODAT group differed in patients experiencing acute re- jection. However, donor age, donor type, sex, family history of DM, and total steroid amount administered were not signifi- cant covariates (P = 0.081, 0.949, 0.715, 0.125, and 0.925, respec- tively).
Kim Y, et al. • Weight Gain after Kidney Transplantation
http://jkms.org 1433
http://dx.doi.org/10.3346/jkms.2013.28.10.1431
DISCUSSION
Because we had a small longitudinal dataset and wanted to find other factors that influence weight gain, a linear mixed effect model was chosen as a statistical method (14). This study showed that BMI after kidney transplantation increased faster in the P- NODAT group than in the N-NODAT group. Although patients with higher baseline BMI had higher weight gain regardless who developed P-NODAT or not, P-NODAT had a significant effect on the increase in BMI over time independently.
Many previous studies revealed that baseline BMI, age at trans- plantation, and date of transplantation were strong risk factors for NODAT. Cosio et al. (11) showed that older age (RR, 2.2, P <
0.0001), higher body weight at transplant (RR, 1.4, P < 0.0001), and transplant year (RR, 1.7, P = 0.003) were correlated with the development of NODAT by multivariate analysis. We believed that one of the reasons for previous negative studies regarding the association between weight gain after transplantation and P-NODAT was interference of those strong risk factors. To re-
duce the effect of strong confounding variables in our analysis, baseline BMI, age at transplantation, and date of transplanta- tion were adopted as matching criteria in this study. Weight gain occurs after transplantation in most posttransplant patients.
The weight gain might reflect the disappearance of uremia, res- toration of well-being, lack of physical activity and use of im- munosuppressant medications after transplantation (15-17).
Chang and McDonald (6) showed that a weight gain of ≥ 20%
in the first posttransplant year was associated with poor surviv- al outcomes and that 9% of their study population were in this category. They also found that weight loss was a risk factor for poor survival outcomes. Therefore, it is important to identify patients at high risk for significant weight gain after kidney trans- plantation. To our knowledge, only few studies have evaluated Table 1. Clinical characteristics
Parameters N-NODAT (n = 60) P-NODAT (n = 20) P value
Age (yr) 41.1 ± 7.3 42.0 ± 8.2 -
Sex (male %) 58.0 60.0 0.896
Baseline BMI (kg/m2) 23.3 ± 2.3 23.7 ± 3.1 -
Time after transplantation (months) 68.1 ± 29.5 72.4 ± 29.6 -
Family history of diabetes (No. %) 7 (11.7%) 5 (25.0%) 0.163
HCV infection (No. %) 0 (0%) 1 (5.0%) 0.25
Donor type (number of deceased donors, %) 10 (16.7%) 8 (40.0%) 0.06
Donor age (yr) 41.1 ± 12.5 38.3 ± 14.7 0.404
Acute rejection (No. %) 12 (20.0%) 3 (15.0%) 0.750
CMV infection (No. %) 23 (38.3%) 11 (55.0%) 0.192
Total steroid for 6 months after KT (mg) 4,313 ± 1,097 4,227 ± 1,390 0.609
Tacrolimus level (ng/mL) 1 month
3 months 6 months 1 yr
Total cholesterol (mg/dL) Triglycerides (mg/dL) Creatinine at 1 yr (mg/dL)
10.7 ± 3.8 9.4 ± 2.8 7.9 ± 2.5 6.8 ± 1.9 163 ± 34 114 ± 73 1.23 ± 0.27
11.4 ± 3.3 8.7 ± 2.8 7.4 ± 1.8 7.4 ± 3.1 148 ± 36 130 ± 61 1.22 ± 0.22
0.43 0.37 0.38 0.41 0.09 0.37 0.89
Hypertension (No. %) 33 (55%) 7 (35%) 0.12
Data are expressed as mean ± SD or number (%). P-NODAT, persistent new-onset diabetes after transplantation; N-NODAT, non-new onset diabetes after transplantation; BMI, body mass index; HCV, hepatitis C virus; CMV, cytomegalovirus; KT, kidney transplantation.
Table 2. Results of the linear mixed-model analysis
Source of variation F value P value
Baseline BMI 153.85 < 0.001
Time 14.70 < 0.001
Time × P-NODAT 6.27 < 0.001
Time × rejection 1.26 0.287
Time × P-NODAT × rejection 3.22 0.014
P-NODAT 4.569 < 0.001
Rejection 9.130 0.001
P-NODAT × rejection 0.849 0.004
BMI, body mass index; P-NODAT, persistent new-onset diabetes after transplantation.
Fig. 1. Estimated marginal means for BMI over time analyzed according to the pres- ence or absence of P-NODAT (adjusted for baseline BMI of 23.384 kg/m2). Bars rep- resent standard errors.
Body mass index (kg/m2)
Week
16 32 48 64 80 0.098 0.003 < 0.001 < 0.001 < 0.001 26
25 24 23 22
21 P value (without vs with P-NODAT)
Without P-NODAT (n = 60) With P-NODAT (n = 20)
Kim Y, et al. • Weight Gain after Kidney Transplantation
1434 http://jkms.org http://dx.doi.org/10.3346/jkms.2013.28.10.1431 the risk factors associated with weight change (6, 9, 18). Chang
and McDonald (6) demonstrated that age, sex, the presence of DM and cardiovascular disease at the start of renal replacement therapy, and baseline BMI were associated with significant post- transplant weight change. In the present study, baseline BMI was a significant covariate for BMI change. After adjusting for baseline BMI, the association between P-NODAT and a rapid increase in BMI remained significant. Patients with P-NODAT take insulin or hypoglycemic agents for a long time, and several hypoglycemic agents and insulin have weight gain as a side ef- fect (19). Therefore, we considered that P-NODAT was associat- ed with posttransplant weight gain. Weight control after trans- plantation could prevent the development of P-NODAT, but it has not yet been determined how much weight reduction is safe and who needs to lose weight. Chang and McDonald (6) reported that weight loss more than 5% was also associated with higher mortality in year 1 and 2 after kidney transplanta- tion. Maintaining stable weight and weight gain less than 20%
might be safe and helpful to prevent the development of NO- DAT. We observed that patients with P-NODAT and acute rejec- tion had a faster increase in BMI, whereas the change in BMI did not differ between patients with and without acute rejection.
High-dose steroid treatment for acute rejection may have a syn- ergistic influence on the weight gain associated with P-NODAT.
Although this finding came from the mixed effect model analy- sis, only 3 patients were observed. Therefore we cannot con- clude that P-NODAT and acute rejection have synergistic effect on posttransplant weight gain. Further investigation of the com- bined effect of P-NODAT and acute rejection on BMI after trans- plantation is required.
In addition, this study was a retrospective case-control study, which might have included selection bias, and the sample size was small. Prospective studies and a large number of cases are needed.
In conclusion, P-NODAT as well as baseline BMI is associated with posttransplant weight gain. The risk of P-NODAT should be considered in patients with rapid weight gain after transplantation.
DISCLOSURE
The authors have no conflicts of interest to disclose.
REFERENCES
1. Meier-Kriesche HU, Arndorfer JA, Kaplan B. The impact of body mass index on renal transplant outcomes: a significant independent risk fac- tor for graft failure and patient death. Transplantation 2002; 73: 70-4.
2. Aalten J, Christiaans MH, de Fijter H, Hené R, van der Heijde JH, Rood- nat J, Surachno J, Hoitsma A. The influence of obesity on short- and long- term graft and patient survival after renal transplantation. Transpl Int 2006; 19: 901-7.
3. Papalia T, Greco R, Lofaro D, Maestripieri S, Mancuso D, Bonofiglio R.
Impact of body mass index on graft loss in normal and overweight pa- tients: retrospective analysis of 206 renal transplants. Clin Transplant 2010; 24: E241-6.
4. Gore JL, Pham PT, Danovitch GM, Wilkinson AH, Rosenthal JT, Lip- shutz GS, Singer JS. Obesity and outcome following renal transplanta- tion. Am J Transplant 2006; 6: 357-63.
5. Grosso G, Corona D, Mistretta A, Zerbo D, Sinagra N, Giaquinta A, Ca- glià P, Amodeo C, Leonardi A, Gula R, et al. The role of obesity in kidney transplantation outcome. Transplant Proc 2012; 44: 1864-8.
6. Chang SH, McDonald SP. Post-kidney transplant weight change as mark- er of poor survival outcomes. Transplantation 2008; 85: 1443-8.
7. Hoogeveen EK, Aalten J, Rothman KJ, Roodnat JI, Mallat MJ, Borm G, Weimar W, Hoitsma AJ, de Fijter JW. Effect of obesity on the outcome of kidney transplantation: a 20-year follow-up. Transplantation 2011; 91:
869-74.
8. Ducloux D, Kazory A, Simula-Faivre D, Chalopin JM. One-year post- transplant weight gain is a risk factor for graft loss. Am J Transplant 2005;
5: 2922-8.
9. Díaz JM, Sainz Z, Oliver A, Guirado LI, Facundo C, García-Maset R, Solà R. Post- renal transplantation weight gain: its causes and its consequenc- es. Transplant Proc 2005; 37: 3839-41.
10. El-Agroudy AE, Wafa EW, Gheith OE, Shehab el-Dein AB, Ghoneim MA. Weight gain after renal transplantation is a risk factor for patient and graft outcome. Transplantation 2004; 77: 1381-5.
11. Cosio FG, Pesavento TE, Osei K, Henry ML, Ferguson RM. Post-trans- plant diabetes mellitus: increasing incidence in renal allograft recipients transplanted in recent years. Kidney Int 2001; 59: 732-7.
12. Marrero D, Hernandez D, Tamajón LP, Rivero M, Lampreabe I, Checa MD, Gonzalez-Posada JM; for the Spanish Late Allograft Dysfunction Study Group. Pre-transplant weight but not weight gain is associated with new-onset diabetes after transplantation: a multi-centre cohort Spanish study. NDT Plus 2010; 3: ii15-20.
13. Davidson J, Wilkinson A, Dantal J, Dotta F, Haller H, Hernández D, Ka- siske BL, Kiberd B, Krentz A, Legendre C, et al. New-onset diabetes after transplantation: 2003 international consensus guidelines: proceedings of an international expert panel meeting: Barcelona, Spain, 19 February 2003. Transplantation 2003; 75: SS3-24.
14. Wainwright PE, Leatherdale ST, Dubin JA. Advantages of mixed effects models over traditional ANOVA models in developmental studies: a work- ed example in a mouse model of fetal alcohol syndrome. Dev Psychobiol 2007; 49: 664-74.
15. Jezior D, Krajewska M, Madziarska K, Kurc-Darak B, Jańczak D, Patrzałek D, Borysławski K, Klinger M. Posttransplant overweight and obesity:
myth or reality? Transplant Proc 2007; 39: 2772-5.
16. Pirsch JD. Weight gain after kidney transplantation: weigh too much!
Transplantation 2008; 85: 1387-8.
17. Han SS, Hwang JH, Oh YJ, Cha RH, Ahn C, Kim YS. Change in body com- positions of Asian recipients after kidney transplantation. J Korean Med Sci 2012; 27: 1182-7.
18. Friedman AN, Miskulin DC, Rosenberg IH, Levey AS. Demographics and trends in overweight and obesity in patients at time of kidney trans- plantation. Am J Kidney Dis 2003; 41: 480-7.
19. Campbell IW. Comparing the actions of older and newer therapies on body weight: to what extent should these effects guide the selection of an- tidiabetic therapy? Int J Clin Pract 2010; 64: 791-801.