How Many Valid Measurements Are Necessary to Assess Liver Fibrosis Using FibroScan ® in Patients with Chronic Viral Hepatitis?
An Analysis of Subjects with at Least 10 Valid Measurements
Hui Won Jang,
1* Seung Up Kim,
1,2,5* Jun Yong Park,
1,2,5Sang Hoon Ahn,
1,2,5,6Kwang-Hyub Han,
1,2,5,6Chae Yoon Chon,
1,2,5Young Nyun Park,
4,5,6Eun Hee Choi,
3and Do Young Kim
1,2,5Departments of 1Internal Medicine, 2Institute of Gastroenterology, 3Biostatistics, and 4Pathology, Yonsei University College of Medicine, Seoul;
5Liver Cirrhosis Clinical Research Center, Seoul; 6Brain Korea 21 Project for Medical Science, Seoul, Korea.
Received: May 3, 2011 Revised: July 5, 2011 Accepted: July 11, 2011
Corresponding author: Dr. Do Young Kim, Department of Internal Medicine, Yonsei University College of Medicine, 50 Yonsei-ro, Seodaemun-gu, Seoul 120-752, Korea.
Tel: 82-2-2228-1992, Fax: 82-2-393-6884 E-mail: [email protected]
*Hui Won Jang and Seung Up Kim contributed equally to this work.
∙ The authors have no financial conflicts of interest.
© Copyright:
Yonsei University College of Medicine 2012 This is an Open Access article distributed under the terms of the Creative Commons Attribution Non- Commercial License (http://creativecommons.org/
licenses/by-nc/3.0) which permits unrestricted non- commercial use, distribution, and reproduction in any medium, provided the original work is properly cited.
Purpose: Using FibroScan® to obtain a reliable liver stiffness measurement (LSM) may require more than 10 valid measurements (VMs), according to the manufacturer’s recommendations. However, this requirement lacks scientific evi- dence in support thereof. We investigated the minimal number of VMs required to assess liver fibrosis without significant loss of accuracy in patients with chronic hepatitis B (CHB) and C (CHC) and predictors of discordance between LSM and liver biopsy (LB). Materials and Methods: Between January 2005 and Decem- ber 2009, we prospectively enrolled 182 patients with CHB and 68 patients with CHC who were to undergo LB and LSM before starting antiviral treatment. Only LSMs with at least 10 VMs were considered reliable. The Batts and Ludwig scor- ing system was used for histologic assessment. Results: The mean age and body mass index were 46.0 years and 23.4 kg/m2 in patients with CHB and 49.7 years and 23.1 kg/m2 in those with CHC, respectively. The median elasticity scores from the first 3, first 5, and all VMs taken significantly predicted fibrosis stages
≥F2 and F4 (all p<0.05) without significant differences (all p>0.05 by DeLong’s method). Alanine aminotransferase (ALT) was the only predictor of discordance in fibrosis stage as estimated by the median elasticity score from the first 3 VMs and by LB in patients with CHB, whereas no significant predictor was identified in those with CHC. Conclusion: After comparison of patients who had more than 10 valid measurements for LSM, three VMs may be enough to assess liver fibro- sis using LSM without significant loss of accuracy in patients with CHC and pa- tients with CHB. However, ALT should be considered when interpreting LSM for patients with CHB.
Key Words: Chronic viral hepatitis, chronic hepatitis B, chronic hepatitis C, fi- broscan, liver stiffness measurement, transient elastography
INTRODUCTION
Liver stiffness measurement (LSM) using FibroScan® has been considered as a rap-
(75.8%) patients received LSM on the same day as LB, while 67 patients (24.2%) received LSM shortly before LB (median, 6 days; range, 2-10).
Exclusion criteria were as follows: 1) evidence of decom- pensated liver cirrhosis, such as a history of variceal bleed- ing, ascites, hepatic encephalopathy, or Child-Pugh class B/
C at the time of LSM;11 2) previous history of antiviral treat- ment; 3) coexisting hepatocellular carcinoma; 4) coinfec- tion with hepatitis D or human immunodeficiency virus; 5) alcohol ingestion in excess of 20 g/day for men and 30 g/
day for women in excess of 5 years; 6) insufficient LB quality (LB length <15 mm);12 7) fewer than 10 VMs (n=9);
8) LSM failure (no valid shot, n=1); and 9) right-sided heart failure.13 By these criteria, we excluded 27 patients (8 pa- tients with fewer than 10 VMs, 16 with insufficient LB quality, 1 with hepatocellular carcinoma, 1 with LSM fail- ure due to ascites, and 1 with fewer than 10 VMs and insuf- ficient LB quality) and enrolled 250 for final analysis (182 with CHB and 68 with CHC). The characteristics of the pa- tients excluded are shown in Table 1. There were no differ- ences in baseline characteristics between the 182 enrolled patients and the 9 patients excluded due to fewer than 10 VMs (all p>0.05). Among the 9 patients with fewer than 10 VMs, 7 patients had 3-9 VMs and 5 (71.4%) out of these 7 patients showed the same fibrosis grade as assessed by LSM and LB. Forty IU/mL was defined as the upper limit of normal (ULN) of alanine aminotransferase (ALT).
The study protocol complied with ethical guidelines of the 1975 Declaration of Helsinki. Each participant or a re- sponsible family member gave their written informed con- sent after the possible complications of LB had been fully explained. The independent institutional review board of our institute (Severance Hospital) approved this study.
Liver stiffness measurement
LSM using FibroScan® generates an elastic wave using a vi- brator applied to the intercostal spaces at the level of the right lobe of the liver and measures the propagation velocity of the shear wave, which is directly related to liver stiffness.14 In the present study, a single experienced operator, who was blind- ed to patients’ clinical data and LB results, performed all LSMs. Success rate was calculated as the number of VMs di- vided by the total number of measurements. Liver stiffness was expressed in kilopascals (kPa). IQR was defined as an index of intrinsic variability of LSM corresponding to the in- terval of LSM results containing 50% of the valid measure- ments between the 25th and 75th percentiles. The median id and noninvasive method to assess liver fibrosis in patients
with chronic hepatitis B (CHB) and chronic hepatitis C (CHC).1-3 Results to date show that LSM can help physi- cians decide treatment strategies, predict prognosis, and monitor disease progression or regression in patients with chronic liver disease.4 Although LSM is generally reliable, three conditions are recommended by the manufacturer to ensure its reliability: more than 10 valid measurements (VMs), successful measurements in more than 60% of all measurements taken,1,2 and an interquartile range/median value (IQR/M) less than 0.3.5,6 However, the manufacturer’s recommendations are not based on scientific evidence, and recent studies have challenged the influence of these param- eters on LSM accuracy.7-9
Although the influences of success rate and IQR/M on LSM accuracy have been tested in several previous stud- ies,7,8,10 the optimal number of VMs has not been elucidat- ed. Accordingly, if fewer than 10 VMs were sufficient for a reliable LSM, and if the currently recommended number of VM (more than 10) was overestimated, then some LSM re- sults based on fewer than 10 VMs might have been discard- ed, even though they accurately reflected the status of liver fibrosis. Furthermore, repeated trials to obtain more than 10 VMs might decrease the overall success rate due to accumu- lation of unsuccessful measurements, causing these LSM re- sults might have been needlessly discarded as well. There- fore, uncertainty with the optimal number of VMs may limit further application of LSM and deprive some patients of the benefits this noninvasive device provides in diagnos- ing significant liver diseases.
Hence, we investigated the minimal number of VMs re- quired to assess liver fibrosis without significant loss of ac- curacy in patients with either CHB or CHC and the predic- tors of discordance between LSM and liver biopsy (LB).
MATERIALS AND METHODS
Patients
Between January 2005 and December 2009, we enrolled 206 consecutive patients with CHB and 71 patients with CHC who were to undergo LB and LSM before starting antiviral treatment. We defined CHB by the presence of de- tectable hepatitis B virus surface antigen for more than 6 months and the presence of HBV DNA, and we defined CHC by the presence of detectable serum anti-hepatitis C virus antibodies and HCV RNA. Two hundred and ten
Asian studies which reported on the performance of LSM in patients with CHB,20,21 choosing the LSM cutoff values from Chan, et al.20 as a reference because they used a larger sam- ple size (n=161 vs. 88). Since the article by Chan, et al.20 did not include the LSM cutoff value for fibrosis stage ≥F2, we obtained it from them directly.8 Finally, the optimal cutoff LSM values for fibrosis stages ≥F2, ≥F3 and F4 for our study population with CHB were 6.0, 8.4 and 9.0 kPa, respectively.
For patients with CHC, Stebbing, et al.19 reported LSM cutoff values in their meta-analysis of European studies;
however, the value for fibrosis stage ≥F3 was absent. Fur- thermore, the cutoff values in their analysis may potentially be biased with the preponderance of patients with high BMI in the studies included.19 It is plausible that BMI influences LSM cutoff values.6 Thus, we consulted two external stud- ies, conducted in Japan, on the performance of LSM in Asian patients with CHC.22,23 One of these, Takeda, et al.,22 did not provide optimal LSM cutoff values, so we excluded it. We eventually used the cutoff values presented by Nitta, et al.23 as our reference. For our study population with CHC, the optimal LSM cutoff values for fibrosis stages
≥F2, ≥F3, and F4 were 7.1, 9.6, and 11.6 kPa, respectively.
Statistical analysis
The patient characteristics are presented as the mean±standard deviation or n (%) as appropriate. The independent t-test or Mann-Whitney U-test was used for continuous variables, while the χ2 test or Fisher’s exact test was used for categori- cal variables. The performance of LSM in predicting signif- icant fibrosis (≥F2) and cirrhosis (F4) using median elastic- ity scores from the first 3, first 5, and all VMs taken was value was considered representative of the elastic modulus of
the liver. Only LSMs with at least 10 VMs were considered reliable. Any LSM that did not meet these criteria of reliabili- ty was excluded.
Liver histology
LB specimens were fixed in formalin and paraffin-embed- ded. Four-micrometer sections were stained with hematoxy- lin and eosin as well as Masson trichrome. All liver tissue samples were evaluated by an experienced hepatopatholo- gist who was blinded to patients’ clinical data and LSM re- sults. LB specimens shorter than 15 mm were considered unsuitable for fibrosis assessment and were excluded from analysis.
Liver histology was evaluated semiquantitatively using the Batts and Ludwig15 scoring system. Steatosis was cate- gorized by visual assessment as S0 (nonsignificant, <5%), S1 (mild, 5-33%), S2 (moderate, 34-66%), and S3 (severe,
>66% of hepatocytes with fat deposits).16 Selection of reference LSM cutoff values
After establishing a minimal number of VMs required for a reliable LSM, we aimed to identify predictors of discordance in fibrosis stage as estimated by the median elasticity score, which was based on the minimal VM requirement, and by LB. Therefore, we sought external reference cutoff values for LSM from the literature.
We found three meta-analyses on LSM.17-19 However, most studies included in these meta-analyses involved Euro- pean patients with CHC and higher body mass indices (BMI) than found in Asian populations. Thus, we selected two Table 1. Baseline Characteristics
Variables Chronic hepatitis B (n=206) Chronic hepatitis C (n=71)
Enrolled
n=182 (88.3%) Excluded
n=24 (11.7%) p value Enrolled
n=68 (95.8%) Excluded
n=3 (4.2%) p value
Age (yrs) 46.0±11.6 50.8±8.6 0.050 49.7±11.5 58.2±11.1 0.117
Male 123 (67.6) 11 (45.8) 0.015 27 (39.7) 2 (66.7) 0.999
Body mass index (kg/m2) 23.4±2.8 24.2±3.1 0.227 23.1±3.2 24.0±1.5 0.507
Biopsy length (mm) 17.5±2.7 12.1±5.3 <0.001 17.2±2.7 10.6±3.8 <0.001
Albumin (g/dL) 4.3±0.6 3.8±0.6 <0.001 4.4±0.4 4.5±0.3 0.312
Total bilirubin (mg/dL) 0.9±1.2 0.9±0.5 0.952 0.7±0.4 0.8±0.2 0.710
ALT (IU/L) 58.3±64.3 50.8±54.1 0.576 53.2±59.8 53.0±54.1 0.995
Platelet count (103/mm3) 172.0±66.6 314.2±835.5 0.403 201.6±64.5 154.8±54.9 0.119
Prothrombin time (%) 91.9±10.1 87.1±13.7 0.104 97.5±7.0 100 0.419
Spleen size (cm) 10.3±1.8 10.3±1.6 0.966 9.6±1.5 9.7±1.2 0.894
LSM value (kPa) 14.9±12.3 17.3±11.9 0.363 10.4±11.2 8.9±5.5 0.773
ALT, alanine aminotransferase; LSM, liver stiffness measurement; kPa, kilopascal.
Variables are expressed as the mean±SD or n (%).
Baseline LSM data
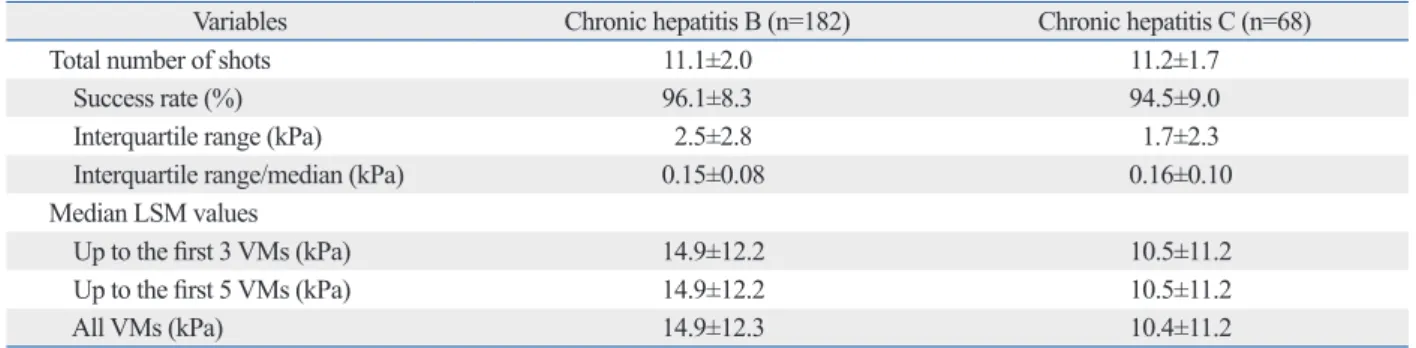
The baseline LSM data are summarized in Table 2. The mean number of VMs acquired was 11.1 in patients with CHB and 11.2 in those with CHC. Patients with CHB and CHC did not differ significantly in the mean of median elasticity scores obtained using the first 3, first 5, and all VMs taken (all p>0.05).
Liver histology and the range of LSM according to fibrosis stage
Distributions of fibrosis stage, activity grade, and steatosis are listed in Table 3. Significant fibrosis (≥F2) was observed in 167 (91.7%) patients with CHB and 46 (67.6%) with CHC. Only two (1.1%) of 182 patients with CHB and two (2.9%) of 68 patients with CHC showed moderate steatosis (S2), whereas most patients (80.2% of CHB and 80.9% of CHC) showed nonsignificant steatosis (S0).
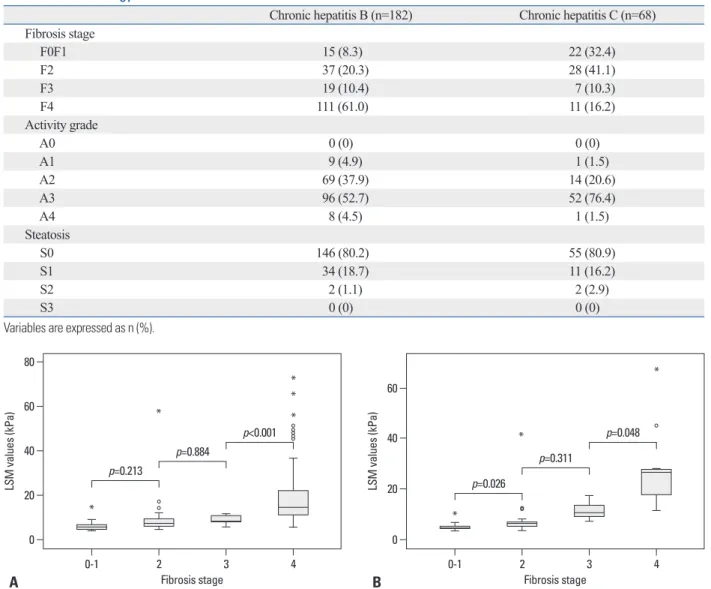
The median LSM values and ranges according to fibrosis stages are shown in Fig. 1. The median LSM value was 5.4 kPa (range, 3.7-15.3) in F0F1 fibrosis stage; 6.8 kPa (range, 4.1-58.2) in F2; 8.1 kPa (range, 5.7-11.8) in F3; and 14.3 kPa (range, 5.1-73.5) in F4 in patients with CHB. LSM values were significantly different between stages F3 and F4 in pa- tients with CHB (p<0.001). In those with CHC, the median LSM value was 4.5 kPa (range, 3.3-10.2) in F0F1; 6.3 kPa (range, 3.5-42.2) in F2; 10.4 kPa (range, 7.1-17.3) in F3; and 26.6 kPa (range, 11.5-67.8) in F4. LSM values were signifi- cantly different between stages F01 and F2 and between stag- es F3 and F4 in patients with CHC (p=0.026 and p=0.048, re- spectively).
Among patients with fibrosis stage F2, one patient with CHB and another one with CHC had extremely high LSM values (58.2 kPa and 42.2 kPa, respectively). Both of these patients had activity grade 4, high ALT (603 IU/L and 187 IU/L, respectively), and total bilirubin levels of 9.2 mg/dL and 2.7 mg/dL, respectively.
assessed using the receiver operating characteristic (ROC) curves and the area under the ROC (AUROC) curve, which is similar to a previous study.9 Performance values were compared using the method presented in DeLong, et al.24 The optimal ALT cutoff values were determined to maxi- mize the sum of sensitivity (Se) and specificity (Sp). As LSM and LB results are too variable to determine small dif- ferences,12 we defined “discordance” as a difference greater than or equal to two fibrosis stages between LB and LSM.
Binary logistic regression analysis was used to identify pre- dictors of discordance in fibrosis stages as estimated by the median elasticity score from the identified minimal number of VMs and by LB. A two-sided p value of less than 0.05 was considered significant. All statistical computations were performed with SPSS software version 12.0 (SPSS Inc., Chicago, IL, USA).
RESULTS
Baseline characteristics
The baseline characteristics of all patients are presented in Table 1. The proportion of males, biopsy length, and serum albumin for the 24 excluded patients with CHB were sig- nificantly lower than the 182 enrolled patients overall (all p<0.05). Among those with CHC, 3 excluded patients dif- fered from the 68 enrolled patients in having only a signifi- cantly smaller biopsy length (p<0.001).
The mean age and BMI of the 182 enrolled patients with CHB were 46.0 years and 23.4 kg/m2 (Table 1), which are similar to those of a previous study by Chan, et al.20 (45 years and 24 kg/m2). In contrast, the mean age and BMI of the 68 enrolled patients with CHC was 49.7 years (median 52, range 18-76) and 23.1 kg/m2. The median age of our study population with CHC was slightly lower than that of a previous study by Nitta, et al.23 (57 years).
Table 2. Baseline LSM Data
Variables Chronic hepatitis B (n=182) Chronic hepatitis C (n=68)
Total number of shots 11.1±2.0 11.2±1.7
Success rate (%) 96.1±8.3 94.5±9.0
Interquartile range (kPa) 2.5±2.8 1.7±2.3
Interquartile range/median (kPa) 0.15±0.08 0.16±0.10
Median LSM values
Up to the first 3 VMs (kPa) 14.9±12.2 10.5±11.2
Up to the first 5 VMs (kPa) 14.9±12.2 10.5±11.2
All VMs (kPa) 14.9±12.3 10.4±11.2
LSM, liver stiffness measurement; VMs, valid measurements; kPa, kilopascal.
Variables are expressed as the mean±SD.
the first 3 VMs taken and by LB (Table 5). Using the LSM cutoff values from Chan, et al.,20 discordances were identi- fied in 28 (15.4%) patients with CHB. Using the cutoff val- ues from Nitta, et al.,23 we found discordance in 4 (5.9%) patients with CHC.
ALT remained as the only independent predictor of discor- dance in patients with CHB [p=0.006; hazard ratio (HR), 1.010; 95% confidence interval (CI), 1.003-1.017], whereas no independent predictor was identified for patients with CHC.
DISCUSSION
LSM is generally considered reliable when more than 10 Performance of LSM in predicting significant fibrosis
(≥F2) and cirrhosis (F4)
Table 4 and Fig. 2 show the diagnostic performance and corresponding ROC curves for predicting fibrosis stages
≥F2 and F4 using LSM. The median elasticity scores from the first 3, first 5, and all VMs taken significantly predicted fibrosis stages ≥F2 and F4 (all p<0.05) and did not differ significantly in AUROC values (all p>0.05).
Predictors of discordance between LSM and LB Since the performance values for predicting fibrosis stages
≥F2 and F4 did not differ using the median elasticity scores from the first 3, first 5, and all VMs taken, we used multi- variate analysis to identify predictors of discordance in fi- brosis stage as estimated by the median elasticity score from Table 3. Liver Histology
Chronic hepatitis B (n=182) Chronic hepatitis C (n=68) Fibrosis stage
F0F1 15 (8.3) 22 (32.4)
F2 37 (20.3) 28 (41.1)
F3 19 (10.4) 7 (10.3)
F4 111 (61.0) 11 (16.2)
Activity grade
A0 0 (0) 0 (0)
A1 9 (4.9) 1 (1.5)
A2 69 (37.9) 14 (20.6)
A3 96 (52.7) 52 (76.4)
A4 8 (4.5) 1 (1.5)
Steatosis
S0 146 (80.2) 55 (80.9)
S1 34 (18.7) 11 (16.2)
S2 2 (1.1) 2 (2.9)
S3 0 (0) 0 (0)
Variables are expressed as n (%).
Fig. 1. Distribution of LSM values according to fibrosis stage in patients with CHB (A) and CHC (B). The median LSM value was 5.4 kPa (range, 3.7-15.3) in fi- brosis stage F0F1; 6.8 kPa (range, 4.1-58.2) in F2; 8.1 kPa (range, 5.7-11.8) in F3; and 14.3 kPa (range, 5.1-73.5) in F4 in patients with CHB. In those with CHC, it was 4.5 kPa (range, 3.3-10.2) in F0F1; 6.3 kPa (range, 3.5-42.2) in F2; 10.4 kPa (range, 7.1-17.3) in F3; and 26.6 kPa (range, 11.5-67.8) in F4. LSM, liver stiffness measurement; CHB, chronic hepatitis B; CHC, chronic hepatitis C; kPa, kilopascal.
0 0
20 20
40 40
60
60 80
LSM values (kPa) LSM values (kPa)
Fibrosis stage Fibrosis stage
0-1 0-1
* *
*
* *
*
* *
2 3 4 2 3 4
A B
p=0.213
p=0.026
p=0.884 p=0.311
p<0.001 p=0.048
dict discordance of more than 2 fibrosis stages between LB and LSM was 0.21 rather than 0.3, which was used as the standard cutoff value for guaranteeing the reliability of LSM.
These newly proposed and more stringent criteria of Lu- cidarme, et al.7 narrowed the scope of previously consid- ered reliable LSMs and led us to reconsider LSM results with IQR/M in a borderline range (from 0.21 to 0.3). In a study of Korean patients with CHB, Kim, et al.8 concluded VMs are obtained, more than 60% of measurements are
successful,1,2 and the IQR/M is less than 0.3.5,6 The Fi- broScan® manufacturer recommends these criteria; howev- er, they are not based on scientific evidence. Investigators therefore have questioned their validity and influences on LSM accuracy.
In a study of European patients with CHC, Lucidarme, et al.7 concluded that the optimal IQR/M cutoff value to pre-
Table 4. Performance of LSM in Predicting Significant Fibrosis (≥F2) and Cirrhosis (F4) Using the First 3, the First 5, and All VMs Chronic hepatitis B (n=182) Chronic hepatitis C (n=68)
AUROC 95% CI AUROC 95% CI
Prediction of ≥F2
Using the first 3 VMs 0.892 0.804-0.981 0.892 0.812-0.972
Using the first 5 VMs 0.886 0.796-0.977 0.886 0.804-0.968
Using all VMs 0.880 0.787-0.974 0.891 0.809-0.973
Prediction of F4
Using the first 3 VMs 0.873 0.819-0.926 0.966 0.923-1.010
Using the first 5 VMs 0.879 0.827-0.932 0.974 0.938-1.009
Using all VMs 0.874 0.820-0.927 0.969 0.931-1.008
LSM, liver stiffness measurement; VMs, valid measurements; AUROC, area under the receiver operating characteristic curve; CI, confidence interval.
Fig. 2. The receiver operating characteristic curves using the first 3, the first 5, and all VMs for predicting significant fibrosis (≥F2) (A and C) and cirrhosis (F4) (B and D) in chronic hepatitis B (A and B) and C (C and D). The first 3, first 5, and all VMs taken significantly predicted fibrosis stages ≥F2 and F4 (all p<0.05) and AUROC values among the first 3, the first 5, and all VMs taken did not differ significantly (all p>0.05 by DeLong’s method24). VMs, valid measurements.
AUROC, area under the receiver operating characteristic curve.
0.0
0.0
0.0
0.0 0.2
0.2
0.2
0.2 0.4
0.4
0.4
0.4 0.6
0.6
0.6
0.6 0.8
0.8
0.8
0.8 1.0
1.0
1.0
1.0
SensitivitySensitivity SensitivitySensitivity
0.0
0.0
0.0
0.0 0.2
0.2
0.2
0.2 0.4
0.4
0.4
0.4 0.6
0.6
0.6
0.6 0.8
0.8
0.8
0.8 1.0
1.0
1.0
1.0 1-specificity
1-specificity
1-specificity
1-specificity First 3 VMs
First 5 VMs All VMs
First 3 VMs First 5 VMs All VMs
First 3 VMs First 5 VMs All VMs
First 3 VMs First 5 VMs All VMs
C A
D B
However, because the patients with more than 3 VMs, but less than 10 VMs comprised only about 5% of the study pop- ulation, the authors could not link any patient characteristic to the number of VMs required. Furthermore, different prev- alence in obesity and metabolic syndrome between Asian and Western populations as well as different viral character- istics between CHB and CHC may significantly influence LSM results.16,21,25 Thus, the minimal number of VMs re- quired in Asian patients with CHB or CHC should be in- vestigated.
In contrast to previous studies, we found that LSM predict- ed cirrhosis less accurately than it did significant fibrosis in patients with CHB. A potential spectrum bias, due to an ex- tremely high prevalence of cirrhosis (more than 60%), might explain this finding.26 However, the performance of LSM in our study for patients with CHC agrees with literature values.
In common with a previous study,9 we found that the accura- cy of LSM in predicting significant fibrosis and cirrhosis us- ing median elasticity scores from the first 3, first 5, and all VMs taken was similar in both patients with CHB and those with CHC. From this, we decided that 3 VMs of LSM may suffice in assessing liver fibrosis without significant loss of accuracy and then tried to identify factors that predict discor- that neither success rate nor IQR/M was a predictive factor
of the accuracy for diagnosing liver fibrosis and that the confounding effects of ALT might overshadow the influ- ence of success rate and IQR/M on the accuracy of LSM. A recent study in Canada proposed that four factors, mild fi- brosis, higher BMI, ALT, and IQR/M, are significantly re- lated to discordance between LB and LSM, although etiol- ogies of chronic liver disease were mixed.10 In all of these three studies, however, only patients with more than 10 VMs were enrolled; hence, the minimal number of VMs required for reliable LSM without significant loss in accuracy could not be analyzed. As a result, valid LSM results might have continually been discarded because of the overestimated standard number of VMs required for reliability of LSM.
Thus, it is imperative to set the optimal number of VMs.
Fortunately, Kettaneh, et al.9 reported that the perfor- mance in diagnosing significant fibrosis and cirrhosis using LSM was similar for whether one used the first 3, first 5 or all 10 VMs for calculating median elasticity scores in pa- tients who underwent at least 10 VMs. From this study, they concluded that setting the number of VMs at 5 or more will extend the benefits from LSM to more European patients with CHC without significant loss of diagnostic accuracy.
Table 5. Predictors of Discordance in Fibrosis Stage Estimated by the First 3 VMs and Liver Biopsy
Non-discordance* Discordance† Univariate Multivariate
p value HR 95% CI p value
Chronic hepatitis B n=154 n=28
Age (yrs) 47.1±11.1 40.0±12.7 0.004 0.995 0.955-1.037 0.805
Male 102 (66.2) 21 (75.0) 0.437
BMI (kg/m2) 23.4±2.7 23.5±3.3 0.898
Albumin (g/dL) 4.2±0.6 4.6±0.4 0.004 3.942 0.995-15.094 0.055
Total bilirubin (mg/dL) 0.9±1.1 1.0±1.6 0.662
ALT (IU/L) 49.8±45.4 104.0±115.0 0.004 1.010 1.003-1.017 0.006
Platelet count (103/mm3) 165.8±64.7 205.7±67.6 0.005 1.001 0.993-1.009 0.811
Prothrombin time (%) 91.0±10.6 96.5±5.8 0.013 1.072 0.983-1.168 0.115
Spleen size (cm) 10.3±1.8 10.5±1.9 0.546
Chronic hepatitis C n=64 n=4
Age (yrs) 49.4±11.6 54.3±11.3 0.419
Male 25 (39.1) 2 (50.0) 0.704
BMI (kg/m2) 22.9±3.0 25.1±5.6 0.198
Albumin (g/dL) 4.4±0.3 4.2±0.7 0.382
Total bilirubin (mg/dL) 0.7±0.3 1.4±0.9 0.015 8.297 0.658-104.574 0.102
ALT (IU/L) 50.7±58.9 92.5±68.4 0.213
Platelet count (103/mm3) 202.6±63.7 187.3±85.0 0.644
Prothrombin time (%) 98.0±5.5 89.3±18.3 0.050 1.007 0.870-1.166 0.921
Spleen size (cm) 9.3±1.4 11.1±1.4 0.041 1.613 0.812-3.203 0.172
VMs, valid measurements; HR, hazard ratio; CI, confidence interval; BMI, body mass index; ALT, alanine aminotransferase; LB, liver biopsy.
Variables are expressed as the mean±SD or n (%).
Non-discordance* indicates that fibrosis stage estimations using the first 3 VMs and LB agree. If not, the estimations are categorized as discordant†.
the first 3 VMs for LSM.
As in Kettaneh, et al.,9 we compared the performance of the median elasticity scores from the first 3, first 5, and all VMs taken in patients with at least 10 VMs. This approach was unavoidable; however, as only 9 (3.2%) of the patients had fewer than 10 VMs before the exclusions in our study.
Indeed, a sufficient number of patients with fewer than 10 VMs should be assembled to identify baseline factors for predicting those who would or would not obtain more than 10 VMs, by comparing their baseline characteristics before LSM examinations. Knowledge of these baseline predictors will allow us to decide when to stop measuring further un- necessary measurements of liver elasticity, allowing us to use only the minimal, but sufficient number of VMs for each patient. Furthermore, doing so will eventually clarify whether a reduced number of VMs of less than 10 can be adopted for analyzing the performance of LSM in an ade- quate study group with less than 10 VMs available. In our study, a small number of patients with than 10 VMs is one of our main limitations. A larger study, possibly a multi-cen- ter trial, including patients with a strategic balance of VMs should be performed to justify our findings. In addition, the small sample size overall, especially for patients with CHC, is another limitation of our study. Finally, we used external studies on the performance of LSM in Asian patients as ref- erence cutoff values. Therefore, results of this study might be not relevant for Europeans.
In conclusion, three VMs may be enough to assess liver fibrosis using LSM without significant loss of accuracy in patients with CHB and patients with CHC. However, ALT should be considered in the interpretation of LSM results for patients with CHB.
ACKNOWLEDGEMENTS
This study was supported by a grant from the Korea Health- care technology R & D project, Ministry of Health and Wel- fare, Republic of Korea (A102065).
REFERENCES
1. Castéra L, Vergniol J, Foucher J, Le Bail B, Chanteloup E, Haaser M, et al. Prospective comparison of transient elastography, Fi- brotest, APRI, and liver biopsy for the assessment of fibrosis in chronic hepatitis C. Gastroenterology 2005;128:343-50.
2. Ziol M, Handra-Luca A, Kettaneh A, Christidis C, Mal F, Kazemi
dance in fibrosis stage estimates, according to the median elasticity score from the first 3 VMs and LB.
The overall discordance in our study population was 12.8% (32 out of 250), 15.4% (n=28) in patients with CHB and 5.9% (n=4) in those with CHC. Although our overall discordance agreed with that in a previous study by Lu- cidarme, et al.7 (15.8% using Ziol’s cutoff values, 13.8%
using Fraquelli’s cutoff values, and 11.0% using Castera’s cutoff values),1,2,5 it was significantly lower (5.9%) in our patients with CHC. On multivariate analysis, only ALT in- dependently influenced discordance (p=0.006, HR 1.010, 95% CI, 1.003-1.0178) in patients with CHB, which agrees with previous studies reporting the importance of serum ALT in interpreting LSM in patients with CHB.4,20 As CHB frequently exhibits acute ALT flares that are unlikely to oc- cur in CHC,25,27 many studies have noted high ALT as hav- ing clinical significance. In contrast, we found no signifi- cant predictor of discordance in patients with CHC.
Using the median elasticity scores from the first 3 VMs and LB, we calculated the optimal ALT cutoff level, which maximally distinguished patients with non-discordance from those with discordance between LSM and LB, as 1.5×ULN (60 IU/L; Se 57.1% and Sp 79.5%). This value is very close to those in previous studies (1.5×ULN in one study10 and 2×ULN in another8). The prevalence of discor- dance was significantly higher in patients with ALT >1.5×
ULN than in those with ALT ≤1.5×ULN (34.0% vs. 9.1%;
p<0.001; odds ratio, 5.161; 95% CI, 2.214-12.030) (Fig. 3).
These results may indicate the need to consider ALT level in predicting discordance for patients with CHB, although it may not influence the overall performance of using only
Fig. 3. Prevalence of discordance in fibrosis stage estimated using the me- dian elasticity score from the first 3 VMs and LB according to ALT level in patients with CHB. The prevalence of discordance was significantly higher in patients with ALT >1.5×ULN than in those with ALT ≤1.5×ULN (p<0.001;
odds ratio, 5.161; 95% CI, 2.214-12.030). The prevalence of discordance was 9.1% in patients with ALT ≤1.5×ULN and 34.0% in those with ALT >1.5×ULN.
VMs, valid measurements; LB, liver biopsy; ALT, alanine aminotransferase;
CHB, chronic hepatitis B; ULN, upper limit of normal; CI, confidence interval.
0 20 40 60 80 100(%)
ALT≤1.5×ULN ALT>1.5×ULN
9.1
34.0
90.9 p<0.001
66.0
Non-discordance Discordance
15. Batts KP, Ludwig J. Chronic hepatitis. An update on terminology and reporting. Am J Surg Pathol 1995;19:1409-17.
16. Brunt EM, Janney CG, Di Bisceglie AM, Neuschwander-Tetri BA, Bacon BR. Nonalcoholic steatohepatitis: a proposal for grad- ing and staging the histological lesions. Am J Gastroenterol 1999;94:2467-74.
17. Talwalkar JA, Kurtz DM, Schoenleber SJ, West CP, Montori VM.
Ultrasound-based transient elastography for the detection of he- patic fibrosis: systematic review and meta-analysis. Clin Gastro- enterol Hepatol 2007;5:1214-20.
18. Friedrich-Rust M, Ong MF, Martens S, Sarrazin C, Bojunga J, Zeuzem S, et al. Performance of transient elastography for the staging of liver fibrosis: a meta-analysis. Gastroenterology 2008;
134:960-74.
19. Stebbing J, Farouk L, Panos G, Anderson M, Jiao LR, Mandalia S, et al. A meta-analysis of transient elastography for the detection of hepatic fibrosis. J Clin Gastroenterol 2010;44:214-9.
20. Chan HL, Wong GL, Choi PC, Chan AW, Chim AM, Yiu KK, et al. Alanine aminotransferase-based algorithms of liver stiffness measurement by transient elastography (Fibroscan) for liver fibro- sis in chronic hepatitis B. J Viral Hepat 2009;16:36-44.
21. Wang JH, Changchien CS, Hung CH, Eng HL, Tung WC, Kee KM, et al. FibroScan and ultrasonography in the prediction of he- patic fibrosis in patients with chronic viral hepatitis. J Gastroenter- ol 2009;44:439-46.
22. Takeda T, Yasuda T, Nakayama Y, Nakaya M, Kimura M, Yamashita M, et al. Usefulness of noninvasive transient elastography for as- sessment of liver fibrosis stage in chronic hepatitis C. World J Gastroenterol 2006;12:7768-73.
23. Nitta Y, Kawabe N, Hashimoto S, Harata M, Komura N, Ko- bayashi K, et al. Liver stiffness measured by transient elastogra- phy correlates with fibrosis area in liver biopsy in patients with chronic hepatitis C. Hepatol Res 2009;39:675-84.
24. DeLong ER, DeLong DM, Clarke-Pearson DL. Comparing the areas under two or more correlated receiver operating characteris- tic curves: a nonparametric approach. Biometrics 1988;44:837-45.
25. Yuen MF, Yuan HJ, Hui CK, Wong DK, Wong WM, Chan AO, et al. A large population study of spontaneous HBeAg seroconver- sion and acute exacerbation of chronic hepatitis B infection: im- plications for antiviral therapy. Gut 2003;52:416-9.
26. Poynard T, Halfon P, Castera L, Munteanu M, Imbert-Bismut F, Ratziu V, et al. Standardization of ROC curve areas for diagnostic evaluation of liver fibrosis markers based on prevalences of fibro- sis stages. Clin Chem 2007;53:1615-22.
27. Liaw YF. Hepatitis flares and hepatitis B e antigen seroconversion:
implication in anti-hepatitis B virus therapy. J Gastroenterol Hepa- tol 2003;18:246-52.
F, et al. Noninvasive assessment of liver fibrosis by measurement of stiffness in patients with chronic hepatitis C. Hepatology 2005;41:48-54.
3. Marcellin P, Ziol M, Bedossa P, Douvin C, Poupon R, de Léding- hen V, et al. Non-invasive assessment of liver fibrosis by stiffness measurement in patients with chronic hepatitis B. Liver Int 2009;29:242-7.
4. Kim SU, Kim do Y, Park JY, Lee JH, Ahn SH, Kim JK, et al. How can we enhance the performance of liver stiffness measurement using FibroScan in diagnosing liver cirrhosis in patients with chronic hepatitis B? J Clin Gastroenterol 2010;44:66-71.
5. Fraquelli M, Rigamonti C, Casazza G, Conte D, Donato MF, Ron- chi G, et al. Reproducibility of transient elastography in the evalu- ation of liver fibrosis in patients with chronic liver disease. Gut 2007;56:968-73.
6. Roulot D, Czernichow S, Le Clésiau H, Costes JL, Vergnaud AC, Beaugrand M. Liver stiffness values in apparently healthy sub- jects: influence of gender and metabolic syndrome. J Hepatol 2008;48:606-13.
7. Lucidarme D, Foucher J, Le Bail B, Vergniol J, Castera L, Du- burque C, et al. Factors of accuracy of transient elastography (fi- broscan) for the diagnosis of liver fibrosis in chronic hepatitis C.
Hepatology 2009;49:1083-9.
8. Kim SU, Seo YS, Cheong JY, Kim MY, Kim JK, Um SH, et al.
Factors that affect the diagnostic accuracy of liver fibrosis mea- surement by Fibroscan in patients with chronic hepatitis B. Ali- ment Pharmacol Ther 2010;32:498-505.
9. Kettaneh A, Marcellin P, Douvin C, Poupon R, Ziol M, Beaugrand M, et al. Features associated with success rate and performance of FibroScan measurements for the diagnosis of cirrhosis in HCV patients: a prospective study of 935 patients. J Hepatol 2007;46:
628-34.
10. Myers RP, Crotty P, Pomier-Layrargues G, Ma M, Urbanski SJ, Elkashab M. Prevalence, risk factors and causes of discordance in fibrosis staging by transient elastography and liver biopsy. Liver Int 2010;30:1471-80.
11. Kim SU, Kim do Y, Lee CK, Park JY, Kim SH, Kim HM, et al.
Ascitic fluid infection in patients with hepatitis B virus-related liv- er cirrhosis: culture-negative neutrocytic ascites versus spontane- ous bacterial peritonitis. J Gastroenterol Hepatol 2010;25:122-8.
12. Bedossa P, Dargére D, Paradis V. Sampling variability of liver fi- brosis in chronic hepatitis C. Hepatology 2003;38:1449-57.
13. Lebray P, Varnous S, Charlotte F, Varaut A, Poynard T, Ratziu V.
Liver stiffness is an unreliable marker of liver fibrosis in patients with cardiac insufficiency. Hepatology 2008;48:2089.
14. Sandrin L, Fourquet B, Hasquenoph JM, Yon S, Fournier C, Mal F, et al. Transient elastography: a new noninvasive method for assess- ment of hepatic fibrosis. Ultrasound Med Biol 2003;29:1705-13.