Assessment of Hepatic Fibrosis Regression by Transient Elastography in Patients with Chronic Hepatitis B Treated with Oral Antiviral Agents
Transient elastography (TE) has been used as a non-invasive method for liver stiffness measurement (LSM) in patients with chronic liver disease. This study was performed to assess the change of LSM by TE and to assess its clinical usefulness during long-term oral antiviral therapy in patients with chronic hepatitis B (CHB). We retrospectively reviewed 83 CHB patients. The mean interval between two LSM was 411.5 ± 149.5 days. Initial and follow-up LSM was 16.15 ± 12.41 kPa and 11.26 ± 7.36 kPa, respectively (P < 0.001). The degree of regression of liver stiffness was -2.03 ± 0.36% per month. The fibrosis stage classified by LSM value improved in 37 (44.6%) patients during oral antiviral therapy. Of the 30 (36.1%) patients with LSM ≥ 14.1 kPa (cirrhosis) at 1st LSM, 12 (40%) proved to no longer have cirrhosis (≥ 1 decrease in fibrosis stage) at 2nd LSM. LSM significantly decreased in both baseline high (> upper limit of normal [ULN] × 2) and low (≤ ULN × 2) alanine aminotransferase groups during antiviral therapy (P < 0.001; P = 0.001,
respectively). Long-term oral antiviral therapy resulted in the improvement of liver stiffness in a substantial portion of patients with CHB. TE may be used a useful clinical tool to assess disease progression in CHB patients.
Keywords: Elasticity Imaging Techniques; Liver Cirrhosis; Hepatitis B, Chronic; Liver Stiffness; Oral Antiviral Agents
Ja Kyung Kim,1,2 Dae Won Ma,1 Kwan Sik Lee,1,2 and Yong-Han Paik3
1Department of Internal Medicine, Gangnam Severance Hospital, Yonsei University College of Medicine, Seoul; 2Liver Cirrhosis Clinical Research Center, Seoul; 3Department of Medicine, Samsung Medical Center, Sungkyunkwan University School of Medicine, Seoul, Korea
Received: 29 October 2013 Accepted: 20 January 2014 Address for Correspondence:
Yong-Han Paik, MD
Department of Medicine, Samsung Medical Center, Sungkyunkwan University School of Medicine, 81 Irwon-ro, Gangnam-gu, Seoul 135-710, Korea
Tel: +82.2-3410-3878, Fax: +82.2-3410-6983 E-mail: [email protected]
This study was supported by a grant of the Korea Healthcare Technology R&D Project, Ministry of Health and Welfare, Republic of Korea (HI10C2020).
http://dx.doi.org/10.3346/jkms.2014.29.4.570 • J Korean Med Sci 2014; 29: 570-575
INTRODUCTION
Chronic hepatitis B (CHB) often leads to serious health condi
tions including decompensated liver cirrhosis and hepatocel
lular carcinoma (HCC) (1). Host immune response to HBV in
fected hepatocytes results in hepatocyte apoptosis and necrosis that activates nonparenchymal cells including hepatic stellate cells to produce extracellular matrix such as type I collagen re
sulting in hepatic fibrosis (2, 3). Hepatic fibrogenesis is a dyna
mic process with a net result of fibrotic scar formation. Resolu
tion of scars determines the progression from hepatic fibrosis to liver cirrhosis (4). The suppression of viral replication by long
term antiviral therapy may improve hepatic inflammation and fibrosis and halt the progression of disease to decompensated liver cirrhosis and HCC (5, 6). Lamivudine treatment decreased complications from portal hypertension and the development of liver cancer in patients with compensated liver cirrhosis, al
though the benefit was less in patients who develop lamivudine resistance (7). Entecavir treatment for 48 weeks in patients with advanced hepatic fibrosis or cirrhosis showed the improvement of liver histology in 57% with HBeAg+ve, 59% with HBeAgve, and 43% of patients with lamivudineresistant CHB (8).
Accurate information about the hepatic fibrosis stage is very
important in clinical practice because the extent of hepatic fi
brosis predicts the development of hepatic decompensation and HCC in patients with CHB (9, 10). Liver biopsy has been a gold standard to assess the extent of hepatic fibrosis (11). How
ever it is hard to perform liver biopsy repeatedly in patients with CHB because of its invasive nature. Instead, the assessment of liver stiffness using fibroscan has been reported as a relevant noninvasive tool for the assessment of hepatic fibrosis in vari
ous kinds of chronic liver disease including hepatitis B, hepati
tis C, and alcoholic liver disease (12). In this study we aimed to evaluate the regression of hepatic fibrosis through repeated liv
er stiffness measurement (LSM) using fibroscan during long
term oral antiviral therapy in patients with CHB.
MATERIALS AND METHODS Patients
From October 2007 to February 2011, a total of 3,156 LSM was performed in Gangnam Severance Hospital, Seoul, Korea. Eighty eight CHB patients on oral nucleos(t)ide therapy who received LSM twice were retrospectively enrolled. Five patients who had the interval between the first and the second LSM was shorter than 6 months, were excluded. No patients were positive to an
Gastroenterology & Hepatology
tihepatitis C virus (HCV) antibody (Ab) or antihuman immu
nodeficiency virus Ab. Finally, 83 patients were included in this study. We retrospectively reviewed the medical records and an
alysed the change of liver stiffness measured by transient elas
tography (Fibroscan®, Echosens, France). The patients were fol
lowed up every 3 months with serologic tests. When virologic breakthrough due to the development of antiviral drug resistance was confirmed, nucleos(t)ide analogue was added or changed according to resistant mutation.
Laboratory tests
HBsAg and HBeAg/Ab were determined by enzyme immuno
assay (Dade Behring, Marburg, Germany). Serum HBV DNA was measured by a realtime polymerase chain reaction assay using a COBAS TaqMan 48 analyzer (Roche Diagnostics, Mann
heim, Germany) with a detection limit of 12 IU/mL. The anti
body against HCV was detected by a thirdgeneration enzyme
linked immunosorbent assay (Korea Greencross, Yongin, Ko
rea).
Liver stiffness measurement (LSM)
Well trained and experienced physicians obtained all LSM ac
cording to the instructions provided by the manufacturer. All patients received LSM using FibroScan® two times during oral nucleos(t)ide antiviral therapy. The first LSM was performed before the starting antiviral therapy (n = 33, 39.8%) or during follow up visit on antiviral therapy (n = 50, 60.2%). The timing of the 2nd LSM was decided by physician’s or patient’s discre
tion to monitor liver stiffness. The mean interval between the first and the second LSM was 411.5 ± 149.5 (range: 1801,062) days. LSM was performed on the right lobe of the liver through the intercostal spaces on patients lying in the dorsal decubitus position with the right arm in maximal abduction (13). The re
sults are expressed as kilopascals (kPa). The extent of liver fibro
sis was classified according to the METAVIR scoring system (F0
F4). Transient elastography cutoff levels used for staging liver fibrosis ≥ F2, ≥ F3, and F4 were 8.8, 10.2, and 14.1 kPa, respec
tively (14).
The interquartile range (IQR) was defined as an index of in
trinsic variability of LSM corresponding to the interval of LSM results containing 50% of the valid measurements between the 25th and 75th percentiles. The median LSM was selected as representative of the LSM value in a given patient. In this study, only LSM examinations with at least ten validated measurements, an IQR to median value ratio (IQR/M) was less than 0.3, and a success rate of at least 60% were considered reliable and were included for the analysis.
Statistics
Data were analyzed using the statistical software SPSS (version 13.0, SPSS Inc., Chicago, IL, USA). Quantitative variables are ex
pressed as mean ± standard deviation. The degree of difference of LSM between two time points (% per month) was calculated as follows;
(2nd stiffness1st stiffness) × 100/1st stiffness (2nd date1st date)/30.5
Data were analyzed using paired ttest, Wilcoxon signed rank test, MannWhitney U test, oneway ANOVA, and chisquare test.
Data were considered to be statistically significant with P < 0.05.
Ethics statement
This study conformed to the ethical guidelines of the 1975 Dec
laration of Helsinki and was approved by the institutional re
view board at Gangnam Severance Hospital, Seoul, Korea (3
20130269). Informed consents were waived by the board.
RESULTS
Baseline characteristics of the patients
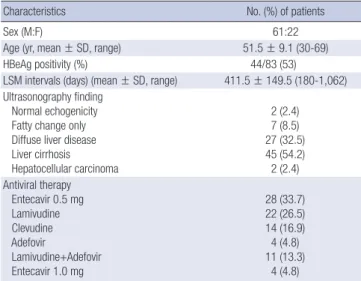
The baseline characteristics of the 83 patients are presented in Table 1. There were 61 men and 22 women, with a mean age of 51.5 ± 9.1 yr. The mean interval between two LSMs was 411.5
± 149.5 (1801,062) days. The number of patients received anti
viral therapy as follows; entecavir 0.5 mg in 28 (33.7%), lamivu
dine in 22 (26.5%), clevudine in 14 (16.9%), adefovir in 4 (4.8%), lamivudine plus adefovir in 11 (13.3%), and entecavir 1.0 mg in 4 (4.8%) patients. Eighty patients (96.4%) showed serum HBV DNA below 2,000 IU/mL at 2nd LSM.
Comparison of clinical parameters between two LSMs during antiviral therapy
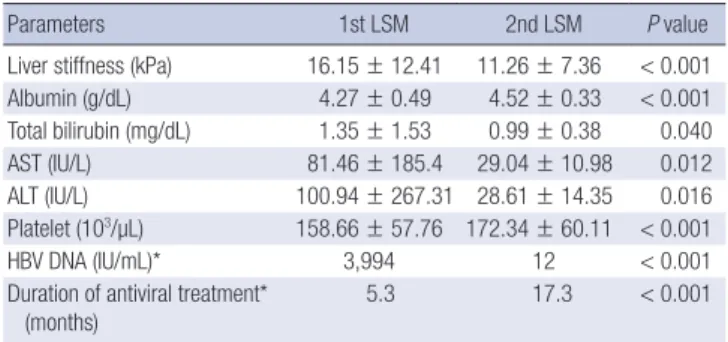
Clinical parameters and liver stiffness values are demonstrated in Table 2. During the antiviral therapy, aspartate aminotrans
ferase (AST), alanine aminotransferase (ALT), total bilirubin, and HBV DNA levels were decreased. Accordingly, serum albu
Table 1. Baseline characteristics of patients
Characteristics No. (%) of patients
Sex (M:F) 61:22
Age (yr, mean ± SD, range) 51.5 ± 9.1 (30-69)
HBeAg positivity (%) 44/83 (53)
LSM intervals (days) (mean ± SD, range) 411.5 ± 149.5 (180-1,062) Ultrasonography finding
Normal echogenicity Fatty change only Diffuse liver disease Liver cirrhosis Hepatocellular carcinoma
2 (2.4) 7 (8.5) 27 (32.5) 45 (54.2) 2 (2.4) Antiviral therapy
Entecavir 0.5 mg Lamivudine Clevudine Adefovir
Lamivudine+Adefovir Entecavir 1.0 mg
28 (33.7) 22 (26.5) 14 (16.9) 4 (4.8) 11 (13.3)
4 (4.8)
min levels and platelet count increased during the antiviral ther
apy. Liver stiffness values significantly decreased from 16.15 ± 12.41 kPa to 11.26 ± 7.36 kPa during the antiviral therapy (P <
0.001). Sixtytwo (74.7%) patients had a lower liver stiffness val
ue at 2nd LSM compared to 1st LSM. The degree of regression of liver stiffness value was 2.03 ± 0.36 (10.25~8.83)% per month.
There was no difference of the degree of regression of liver stiff
ness between the patients in whom initial LSM was obtained before starting antiviral therapy (n = 33) and the patients in whom initial LSM was obtained during antiviral therapy (n = 50) (2.54
± 3.13 vs 1.69 ± 3.35% per month, P = 0.251). The difference of liver stiffness value between 1st and 2nd LSMs by the type of antiviral agents is summarized in Fig. 1. The differences of two LSM values were all negative regardless of antiviral agents. How
ever, there was no significant difference according to the kind of antiviral agents (P = 0.625) or lamivudine resistance (P = 0.078).
Of the 30 (36.1%) patients with LSM ≥ 14.1 kPa (cirrhosis) at 1st LSM, 25 (83.3%) had a lower LSM value and 12 (40%) proved to no longer have cirrhosis ( ≥ 1 decrease in fibrosis stage) at 2nd LSM.
Comparison of groups according to the change of LSM value during antiviral therapy
We compared the clinical parameters according to the presence
of the improvement of LSM value during antiviral therapy (Ta
ble 3). Sixty two (74.7%) patients had a decrease in liver stiffness value (group 1), whereas 21 (25.3%) showed an increase in liver stiffness value (group 2) during antiviral therapy. There was no difference in sex, age, LSM intervals, baseline laboratory pro
files including AST, ALT, total bilirubin, HBeAg positivity, HBV DNA levels between two groups. Only 1st LSM value was higher in group 1 (P = 0.012), and 2nd LSM value was lower in group 1 compared to group 2 (P = 0.005).
Comparison of groups according to the change of fibrosis stage during antiviral therapy
The patients’ initial fibrosis stages were 16 (19.3%) in F01, 15 (18.1%) in F2, 22 (26.5%) in F3 and 30 (36.1%) in F4, respective
ly. After antiviral therapy, the patients’ fibrosis stages were 42 (50.6%) in F01, 6 (7.2%) in F2, 12 (14.5%) in F3 and 23 (27.7%) in F4, respectively (Fig. 2). The fibrosis stage was improved in 37 (44.6%) between two LSMs. Thirty eight (45.8%) patients show
ed no change of fibrosis stage, only 8 (9.6%) showed the aggra
vation of fibrosis stage. Among these 8 patients, their initial ul
trasonographic findings were diffuse liver disease in 2 patients, and liver cirrhosis in 6 patients. The antiviral treatment for these 8 patients was as follows; lamivudine for 2 patients, clevudine for 2 patients, entecavir for 2 patients, adefovir for one patient, and lamivudine and adefovir combination for one patient. Clinical parameters according to the improvement of fibrosis stage were compared (Table 4). There was no difference in age, LSM inter
vals, initial laboratory profiles including AST, ALT, total biliru
bin, HBeAg positivity, and HBV DNA levels. However, patients Table 2. Comparison of parameters between two LSMs during antiviral therapy
Parameters 1st LSM 2nd LSM P value
Liver stiffness (kPa) 16.15 ± 12.41 11.26 ± 7.36 < 0.001 Albumin (g/dL) 4.27 ± 0.49 4.52 ± 0.33 < 0.001 Total bilirubin (mg/dL) 1.35 ± 1.53 0.99 ± 0.38 0.040
AST (IU/L) 81.46 ± 185.4 29.04 ± 10.98 0.012
ALT (IU/L) 100.94 ± 267.31 28.61 ± 14.35 0.016
Platelet (103/µL) 158.66 ± 57.76 172.34 ± 60.11 < 0.001
HBV DNA (IU/mL)* 3,994 12 < 0.001
Duration of antiviral treatment*
(months) 5.3 17.3 < 0.001
*Median. AST, aspartate aminotransferase; ALT, alanine aminotransferase; LSM, liver stiffness measurement.
Fig. 1. The difference of liver stiffness values between the first and the second mea- surement using transient elastography (Fibroscan®) by the type of antiviral agents.
The differences of two LSM values were all negative values regardless of antiviral agents. However, there was no significant difference according to the kind of antiviral agents (P = 0.625) or lamivudine resistance (P = 0.078).
Difference of liver stiffness measurements (kPa)
Treatment-naive patients Lamivudine resistant patients Lamivudine
(n = 22) Clevudine
(n = 14) Entecavir 0.5 (n = 28) Adefovir
(n = 4)
Entecavir 1.0 (n = 4) Lamivudine
+ Adefovir (n = 11) -0.50
-1.0-1.5 -2.0-2.5 -3.0-3.5 -4.0-4.5 -5.0
Table 3. Comparison of groups by LSM change during antiviral therapy
Parameters LSM decreased
(n = 62) LSM increased
(n = 21) P value
Male gender (%) 72.6 76.2 1.000
Age (yr) 51.29 ± 8.75 52.14 ± 10.32 0.714
Measurement intervals (day) 401.90 ± 151.09 439.95 ± 148.16 0.319
1st LSM value 17.57 ± 13.68 11.97 ± 5.94 0.012
2nd LSM value 9.95 ± 6.90 15.12 ± 7.44 0.005
1st Albumin (g/dL) 4.23 ± 0.55 4.39 ± 0.25 0.083 2nd Albumin (g/dL) 4.55 ± 0.33 4.42 ± 0.28 0.140 1st T. bilirubin (mg/dL) 1.48 ± 1.74 0.99 ± 0.26 0.035 2nd T. bilirubin (mg/dL) 1.021 ± 0.38 0.929 ± 0.38 0.340 1st AST (IU/L) 93.95 ± 212.68 44.57 ± 32.86 0.294
2nd AST (IU/L) 27.29 ± 8.61 34.19 ± 15.17 0.059
1st ALT (IU/L) 113.87 ± 305.50 62.76 ± 79.06 0.452 2nd ALT (IU/L) 26.03 ± 11.86 36.24 ± 18.26 0.024 1st Platelet (103/µL) 157.80 ± 62.90 162.55 ± 37.73 0.687 2nd Platelet (103/µL) 172.12 ± 65.09 172.60 ± 40.93 0.969
1st HBeAg positivity (%) 64.2 52.6 0.377
2nd HBeAg positivity (%) 56.0 47.4 0.521
1st HBV DNA (IU/mL)* 3,994 (0-110,000,000)
5,150 (0-110,000,000)
0.743
2nd HBV DNA (IU/mL)* 12 (0-7,990) 12 (0-306,000) 0.727
*Median. AST, aspartate aminotransferase; ALT, alanine aminotransferase; LSM, liver stiffness measurement; HBeAg, hepatitis B envelop antigen; HBV, hepatitis B virus.
with improved fibrosis stage were female predominant, and had lower initial LSM value and higher initial albumin level.
Comparison of groups according to ALT levels at 1st LSM during antiviral therapy
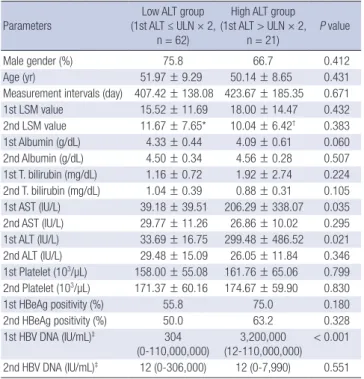
It has been reported that ALT level may affect the LSM value. So we compared two groups accoding to ALT levels at 1st LSM time point (Table 5). AST, ALT, and HBV DNA levels were significant
ly higher in the high ALT (> upper limit of normal [ULN] × 2) group. However, there was no difference in sex, age, LSM mea
surement intervals, baseline albumin, total bilirubin, and HBeAg positivity between two groups. The second LSM significantly decreased in both high ALT (> ULN × 2) and low ALT (≤ ULN
× 2) group compared to 1st LSM (P < 0.001; P = 0.001, respec
tively).
DISCUSSION
Chronic HBV infection is one the most common etiologies of chronic liver disease in Korea (15). There are several clinical features of HBVrelated chronic liver diseases in Korean popu
lation (16). HBV genotype C is more than 95%, and precore and core promoter mutant HBV are common. Lamivudine resis
tance is not uncommon among CHB patients who are candi
dates for the treatment with oral nucleos(t)ide analogues in Ko
rea. The aim of treating patients with chronic HBV infection is to prevent disease progression to liver cirrhosis and hepatocel
lular carcinoma (17). Oral antiviral agents are widely used to suppress viral replication and to prevent disease progression.
However, longterm antiviral therapy is usually required be
cause of the nature of oral nucleos(t)ide analogues. After intro
duction of potent antiviral agents such as entecavir or tenofovir, it becomes possible to maintain HBV viral load very low or even undectable during longterm antiviral therapy. Moreover, the reversal of hepatic fibrosis/cirrhosis was observed in patients Fig. 2. Changes of the proportion of the patients grouped by the fibrosis stage be-
tween two liver stiffness measurements during oral antiviral therapy. The patients’
initial fibrosis stages were 16 (19.3%) in F0-1, 15 (18.1%) in F2, 22 (26.5%) in F3 and 30 (36.1%) in F4, respectively. After antiviral therapy, the patients’ fibrosis stages were 42 (50.6%) in F0-1, 6 (7.2%) in F2, 12 (14.5%) in F3 and 23 (27.7%) in F4, respectively.
%
1st LSM 2nd LSM
100 80
60 40
20 0
F0-1 F2 F3 F4
Table 4. Comparison of groups by fibrosis stage improvement during antiviral therapy
Parameters Fibrosis stage
improved (n = 37)
Fibrosis stage not improved (n = 46) P value
Male gender (%) 59.5 84.8 0.013
Age (yr) 51.16 ± 8.92 51.78 ± 9.36 0.760
Measurement intervals (day) 419.92 ± 164.31 404.78 ± 139.67 0.651
1st LSM value 12.47 ± 3.23 19.11 ± 15.88 0.008
2nd LSM value 7.14 ± 2.41* 14.57 ± 8.30† < 0.001
1st Albumin (g/dL) 4.41 ± 0.31 4.16 ± 0.59 0.018
2nd Albumin (g/dL) 4.60 ± 0.27 4.45 ± 0.36 0.030
1st T. bilirubin (mg/dL) 1.23 ± 1.64 1.45 ± 1.44 0.513 2nd T. bilirubin (mg/dL) 0.951 ± 0.31 1.035 ± 0.43 0.307 1st AST (IU/L) 90.95 ± 255.10 73.83 ± 102.25 0.679
2nd AST (IU/L) 25.92 ± 8.67 31.54 ± 12.05 0.019
1st ALT (IU/L) 129.76 ± 384.47 77.76 ± 103.54 0.382
2nd ALT (IU/L) 25.32 ± 12.00 31.26 ± 15.63 0.061
1st Platelet (103/µL) 172.33 ± 58.86 148.07 ± 54.56 0.060 2nd Platelet (103/µL) 182.22 ± 58.06 164.07 ± 60.50 0.178
1st HBeAg positivity (%) 59.4 62.5 0.812
2nd HBeAg positivity (%) 53.3 53.8 1.000
1st HBV DNA (IU/mL)‡ 4,682
(0-110,000,000) 3,140
(0-110,000,000) 0.540 2nd HBV DNA (IU/mL)‡ 12 (0-6,580) 12 (0-306,000) 0.398
*P < 0.001; †0.011 compared to 1st LSM values; ‡Median. AST, aspartate amino- transferase; ALT, alanine aminotransferase; LSM, liver stiffness measurement; HBeAg, hepatitis B envelop antigen; HBV, hepatitis B virus.
Table 5. Comparison of groups by ALT levels at 1st LSM during antiviral therapy
Parameters Low ALT group
(1st ALT ≤ ULN × 2, n = 62)
High ALT group (1st ALT > ULN × 2,
n = 21)
P value
Male gender (%) 75.8 66.7 0.412
Age (yr) 51.97 ± 9.29 50.14 ± 8.65 0.431
Measurement intervals (day) 407.42 ± 138.08 423.67 ± 185.35 0.671
1st LSM value 15.52 ± 11.69 18.00 ± 14.47 0.432
2nd LSM value 11.67 ± 7.65* 10.04 ± 6.42† 0.383 1st Albumin (g/dL) 4.33 ± 0.44 4.09 ± 0.61 0.060 2nd Albumin (g/dL) 4.50 ± 0.34 4.56 ± 0.28 0.507 1st T. bilirubin (mg/dL) 1.16 ± 0.72 1.92 ± 2.74 0.224 2nd T. bilirubin (mg/dL) 1.04 ± 0.39 0.88 ± 0.31 0.105 1st AST (IU/L) 39.18 ± 39.51 206.29 ± 338.07 0.035 2nd AST (IU/L) 29.77 ± 11.26 26.86 ± 10.02 0.295 1st ALT (IU/L) 33.69 ± 16.75 299.48 ± 486.52 0.021 2nd ALT (IU/L) 29.48 ± 15.09 26.05 ± 11.84 0.346 1st Platelet (103/µL) 158.00 ± 55.08 161.76 ± 65.06 0.799 2nd Platelet (103/µL) 171.37 ± 60.16 174.67 ± 59.90 0.830
1st HBeAg positivity (%) 55.8 75.0 0.180
2nd HBeAg positivity (%) 50.0 63.2 0.328
1st HBV DNA (IU/mL)‡ 304
(0-110,000,000) 3,200,000
(12-110,000,000) < 0.001 2nd HBV DNA (IU/mL)‡ 12 (0-306,000) 12 (0-7,990) 0.551
*P < 0.001; †0.001 compared to 1st LSM values; ‡Median. AST, aspartate aminotrans- ferase; ALT, alanine aminotransferase; LSM, liver stiffness measurement; HBeAg, hep- atitis B envelop antigen; HBV, hepatitis B virus.
with longterm oral antiviral therapy (6).
Liver fibrosis results from wound healing response for chron
ic inflammation in the liver. The stage of liver fibrosis has a good correlation with liverrelated clinical outcome such as decom
pensated liver cirrhosis or even development of HCC (18, 19).
The accurate information about the extent of liver fibrosis in patients with CHB is clinically very important for the evaluation of severity of the disease, for making treatment decisions and for evaluating efficacy of antiviral treatment. Liver biopsy has long been a gold standard to assess the degree of liver fibrosis (11). However, because of invasive nature and risk of bleeding complication it is difficult to perform liver biopsy, particularly when it needs to be repeated in real clinical practice. Moreover, liver biopsy has limitations such as extremely small sampling size representing only 1/50,000 liver volume, intra or interob
server variation for the accurate assessment of liver fibrosis (20).
Recently noninvasive methods such as transient elastograpy, acoustic radiation force impulse (ARFI), FibroCT, MRI have been explored for the assessment of hepatic fibrosis (12). Liver stiffness measurement by fibroscan is the most widely used non
invasive method for assessing the extent of liver fibrosis. It was reported that LSM discriminates significant liver fibrosis or liver cirrhosis (F4) with high accuracy in patients with chronic viral hepatitis (21, 22). Our study showed that mean LSM was de
creased from 16.15 ± 12.41 kPa to 11.26 ± 7.36 kPa during anti
viral therapy for an average 411 days, suggesting the regression of hepatic fibrosis during oral antiviral therapy. The average of degree of regression of liver stiffness during antiviral therapy was 2.03 ± 0.36% per month. There was no statistical difference of degree of regression by the type of antiviral agents or presence of lamivudine resistance. These results might be caused by the small number of patients in each oral antiviral agents group, and should be studied further in a larger study.
The heterogeneous timing of LSM from the retrospective study design is a limitation. The 1st LSM was measured as a baseline before starting antiviral therapy in 33 patients (39.8%). Median duration of antiviral treatment to 1st and 2nd LSM time point was 5.3 and 17.3 months, respectively. There was no difference of the degree of regression of liver stiffness between the groups in whom initial LSM was obtained before starting antiviral ther
apy (n = 33) and the patients in whom initial LSM was obtained during antiviral therapy (n = 50) (2.54 ± 3.13 vs 1.69 ± 3.35%
per month, P = 0.251). Therefore it is less likely that the improve
ment of LSM mainly resulted from lead time bias by previous longterm antiviral therapy.
In our study, we adopted LSM cutoffs for fibrosis staging from a previous report in which Korean patients with genotype C HBV infection were studied. Of the 30 (36.1%) patients with LSM ≥ 14.1 kPa (F4) at 1st LSM, 12 (40%) proved to have im
proved fibrosis (LSM less than 14.1 kPa) at 2nd LSM. According to recent metaanalysis, weighted mean LSM values were 7.9,
8.8, and 11.7 for F ≥ 2, F ≥ 3, and F = 4 (23). When we apply cut
offs 7.9, 8.8, and 11.7 kPa for F ≥ 2, F ≥ 3, and F = 4 from the metaanalysis, LSM improvement was also observed in a very similar manner during antiviral therapy compared with our current data. The fibrosis stage was improved in 39 (47.0%) be
tween two LSMs. Thirty six (43.4%) patients showed no change of fibrosis stage, only 8 (9.6%) showed the aggravation of fibro
sis stage. Of the 39 (47.0%) patients with LSM ≥ 11.7 kPa (cir
rhosis) at 1st LSM, 17 (43.6%) proved to no longer have cirrhosis (≥ 1 decrease in fibrosis stage) at 2nd LSM. Taken together, these data indicate that oral antiviral therapy attenuates the extent of liver fibrosis in patients with Bviral liver cirrhosis.
For the assessment of hepatic fibrosis by LSM using Fibroscan, the following important limitation should be considered. The degree of hepatic necroinflammation may affect the LSM value, i.e., the presence of significant necroinflammation can exagger
ate the LSM value (2426). When we analysed the change of LSM during antiviral therapy with respect to baseline ALT level, the LSM value significantly decreased in high ALT (> ULN × 2) group as well as in low ALT ( ≤ ULN × 2) group, indicating that oral antiviral therapy decrease liver stiffness regardless of ALT ab
normality in patients with CHB. These results suggest that the decrease in LSM value during oral antiviral therapy is not caused by purely reducing hepatic necroinflammation but at least par
tially by decreasing hepatic fibrosis. Macronodular cirrhotic ar
chitecture or the absence of significant histologic grade may re
sults in false negative LSM (LSM below cutoff level of cirrhosis) for the accurate diagnosis of histologic cirrhosis. The absence or mild histologic grade during oral antiviral therapy in our study might cause lower 2nd LSM value resulting in the underestima
tion of liver cirrhosis.
Because of retrospective study design, pathologic changes were not verified to confirm the change of LSM in our study. In spite of this limitation, the demonstration of the LSM change in CHB patients on antiviral therapy through repeated measure
ment of liver stiffness in real life setting provides important clin
ical implication supporting the usefulness of LSM using Fibro
scan for the assessment of fibrosis regression during antiviral treatment. Recently, Marcellin et al. demonstrated that oral an
tiviral treatment with tenofovir regressed liver cirrhosis in chron
ic hepatitis B patients (27). Our study provides similar results using repeated LSM measurement instead of repeated liver bi
opsies in reallife practice setting. Our study result warrants fur
ther prospective study to confirm the correlation of LSM and pathologic changes during oral antiviral therapy in CHB patients.
In conclusion, longterm oral antiviral therapy resulted in the improvement of liver stiffness in a substantial portion of patients with CHB. Liver stiffness measurement using transient elastog
raphy may be used as a useful clinical tool to evaluate disease progression in CHB patients.
DISCLOSURE
The authors have no conflict of interest to disclose.
ORCID
Ja Kyung Kim http://orcid.org/0000-0001-5025-6846 Dae Won Ma http://orcid.org/0000-0002-0321-1140 Kwan Sik Lee http://orcid.org/0000-0002-3672-1198 YongHan Paik http://orcid.org/0000-0002-3076-2327 REFERENCES
1. Chen CJ, Iloeje UH, Yang HI. Long-term outcomes in hepatitis B: the RE- VEAL-HBV study. Clin Liver Dis 2007; 11: 797-816.
2. Chisari FV, Ferrari C. Hepatitis B virus immunopathogenesis. Annu Rev Immunol 1995; 13: 29-60.
3. Friedman SL. Mechanisms of hepatic fibrogenesis. Gastroenterology 2008;
134: 1655-69.
4. Kisseleva T, Brenner DA. Hepatic stellate cells and the reversal of fibro- sis. J Gastroenterol Hepatol 2006; 21: S84-7.
5. Dienstag JL, Goldin RD, Heathcote EJ, Hann HW, Woessner M, Stephen
son SL, Gardner S, Gray DF, Schiff ER. Histological outcome during long- term lamivudine therapy. Gastroenterology 2003; 124: 105-17.
6. Chang TT, Liaw YF, Wu SS, Schiff E, Han KH, Lai CL, Safadi R, Lee SS, Halota W, Goodman Z, et al. Long-term entecavir therapy results in the reversal of fibrosis/cirrhosis and continued histological improvement in patients with chronic hepatitis B. Hepatology 2010; 52: 886-93.
7. Liaw YF, Sung JJ, Chow WC, Farrell G, Lee CZ, Yuen H, Tanwandee T, Tao QM, Shue K, Keene ON, et al. Lamivudine for patients with chronic hepatitis B and advanced liver disease. N Engl J Med 2004; 351: 1521-31.
8. Schiff E, Simsek H, Lee WM, Chao YC, Sette H Jr, Janssen HL, Han SH, Goodman Z, Yang J, BrettSmith H, et al. Efficacy and safety of entecavir in patients with chronic hepatitis B and advanced hepatic fibrosis or cir- rhosis. Am J Gastroenterol 2008; 103: 2776-83.
9. Iloeje UH, Yang HI, Su J, Jen CL, You SL, Chen CJ; Risk Evaluation of Vi
ral Load Elevation and Associated Liver Disease/CancerIn HBV (the REVEALHBV) Study Group. Predicting cirrhosis risk based on the level of circulating hepatitis B viral load. Gastroenterology 2006; 130: 678-86.
10. Chen CJ, Yang HI, Su J, Jen CL, You SL, Lu SN, Huang GT, Iloeje UH;
REVEALHBV Study Group. Risk of hepatocellular carcinoma across a biological gradient of serum hepatitis B virus DNA level. JAMA 2006;
295: 65-73.
11. Guido M, Rugge M. Liver biopsy sampling in chronic viral hepatitis. Se- min Liver Dis 2004; 24: 89-97.
12. Martínez SM, Crespo G, Navasa M, Forns X. Noninvasive assessment of liver fibrosis. Hepatology 2011; 53: 325-35.
13. Sandrin L, Fourquet B, Hasquenoph JM, Yon S, Fournier C, Mal F, Chris
tidis C, Ziol M, Poulet B, Kazemi F, et al. Transient elastography: a new
noninvasive method for assessment of hepatic fibrosis. Ultrasound Med Biol 2003; 29: 1705-13.
14. Kim BK, Kim SU, Kim HS, Park JY, Ahn SH, Chon CY, Cho IR, Joh DH, Park YN, Han KH, et al. Prospective validation of FibroTest in compari- son with liver stiffness for predicting liver fibrosis in Asian subjects with chronic hepatitis B. PLoS One 2012; 7: e35825.
15. Park SH. Trends in the seroprevalence of hepatitis B surface antigen in the South Korean population. Int J Infect Dis 2012; 16: e669-72.
16. Yoo BC, Park JW, Kim HJ, Lee DH, Cha YJ, Park SM. Precore and core promoter mutations of hepatitis B virus and hepatitis B e antigen-nega- tive chronic hepatitis B in Korea. J Hepatol 2003; 38: 98-103.
17. Lok AS, McMahon BJ. Chronic hepatitis B: update 2009. Hepatology 2009; 50: 661-2.
18. Poynard T, Mathurin P, Lai CL, Guyader D, Poupon R, Tainturier MH, Myers RP, Muntenau M, Ratziu V, Manns M, et al. A comparison of fi- brosis progression in chronic liver diseases. J Hepatol 2003; 38: 257-65.
19. Jung KS, Kim SU, Ahn SH, Park YN, Kim do Y, Park JY, Chon CY, Choi EH, Han KH. Risk assessment of hepatitis B virus-related hepatocellular carcinoma development using liver stiffness measurement (FibroScan).
Hepatology 2011; 53: 885-94.
20. Bedossa P, Dargère D, Paradis V. Sampling variability of liver fibrosis in chronic hepatitis C. Hepatology 2003; 38: 1449-57.
21. GanneCarrié N, Ziol M, de Ledinghen V, Douvin C, Marcellin P, Cas
tera L, Dhumeaux D, Trinchet JC, Beaugrand M. Accuracy of liver stiff- ness measurement for the diagnosis of cirrhosis in patients with chronic liver diseases. Hepatology 2006; 44: 1511-7.
22. FriedrichRust M, Ong MF, Martens S, Sarrazin C, Bojunga J, Zeuzem S, Herrmann E. Performance of transient elastography for the staging of liver fibrosis: a meta-analysis. Gastroenterology 2008; 134: 960-74.
23. Chon YE, Choi EH, Song KJ, Park JY, Kim do Y, Han KH, Chon CY, Ahn SH, Kim SU. Performance of transient elastography for the staging of liver fibrosis in patients with chronic hepatitis B: a meta-analysis. PLoS One 2012; 7: e44930.
24. Coco B, Oliveri F, Maina AM, Ciccorossi P, Sacco R, Colombatto P, Boni
no F, Brunetto MR. Transient elastography: a new surrogate marker of liver fibrosis influenced by major changes of transaminases. J Viral Hep- at 2007; 14: 360-9.
25. Kim SU, Seo YS, Cheong JY, Kim MY, Kim JK, Um SH, Cho SW, Paik SK, Lee KS, Han KH, et al. Factors that affect the diagnostic accuracy of liver fibrosis measurement by Fibroscan in patients with chronic hepatitis B.
Aliment Pharmacol Ther 2010; 32: 498-505.
26. Chan HL, Wong GL, Choi PC, Chan AW, Chim AM, Yiu KK, Chan FK, Sung JJ, Wong VW. Alanine aminotransferase-based algorithms of liver stiffness measurement by transient elastography (Fibroscan) for liver fi- brosis in chronic hepatitis B. J Viral Hepat 2009; 16: 36-44.
27. Marcellin P, Gane E, Buti M, Afdhal N, Sievert W, Jacobson IM, Wash
ington MK, Germanidis G, Flaherty JF, Schall RA, et al. Regression of cir- rhosis during treatment with tenofovir disoproxil fumarate for chronic hepatitis B: a 5-year open-label follow-up study. Lancet 2013; 381: 468- 75.