ISSN 2234-3806 • eISSN 2234-3814
https://doi.org/10.3343/alm.2018.38.4.348
Diagnosis of Liver Fibrosis With Wisteria floribunda Agglutinin-Positive Mac-2 Binding Protein (WFA- M2BP) Among Chronic Hepatitis B Patients
Dong Wook Jekarl, M.D.1,6, Hyunyu Choi, B.S.1, Seungok Lee, M.D.1,6, Jung Hyun Kwon, M.D.2, Sung Won Lee, M.D.3, Hein Yu, M.T.4, Myungshin Kim, M.D.4,6, Yonggoo Kim, M.D.4,6, Pil Soo Sung, M.D.5, and Seung Kew Yoon, M.D.5
Departments of Laboratory Medicine1 and Internal Medicine2, Incheon St. Mary’s Hospital, College of Medicine, The Catholic University of Korea, Seoul;
Department of Internal Medicine3, Bucheon St. Mary’s Hospital, College of Medicine, The Catholic University of Korea, Seoul; Departments of Laboratory Medicine4 and Internal Medicine5, Seoul St. Mary’s Hospital, College of Medicine, The Catholic University of Korea, Seoul; Laboratory for Development and Evaluation Center6, College of Medicine, The Catholic University of Korea, Seoul, Korea
Background: Wisteria floribunda agglutinin-positive Mac-2 binding protein (WFA-M2BP) is a protein with altered glycosylation that reacts with lectin, and was recently identified as a useful non-invasive biomarker for the diagnosis of liver fibrosis in patients with hepatitis C virus infection.This study aimed to evaluate the diagnostic efficacy of WFA-M2BP for liver fibrosis in the context of hepatitis B virus (HBV).
Methods: We enrolled 151 patients infected with HBV. Liver biopsy and elastography (Fi- broscan) were performed during the initial visit. Fibrosis was graded according to the Knodell histologic activity index (F0–3). WFA-M2BP levels were determined with an automated immunoassay analyzer (M2BPGi, HISCL-5000, Sysmex, Japan). The diagnostic efficacy of WFA-M2BP was compared with those of various conventional or composite biomarkers, including enhanced liver fibrosis (ELF) score, Fibroscan, aspartate transaminase (AST)-to- platelet ratio index (APRI), and FIB-4, based on the area under the ROC curve (AUC) value.
Results: The majority of patients were at fibrosis stages F1 and F2. The F2 and F3 AUC values for WFA-M2BP were similar to those for FIB-4, APRI, ELF, and Fibroscan, although the latter showed the best diagnostic efficacy. The diagnostic accuracy of all tested bio- markers for F2 and F3 was 60–70%. In multivariate analysis, WFA-M2BP, ELF, and plate- let count significantly predicted stage ≥F2, whereas only platelet count significantly pre- dicted F3.
Conclusions: WFA-M2BP can support a diagnosis of liver fibrosis with similar diagnostic efficacy to other biomarkers, and predicted liver fibrosis stage ≥2 among patients with chronic hepatitis B.
Key Words: Liver Fibrosis, Hepatitis B, Wisteria floribunda agglutinin-positive Mac-2 bind- ing protein, Diagnosis, Efficacy
Received: June 6, 2017
Revision received: November 3, 2017 Accepted: February 27, 2018 Corresponding author: Yonggoo Kim Department of Laboratory Medicine, Seoul St. Mary’s Hospital, College of Medicine, The Catholic University of Korea, 222 Banpo-daero, Seocho-gu, Seoul 06591, Korea
Tel: +82-2-2258-1642 Fax: +82-2-2285-1917 E-mail: [email protected]
Co-corresponding author: Seung Kew Yoon Department of Internal Medicine, Seoul St.
Mary’s Hospital, College of Medicine, The Catholic University of Korea, 222 Banpo- daero, Seocho-gu, Seoul 06591, Korea Tel: +82-2-2258-7534
Fax: +82-2-536-9559 E-mail: [email protected]
© Korean Society for Laboratory Medicine This is an Open Access article distributed under the terms of the Creative Commons Attribution Non-Commercial License (http://creativecom- mons.org/licenses/by-nc/4.0) which permits unrestricted non-commercial use, distribution, and reproduction in any medium, provided the original work is properly cited.
INTRODUCTION
Liver fibrosis is a common pathologic manifestation of various chronic liver diseases toward the progression of hepatocellular carcinoma. The common causes of liver fibrosis are hepatitis B
and C, alcoholic hepatitis, and nonalcoholic fatty liver disease [1, 2]. Since liver fibrosis progression can be reversed by treatment for hepatitis B and C with antiviral agents [3], early diagnosis of liver fibrosis is important for guiding the treatment response and monitoring and predicting the progression to hepatocellular car-
2017-03-16 https://crossmark-cdn.crossref.org/widget/v2.0/logos/CROSSMARK_Color_square.svg
cinoma.
Antiviral treatments have improved quality of life and treat- ment for patients with chronic hepatitis and liver fibrosis; how- ever, a correct diagnosis of liver fibrosis is required for initiating the appropriate treatment and to predict response and disease prognosis. For this purpose, biomarkers for liver fibrosis and di- agnostic modalities such as elastography have been developed and actively studied [4].
Liver fibrosis is conventionally diagnosed with liver biopsy, im- aging, transient elastography (Fibroscan), and surrogate biomark- ers [4-6]. Liver biopsy is the reference standard for the diagno- sis of liver fibrosis based on histopathological grading [7, 8], but informative data from the liver biopsy can be obscured because of a biopsy of small size, focal sampling and patient compliance [5]. Histologic diagnosis requires an experienced observer, and is hindered by inter-observer and intra-observer variations [5].
Liver stiffness measurement by Fibroscan utilizes wave and shear- wave velocity and has provided robust results in staging fibrosis, informing treatment strategies, prognostic predictions, and dis- ease monitoring [3, 6].
Surrogate markers for liver fibrosis have been developed us- ing measurements of various biomarkers [4, 9]. The most com- mon indirect markers related to liver fibrosis include AST, ALT, platelet count, and marker combinations [10, 11]. Direct mark- ers can be categorized as matrix-related markers, cytokines [12], and marker combinations [4, 11]. The most well-studied direct markers of fibrosis are hyaluronic acid (HA), metalloproteinase, transforming growth factor-beta, and the enhanced liver fibrosis test (ELF, Siemens Healthcare Diagnostics, NY, USA), which is a combination of HA, type III procollagen amino terminal peptide (P3NP), and tissue inhibitor of metalloproteinase I (TIMP1). In addition, combinations of direct or indirect biomarkers with or without demographic data have been used to predict liver fibro- sis [13-17].
Recently, Wisteria floribunda agglutinin-positive Mac-2 bind- ing protein with glycosylated isomers (WFA-M2BP), which is known to be secreted from the liver during fibrosis progression, has been developed as a biomarker for fibrosis [18-21]. This method involves an automated immunoassay to detect the ab- normal glycosylation related to liver fibrosis that becomes agglu- tinated and can be detected by lectin [20]. Expression of abnor- mal glycosylation structures on the M2BP surface is detected by lectin from W. floribunda. In this assay, lectin is bound to a magnet with washing to decrease background signals. As M2BP shows abnormal glycosylation throughout the progression of liver fibrosis, this biomarker offers a new modality for diagnosis [20].
However, the majority of studies on WFA-M2BP as a biomarker have been performed for patients infected with hepatitis C virus, and there are few reports on the diagnostic efficacy of WFA-M2BP for patients infected with hepatitis B virus (HBV) [22-24]. In this study, we evaluated and compared the utility of WFA-M2BP, ELF, Fibroscan, and conventional biomarkers, including FIB-4 and the AST-to-platelet ratio (APRI), for the diagnosis of liver fibrosis in patients infected with HBV.
METHODS 1. Patients
This was a single-center retrospective study. The protocol was approved by the Institutional Review Board of Seoul St. Mary’s Hospital. A sorted sample of 151 patients (older than 18 years) diagnosed with chronic hepatitis B and who had a liver biopsy and Fibroscan test performed were enrolled from January 2011 to December 2013 after providing informed consent. Patients were excluded if they had any of the following conditions: previ- ous history of administration of antiviral agents, evidence of an immunocompromised state (e.g., malignancy), liver disease other than chronic hepatitis B, and a previous diagnosis of de- compensated cirrhosis [25]. The serum samples were collected at the time of liver biopsy and stored at –80˚C until measure- ment. The WFA-M2BP and ELF were measured form the frozen serum, and rest of the information was collected from electrical medical records. Chronic hepatitis B was diagnosed by detec- tion of hepatitis B surface antigen (HBsAg) for more than six months. Demographic data, laboratory data, and baseline char- acteristics of patients were collected at the time of initial outpa- tient visit or initial admission (Table 1).
2. WFA-M2BP measurement
The clinical WFA-M2BP assay was performed by using an auto- mated chemiluminescence enzyme immunoassay analyzer (HISCL-5000, Sysmex, Kobe, Japan). The measured result was presented as a cut-off index (COI) calculated as follows:
WFA-M2BP COI= (WFA-M2BPsample–WFA-M2BPnc)/(WFA- M2BPpc–WFA-M2BPnc),
where WFA-M2BPsample is the measured value of patient serum sample, WFA-M2BPnc is the negative control value, and WFA- M2BPpc is the positive control, which was provided by the man- ufacturer. WFA-M2BP was graded as follows: COI<1.0, grade 0;
1≤COI<3.0, grade 1; 3.0≤COI, grade 2.
The precision of WFA-M2BP was assessed using CLSI EP05- A03 [26]. High- and low-level control samples provided by the manufacturer were measured in duplicate, twice a day, in ana- lytical runs for 20 working days according to the manufacturer’s instructions. R program (Free Software Foundation, Inc., Bos- ton, USA) was utilized for statistical analysis.
The imprecision and repeatability of WFA-M2BP measurements for high- and low-level controls were estimated at 4.87% and 4.15%, respectively. Between-run and between-day imprecision were both less than 5%. However, within-laboratory imprecision, which is the sum of the repeatability, between-run, and between- day precision, was slightly higher at 7.12% and 6.91% for the
high and low controls, respectively.
3. Liver biopsy and pathologic interpretation
An ultrasound-guided parenchymal liver biopsy was performed for all enrolled patients by a clinician or radiologist at the time of collecting serum samples. After local anesthesia, the cutting needle was fired to the targeted region under guidance of ultra- sound imaging. A tissue sample longer than 2 cm was stained and scored for the degree of fibrosis according to the Knodell histologic activity index (HAI) as follows: F0, none; F1, fibrous portal expansion; F2, bridging fibrosis; and F3, cirrhosis [2, 3].
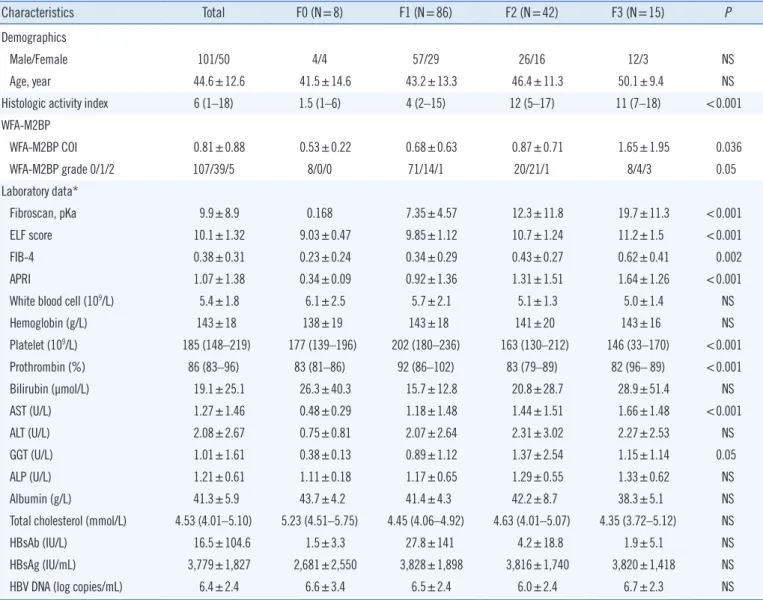
Table 1. Baseline characteristics, WFA-M2BP, and laboratory data of patients with different grades of fibrosis
Characteristics Total F0 (N=8) F1 (N=86) F2 (N=42) F3 (N=15) P
Demographics
Male/Female 101/50 4/4 57/29 26/16 12/3 NS
Age, year 44.6±12.6 41.5±14.6 43.2±13.3 46.4±11.3 50.1±9.4 NS
Histologic activity index 6 (1–18) 1.5 (1–6) 4 (2–15) 12 (5–17) 11 (7–18) <0.001
WFA-M2BP
WFA-M2BP COI 0.81±0.88 0.53±0.22 0.68±0.63 0.87±0.71 1.65±1.95 0.036
WFA-M2BP grade 0/1/2 107/39/5 8/0/0 71/14/1 20/21/1 8/4/3 0.05
Laboratory data*
Fibroscan, pKa 9.9±8.9 0.168 7.35±4.57 12.3±11.8 19.7±11.3 <0.001
ELF score 10.1±1.32 9.03±0.47 9.85±1.12 10.7±1.24 11.2±1.5 <0.001
FIB-4 0.38±0.31 0.23±0.24 0.34±0.29 0.43±0.27 0.62±0.41 0.002
APRI 1.07±1.38 0.34±0.09 0.92±1.36 1.31±1.51 1.64±1.26 <0.001
White blood cell (109/L) 5.4±1.8 6.1±2.5 5.7±2.1 5.1±1.3 5.0±1.4 NS
Hemoglobin (g/L) 143±18 138±19 143±18 141±20 143±16 NS
Platelet (109/L) 185 (148–219) 177 (139–196) 202 (180–236) 163 (130–212) 146 (33–170) <0.001
Prothrombin (%) 86 (83–96) 83 (81–86) 92 (86–102) 83 (79–89) 82 (96– 89) <0.001
Bilirubin (μmol/L) 19.1±25.1 26.3±40.3 15.7±12.8 20.8±28.7 28.9±51.4 NS
AST (U/L) 1.27±1.46 0.48±0.29 1.18±1.48 1.44±1.51 1.66±1.48 <0.001
ALT (U/L) 2.08±2.67 0.75±0.81 2.07±2.64 2.31±3.02 2.27±2.53 NS
GGT (U/L) 1.01±1.61 0.38±0.13 0.89±1.12 1.37±2.54 1.15±1.14 0.05
ALP (U/L) 1.21±0.61 1.11±0.18 1.17±0.65 1.29±0.55 1.33±0.62 NS
Albumin (g/L) 41.3±5.9 43.7±4.2 41.4±4.3 42.2±8.7 38.3±5.1 NS
Total cholesterol (mmol/L) 4.53 (4.01–5.10) 5.23 (4.51–5.75) 4.45 (4.06–4.92) 4.63 (4.01–5.07) 4.35 (3.72–5.12) NS
HBsAb (IU/L) 16.5±104.6 1.5±3.3 27.8±141 4.2±18.8 1.9±5.1 NS
HBsAg (IU/mL) 3,779±1,827 2,681±2,550 3,828±1,898 3,816±1,740 3,820±1,418 NS
HBV DNA (log copies/mL) 6.4±2.4 6.6±3.4 6.5±2.4 6.0±2.4 6.7±2.3 NS
*Continuous variables are presented as mean±standard deviation, and non-normally distributed variables are presented as median with interquartile range.
Comparisons among groups were performed using the Kruskal-Wallis and chi-square tests for continuous and discrete variables, respectively.
Abbreviations: WFA-M2BP, Wisteria floribunda agglutinin-positive Mac-2 binding protein; APRI, AST-to-platelet ratio; ELF score, enhanced liver fibrosis score;
GGT, gamma-glutamyl transferase; ALP, alkaline phosphatase; HBsAb, hepatitis B surface antibody; HBsAg, hepatitis B surface antigen; HBV, hepatitis B virus.
4. Transient elastography (Fibroscan)
Liver stiffness was measured at the time of collecting serum sam- ples according to transient elastography with Fibroscan (Echo- sens, Paris, France) based on wave and shear-wave velocity. The probe was vertically positioned at the intercostal spaces above the right lobe of the liver, and the shear-wave velocity, expressed in kilopascals, was measured more than 10 times. The median and interquartile range for the shear-wave velocity were automati- cally recorded. The result was accepted when the interquartile value divided by the median value was less than 0.3 [3, 6].
5. Laboratory examination
Laboratory data were collected at the time of the initial visit or upon initial admission to the hospital. Complete blood count re- sults, including hemoglobin, white blood cell count, platelet count, and prothrombin time, and blood chemistry data were recorded.
HBV DNA copy level was measured using automated prepara- tion of DNA and real-time PCR kits (Abbott, Illinois, USA). The ELF test, which consisted of HA, P3NP, and TIMP1, was mea- sured using an ADVIA Centaur XP automated immunoassay an- alyzer (Siemens Healthcare Diagnostics, NY, USA). The FIB-4 and APRI scoreswere calculated using laboratory data as follows [23, 26]:
FIB-4=(age×AST)/(platelet×√ALT)
APRI= [(AST/upper limit of normal range of AST)×100]/
platelet×109/L
6. Statistical analysis
Demographic data and baseline characteristics are presented as mean values with standard deviations for continuous vari- ables and parameters following non-normal distribution were listed as median and interquartile range. Comparison of each group was performed using the Kruskal-Wallis and Chi-square test for continuous and discrete variables, respectively. Diagnos- tic accuracy was analyzed using ROC curves. The ROC curves of WFA-M2BP, FIB-4, APRI, ELF, and Fibroscan were compared using a non-parametric method. As cut-off values, the maximum area under the ROC curve (AUC) was selected and estimated with the SE of the AUC value. The sensitivity, specificity, positive and negative predictive values (PPV and NPV, respectively), and accuracies were calculated with a 95% confidence interval.
To predict fibrosis stage ≥2 or 3, univariate and multivariate analyses were performed using logistic regression. All variables were entered using the backward Wald method. All remaining statistical analyses were performed using Medcalc software ver- sion 9.0 (Medcalc, Mariakerke, Belgium).
RESULTS
1. Baseline characteristics and comparison of patients at different fibrosis stages
As shown in Table 1, the majority of patients were determined to be at fibrosis stage F1, followed by F2, F3, and F0 based on his- tologic activity. In addition, the majority of patients were in WFA-
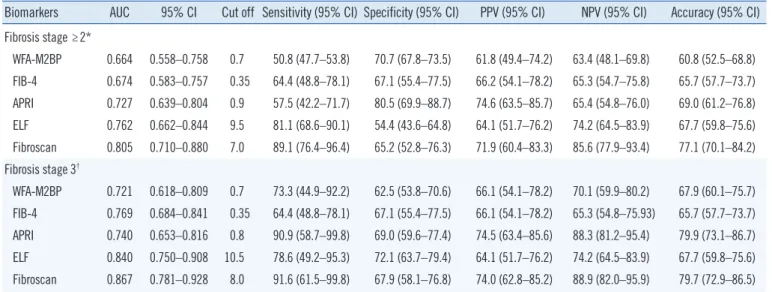
Table 2. Diagnostic capability of WFA-M2BP and other biomarkers
Biomarkers AUC 95% CI Cut off Sensitivity (95% CI) Specificity (95% CI) PPV (95% CI) NPV (95% CI) Accuracy (95% CI) Fibrosis stage ≥2*
WFA-M2BP 0.664 0.558–0.758 0.7 50.8 (47.7–53.8) 70.7 (67.8–73.5) 61.8 (49.4–74.2) 63.4 (48.1–69.8) 60.8 (52.5–68.8) FIB-4 0.674 0.583–0.757 0.35 64.4 (48.8–78.1) 67.1 (55.4–77.5) 66.2 (54.1–78.2) 65.3 (54.7–75.8) 65.7 (57.7–73.7) APRI 0.727 0.639–0.804 0.9 57.5 (42.2–71.7) 80.5 (69.9–88.7) 74.6 (63.5–85.7) 65.4 (54.8–76.0) 69.0 (61.2–76.8) ELF 0.762 0.662–0.844 9.5 81.1 (68.6–90.1) 54.4 (43.6–64.8) 64.1 (51.7–76.2) 74.2 (64.5–83.9) 67.7 (59.8–75.6) Fibroscan 0.805 0.710–0.880 7.0 89.1 (76.4–96.4) 65.2 (52.8–76.3) 71.9 (60.4–83.3) 85.6 (77.9–93.4) 77.1 (70.1–84.2) Fibrosis stage 3†
WFA-M2BP 0.721 0.618–0.809 0.7 73.3 (44.9–92.2) 62.5 (53.8–70.6) 66.1 (54.1–78.2) 70.1 (59.9–80.2) 67.9 (60.1–75.7) FIB-4 0.769 0.684–0.841 0.35 64.4 (48.8–78.1) 67.1 (55.4–77.5) 66.1 (54.1–78.2) 65.3 (54.8–75.93) 65.7 (57.7–73.7) APRI 0.740 0.653–0.816 0.8 90.9 (58.7–99.8) 69.0 (59.6–77.4) 74.5 (63.4–85.6) 88.3 (81.2–95.4) 79.9 (73.1–86.7) ELF 0.840 0.750–0.908 10.5 78.6 (49.2–95.3) 72.1 (63.7–79.4) 64.1 (51.7–76.2) 74.2 (64.5–83.9) 67.7 (59.8–75.6) Fibroscan 0.867 0.781–0.928 8.0 91.6 (61.5–99.8) 67.9 (58.1–76.8) 74.0 (62.8–85.2) 88.9 (82.0–95.9) 79.7 (72.9–86.5)
*Exact cut-off values of the tested biomarkers are as follows: WFA-M2BP, 0.76; FIB-4, 0.36; APRI, 0.9; ELF, 9.59; Fibroscan, 6.8; †Exact cut-off values of the tested biomarkers are as follows: WFA-M2BP, 0.71; FIB-4, 0.36; APRI, 0.84; ELF, 10.58; Fibroscan, 8.3.
Abbreviations: AUC, area under the receiver operating characteristic curve; CI, confidence interval; PPV, positive predictive value; NPV, negative predictive value; WFA-M2BP, Wisteria floribunda agglutinin-positive Mac-2 binding protein; APRI, AST-to-platelet ratio; ELF, enhanced liver fibrosis score.
M2BP grade 0, followed by grade 1 and grade 2. The WFA-M2BP, FIB-4, APRI, ELF, and Fibroscan results showed statistically sig- nificant differences among different fibrosis levels. With respect to the laboratory data, platelet count, prothrombin, AST, and gamma-glutamyl transferase values showed significant differ- ences among fibrosis stages.
2. Diagnosis of liver fibrosis stage ≥2 or 3 by ROC curve analysis
The AUC, sensitivity, specificity, PPV, NPV, and accuracy values are listed in Table 2. Pairwise statistical comparison of ROC curves revealed that only WFA-M2BP and Fibroscan significantly differed
with respect to the ability of diagnosing fibrosis stage ≥2 (P =0.019);
none of the other biomarkers or their combinations showed sta- tistically significant differences in diagnostic ability. Among the biomarkers tested, Fibroscan revealed the highest AUC values, and WFA-M2BP, FIB-4, APRI, and ELF revealed similar results for the diagnosis of fibrosis stage ≥2. However, none of the mark- ers showed statistically significant differences for the diagnosis of fibrosis stage 3 based on pairwise comparison of ROC curves.
Specifically, WFA-M2BP, FIB-4, APRI, ELF, and Fibroscan re- vealed similar AUC values of approximately 0.7–0.8, with no statistical significance. The tested biomarkers revealed an over- all diagnostic accuracy of approximately 60–70% for the diag-
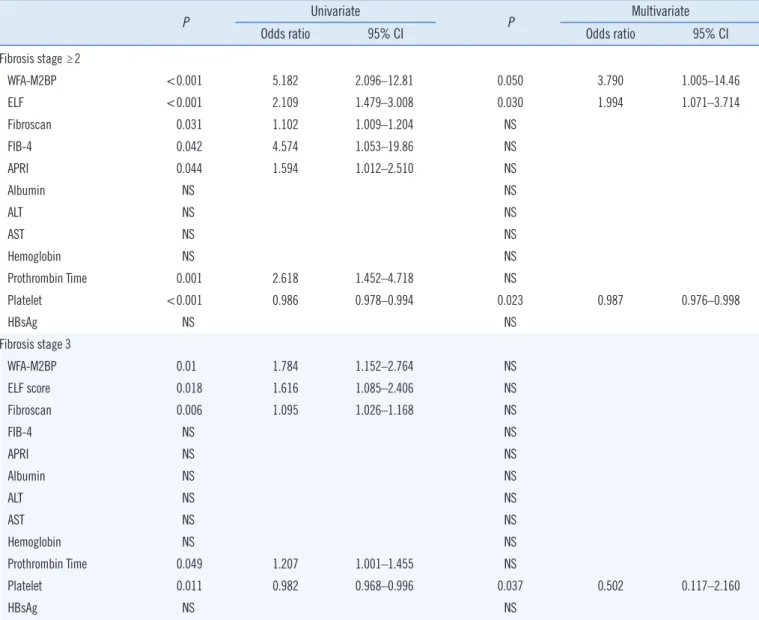
Table 3. Univariate and multivariate analyses for predicting liver fibrosis stage ≥2 and 3
P Univariate
P Multivariate
Odds ratio 95% CI Odds ratio 95% CI
Fibrosis stage ≥2
WFA-M2BP <0.001 5.182 2.096–12.81 0.050 3.790 1.005–14.46
ELF <0.001 2.109 1.479–3.008 0.030 1.994 1.071–3.714
Fibroscan 0.031 1.102 1.009–1.204 NS
FIB-4 0.042 4.574 1.053–19.86 NS
APRI 0.044 1.594 1.012–2.510 NS
Albumin NS NS
ALT NS NS
AST NS NS
Hemoglobin NS NS
Prothrombin Time 0.001 2.618 1.452–4.718 NS
Platelet <0.001 0.986 0.978–0.994 0.023 0.987 0.976–0.998
HBsAg NS NS
Fibrosis stage 3
WFA-M2BP 0.01 1.784 1.152–2.764 NS
ELF score 0.018 1.616 1.085–2.406 NS
Fibroscan 0.006 1.095 1.026–1.168 NS
FIB-4 NS NS
APRI NS NS
Albumin NS NS
ALT NS NS
AST NS NS
Hemoglobin NS NS
Prothrombin Time 0.049 1.207 1.001–1.455 NS
Platelet 0.011 0.982 0.968–0.996 0.037 0.502 0.117–2.160
HBsAg NS NS
Abbreviations: CI, confidence interval; WFA-M2BP, Wisteria floribunda agglutinin-positive Mac-2 binding protein; APRI, AST-to-platelet ratio; ELF, enhanced liver fibrosis; HBsAg, hepatitis B surface antigen; NS, not significant.
nosis of fibrosis stage ≥2 and 3, respectively. The comparison of the tested markers for the diagnosis of fibrosis stage ≥2 and 3 is shown as box plots in Supplemental Data Fig. S1 and S2, respectively. WFA-M2BP, APRI, and ELF showed significant predictive ability for fibrosis stage ≥2, whereas ELF showed sig- nificant predictive ability for fibrosis stage 3.
3. Predictive factors of liver fibrosis stage ≥2 and 3
The most useful predictors of fibrosis stage ≥2 and 3 were eval- uated among WFA-M2BP, ELF score, Fibroscan, albumin, ALT, AST, hemoglobin, prothrombin time, platelet count, and HBsAg (Table 3). Univariate analysis showed that WFA-M2BP, ELF, Fi- broscan, FIB-4, APRI, prothrombin time, and platelet count were significantly associated with fibrosis stage ≥2, whereas WFA-M2BP, ELF, Fibroscan, prothrombin time, and platelet count were significantly associated with fibrosis stage 3. Multi- variate analysis was performed using the factors that emerged as significant in the univariate analysis, which revealed that WFA-M2BP, ELF, and platelet could predict liver fibrosis stage
≥2 with an odds ratio of 3.790, 1.994, and 0.987, respectively.
Only platelet count remained a statistically significant predictor of fibrosis stage 3 in multivariate analysis, with an odds ratio of 0.502.
DISCUSSION
Although the mechanisms and incidence of fibrosis regression remain controversial, there is growing evidence that fibrosis typi- cally regresses by more than 1 score after nucleoside therapy in patients infected with HBV [4]. Therefore, diagnosis of fibrosis stage 2 and 3 is important for patient follow-up. In addition, the diagnosis of fibrosis stage 3 by WFA-M2BP has been reported to be related to the development of hepatocellular carcinoma among patients infected with HCV and HBV [19, 21]. Although additional data are required, establishing a firm association be- tween WFA-M2BP and hepatocellular carcinoma could repre- sent a breakthrough in early cancer diagnosis.
Our findings indicate that the newly developed WFA-M2BP biomarker can be useful for the diagnosis of liver fibrosis in pa- tients with chronic hepatitis B. As WFA-M2BP represents a sin- gle biomarker and has not been associated with any particular technical issues, it could be a relatively efficient biomarker. Al- though a combination of biomarkers or a composite biomarker for liver fibrosis could increase the diagnostic accuracy, this might lead to complications in generating data and maintaining the quality of results.
This study included patients with chronic HBV infection in con- trast to previous studies on WFA-M2BP that mainly focused on patients with chronic hepatitis C. Globally, the prevalence of chronic HBV infection ranges from 0.03% to 22.7%, depending on the country [27, 28], whereas HCV has a worldwide preva- lence of 0.9–6.0% [29, 30]. Additional studies are required to improve the diagnosis of liver fibrosis among chronic hepatitis B patients in various geographic regions. In addition, the AUC value of WFA-M2BP for the HBV patients in the present study are simi- lar but somewhat lower than those reported for HCV patients [22- 24]. The reason for this difference is unclear, requiring further studies.
Univariate and multivariate analyses revealed that WFA-M2BP, ELF, and platelet count could predict liver fibrosis stage ≥2. Fi- broscan, which demonstrated the highest AUC value, was not statistically significant in our model. The odds ratio of WFA-M2BP was 3.790, which was the highest among the tested biomark- ers, which could support the diagnosis and prediction of liver fi- brosis. However, only platelet count emerged as a significant pre- dictor of liver fibrosis stage 3 in the multivariate analysis, which is in line with previous results [31].
The chief limitations of this study are the relatively small sam- ple size (N=151) and the lack of prognostic analysis for predict- ing hepatocellular carcinoma due to the short period among the enrolled HBV patients. In addition, approximately 50% of the patients were diagnosed with a fibrosis score of 1, resulting in unbalanced patient numbers across the fibrosis grades; there- fore, comparison of each stage could not be performed.
In conclusion, WFA-M2BP can support a diagnosis of liver fi- brosis and demonstrated discriminative properties for chronic hepatitis B patients at different stages of liver fibrosis. Further studies with larger sample sizes are required to validate the clin- ical application of WFA-M2BP.
Authors’ Disclosures of Potential Conflicts of Interest
The authors declare that they have no conflicting interests.
Acknowledgment
We thank Chankyu Kim for clinical and technical advice. We also thank Sujung Kim, PilHoon Jeong, Sung Gil Kim, and Dong Hwan Kim for technical assistance.
REFERENCES
1. Ge PS and Runyon B. Treatment of patients with Cirrhosis. N Engl J Med 2016;375:767-77.
2. Rosenberg W, Voelker M, Thiel R, Becka M, Burt A, Schuppan D, et al.
Serum markers detect the presence of liver fibrosis: a cohort study. Gas- troenterology 2004;127:1704-13.
3. Ellis E and Mann D. Clinical evidence for the regression of liver fibrosis.
J Hepatol 2012;56:1171-80.
4. Ahmad W, Ijaz B, Gull S, Asad S, Khaliq S, Jahan S, et al. A brief review on molecule, genetic and imaging techniques for HCV fibrosis evalua- tion. Virol J 2011;8:53-69.
5. Castera L and Pinzani M. Biopsy and non-invasive methods for the di- agnosis of liver fibrosis: does it take two to tango? Gut 2010;59:861-6.
6. Jung KS, Kim SU, Ahn SH, Park YN, Kim DY, Park JY, et al. Risk assess- ment of hepatitis B virus-related hepatocellular carcinoma development using liver stiffness measurement (Fibroscan). Hepatology 2011;53:885- 94.
7. Theise N. Liver biopsy assessment in chronic viral hepatitis: a personal, practical approach. Mod Pathol 2007;20:S3-14.
8. Brunt EM. Grading and staging the histopathological lesions of chronic hepatitis: the Knodell histology activity index and beyond. Hepatology 2000;31:241-6.
9. Parkes J, Guha IN, Harris S, Rosenberg W, Roderick P. Systematic re- view of the diagnostic performance of serum markers of liver fibrosis in alcoholic liver disease. Comp Hepatol 2012;11:1-20.
10. Schuppan D and Afdhal N. Liver cirrhosis. Lancet 2008;371:838-51.
11. Poynard T, Halfon P, Castera L, Munteanu M, Imbert-Bismut F, Ratzui V, et al. Standardization of ROC curve areas for diagnostic evaluation of liver fibrosis markers based on prevalences of liver fibrosis stages. Clin Chem 2007;53:1615-22.
12. Mallat A and Lotersztajn S. Cellular mechanisms of tissue fibrosis. 5.
Novel insights into liver fibrosis. Am J Physiol Cell Physiol 2013;305:
C789-99.
13. Nobili V, Parkes J, Bottazzo G, Marcelini M, Cross R, Newman D, et al.
Performance of ELF serum markers in predicting fibrosis stage in pedi- atric non-alcoholic fatty liver disease. Gastroenterology 2009;136:160-7.
14. Guechot J, Trocme C, Renversez JC, Sturm N, Zarski JP, ANRS HC EP 23 Fibrostar Study Group. Independent validation of the enhanced liver fibrosis (ELF) score in the ANRS HC EP 23 Fibrostar cohort of patients with chronic hepatitis C. ClinChem Lab Med 2012;50:693-9.
15. Lichtinghagen R, Pietsch D, Bantel H, Manns M, Brand K, Bahr M. The enhanced liver fibrosis (ELF) score: normal values, influence factors and proposed cut off values. J Hepatol 2013;59:236-42.
16. Yoo EJ, Kim BK, Kim SU, Park JY, Kim DY, Ahn SH, et al. Normal en- hanced liver fibrosis (ELF) values in apparently healthy subjects under- going a health check-up and in living liver donors in South Korea. Liver Int 2013;33:706-13.
17. Kim BK, Kim HS, Park JY, Kim DY, Ahn SH, Chon CY, et al. Prospective validation of ELF test in comparison with Fibroscan and FibroTest to pre- dict liver fibrosis in Asian subjects with chronic hepatitis B. PLos One
2012;7:e41964.
18. Kuno A, Ikehara Y, Tanaka Y, Ito K, Matsuda A, Sekiya S, et al. A serum
“sweet-doughnut” protein facilitates fibrosis evaluation and therapy as- sessment I patients with viral hepatitis. Sci Rep 2013;3:1065.
19. Yamasaki K, Tateyama M, Abiru S, Komori A, Nagaoka S, Saeki A, et al.
Elevated serum levels of Wisteria floribunda agglutinin-positive human Mac-2 binding protein predict the development of hepatocellular carci- noma in hepatitis C patients. Hepatology 2014;60:1563-70.
20. Narimatsu H. Development of WFA-M2BP: a novel fibrosis serum gly- col-biomarker for chronic hepatitis/cirrhosis diagnostics. Expert Rev Pro- teomics 2015;12:683-93.
21. Ichikawa Y, Joshita S, Umemura T, Shobugawa Y, Usami Y, Shibata S, et al. Serum Wisteria floribunda agglutinin-positive human Mac-2 bind- ing protein may predict liver fibrosis and progression to hepatocellular carcinoma in patients with chronic hepatitis B virus infection. Hepatol Res 2017;47:226-33.
22. Zou X, Zhu MY, Yu DM, Li W, Zhang DH, Lu FJ, et al. Serum WFA+-M2BP levels for evaluation of early stages of liver fibrosis in patients with chron- ic hepatitis B virus infection. Liver Int 2017;37:35-44.
23. Li Q, Song J, Huang Y, Li X, Zhuo Q, Li W, et al. The gamma-glutamyl- transpeptidase to platelet ratio does not show advantages than APRI and Fib-4 in diagnosing significant fibrosis and cirrhosis in patients with chronic hepatitis B. Medicine 2016;95:e3372.
24. Nishikawa H, Hasegawa K, Ishii A, Takata R, Enomoto H, Yoh K, et al. A proposed predictive model for advanced fibrosis in patients with chronic hepatitis B and its validation. Medicine 2016;95:35(e4679).
25. Boursier J, Ledinghen V, Poynard T, Guechot J, Carrat F, Leroy V, et al.
An extension of STARD statements for reporting diagnostic accuracy studies on liver fibrosis test: The Liver-FibroSTARD standards. J Hepatol 2015;62:807-15.
26. CCLA. Evaluation of precision performance of quantitative measurement methods; approved guideline, 3rd ed. NCCLS document EP5-A3. Wayne, PA: NCCLS, 2014.
27. Jang JW, Choi JY, Kim YS, Woo HY, Choi SK, Lee CH, et al. Long-term effect of antiviral therapy on disease course after decompensation in pa- tients with hepatitis B virus-related cirrhosis. Hepatology 2015;61:1809- 20.
28. Schweitzer A, Horn J, Mikolajczyk RT, Krause G, Ott JJ. Estimation of worldwide prevalence of chronic hepatitis B virus infection: a systematic review of data published between 1965 and 2013. Lancet 2015;386:
1546-55.
29. Hanafiah KM, Groeger J, Flaxmen AD, Wiersma ST. Global epidemiolo- gy of hepatitis C virus infection: new estimates of age-specific antibody to HCV seroprevalence. Hepatology 2013;57:1333-42.
30. Petruzziello A, Marigliano S, Loquercio G, Cozzolino A, Cacciapuoti C.
Global epidemiology of hepatitis C virus infection: an up-date of the dis- tribution and circulation of hepatitis C virus genotypes. World J Gastro- enterol 2016;22:7824-40.
31. Kim YW, Kwon JH, Jang JW, Kim MJ, Oh BS, Chung KW, et al. Diag- nostic usefulness of real-time elastography for liver fibrosis in chronic viral hepatitis B and C. Gastroenterol Res Pract 2014;2104:210407.
Supplemental Data Fig. S1. Box Plot of WFA-M2BP, FIB-4, APRI, ELF, and Fibroscan for fibrosis stage ≥F2.
*P <0.05 based on the Student t-test.
1.2
0.8
0.4
0
F0, F1 F2, F3
WFA-M2BP (C.O.I)
*
1.2 1.0 0.8 0.6 0.4 0.2 0
F0, F1 F2, F3
FIB-4 (Index)
2.5 2.0 1.5 1.0 0.5 0
F0, F1 F2, F3
APRI (Index)
*
12 10 8 6 4 2 0
F0, F1 F2, F3
ELF (Score)
*
16 12 8 4 0
F0, F1 F2, F3
Fibroscan (pKa)
Supplemental Data Fig. S2. Box Plot of WFA-M2BP, FIB-4, APRI, ELF, and Fibroscan for fibrosis stage 3.
*P <0.05 based on the Student t-test.
3.0 2.5 2.0 1.5 1.0 0.5 0
F0–2 F3
WFA-M2BP (C.O.I)
1.0 0.8 0.6 0.4 0.2 0
F0–2 F3
FIB-4 (Index)
2.5 2.0 1.5 1.0 0.5 0
F0–2 F3
APRI (Index)
12 10 8 6 4 2 0
F0–2 F3
ELF (Score)
*
30 25 20 15 10 5 0
F0–2 F3
Fibroscan (pKa)