http://crossmark.crossref.org/dialog/?doi=10.14474/ptrs.2017.6.4.182&domain=pdf&date_stamp=2017-12-25
Received: 27 October, 2017 Revised: 12 November, 2017 Accepted: 12 November, 2017 Corresponding author: Byoung-Hee Lee
Department of Physical Therapy, College of Health Science and Social Welfare, Sahmyook University, 815 Hwarang-ro, Nowon-gu, Seoul 01795, Republic of Korea
Tel: 82-2-3399-1634 Fax: 82-2-3399-1639 E-mail: [email protected]
This is an Open-Access article distributed under the terms of the Creative Commons Attribution Non-Commercial License (http://creativecommons.org/licenses/
by-nc/4.0) which permits unrestricted non-commercial use, distribution, and reproduction in any medium, provided the original work is properly cited.
Copyright © 2017 Korean Academy of Physical Therapy Rehabilitation Science
https://doi.org/10.14474/ptrs.2017.6.4.182 pISSN 2287-7576
eISSN 2287-7584
Phys Ther Rehabil Sci 2017, 6 (4), 182-188 www.jptrs.org
A comparison of ankle function between adults with and without Down syndrome
Hyang-Woon Yoon
a, Tae-Ho Yu
b, U-Hyeok Seo
b, Jee-Won Lee
b, So-Yeon Kim
b, Soo-Jin Chung
b, Hye-Lim Chun
c, Byoung-Hee Lee
baDepartment of Physical Therapy, Hongseong Medical Center, Hongseong, Republic of Korea
bDepartment of Physical Therapy, College of Health Science and Social Welfare, Sahmyook University, Seoul, Republic of Korea
cDepartment of Physical Therapy, Health and Welfare Graduate School, Sahmyook University, Seoul, Republic of Korea
Objective: The purpose of this study was to compare ankle function between adults with and without Down syndrome (DS).
Design: Cross-sectional study.
Methods: Ten adults with DS and 18 without participated in this study and underwent manual muscle test (MMT), range of mo- tion (ROM) assessment, star excursion balance test (SEBT), and functional movement screen (FMS). The tests were demonstrated to increase their accuracy and the actual measurements were assessed after one or two demonstrations. To minimize the standby time and fatigue, the travelled distance and measuring order were adjusted. To remove the influence of shoes on the measurements, the shoes were taken off and only socks were worn.
Results: Dorsal and plantar flexion MMTs of both ankles were significantly weaker and plantar flexion ROM of both ankles were significantly lower in adults with DS compared with those without (p<0.05). However, dorsal flexion ROM of both ankles were not significantly different between them. There were significant differences in distances measured in all the directions (anterior, anterolateral, lateral, posterolateral, posterior, posteromedial, medial, and anteromedial directions) of SEBT (p<0.05). Significant differences were also demonstrated in the scores of hurdle step, inline lunge, shoulder mobility, and rotary stability among the sev- en items of FMS (p<0.05).
Conclusions: To enhance the dynamic stability of adults with DS, it is necessary to improve ankle stability by strengthening the ankle dorsal and plantar flexors.
Key Words: Ankle, Down syndrome, Functional movement screen, Star excursion balance test
Introduction
Down syndrome (DS) is a chromosomal abnormality and can result in significant defects in cognitive and motor de- velopment [1]. Particularly, motor disturbances, such as ab- normal gait and posture adjustments, slow responses to en- vironmental changes, incoordination, and co-contraction of agonistic and antagonistic muscles have been demonstrated [2-4]. Such motor disturbances caused by DS lead to limited physical activities and exercise experience, and, thereby,
cause a delay in sensory development, concepts of move- ment, and social development [5-8].
Balance is the ability to sustain the body’s center of grav- ity within the base of support during minimal motion, and is a fundamental element of posture, gait, and exercise.
Balance is adjusted following the integration of the afferent
information sent from the somatosensory, visual, and ves-
tibular systems in the central nervous system, which induces
reflex control of the eyes and extremities [9]. Therefore, bal-
ance greatly influences independent living and safety of pa-
Figure 1. Star excursion balance test.
tients with DS; it is the motor function that is very difficult for these individuals to acquire [10-12].
Balance is an important factor for the activities of daily living. In cases of balance-related disabilities, movement can be limited, which may have a negative impact on not on- ly the participation in activities of daily living but also the quality of life [13,14]. The stability of the ankle joint is cru- cial to balance [15,16]. Although DS is known to result in congenitally poor ankle stability [17,18], there are no studies that have precisely investigated this topic. The objectives of the present study were to conduct tests of ankle stability, such as the star excursion balance test (SEBT), functional movement screen (FMS), manual muscle test (MMT), and range of motion (ROM) assessment between adults with DS and those without to identify any significant differences, and use the results to propose guidelines of strengthening the muscles that will allow adults with DS to actively participate in their daily lives and social activities. Furthermore, anoth- er objective was to construct a database that can be used as the foundation for developing tests to evaluate the functional movements in adults with DS.
Methods Participants
Twenty-eight participants were enrolled, which included 10 patients (aged 21-31 years) with DS and 18 students (aged 20-24 years) without DS from a university in Seoul. In the process of selecting the subjects, those with hearing and visual problems, musculoskeletal problems, ankle sprain, lower back pain, and history of major surgeries and diseases were excluded.
Procedures
MMT, ROM, SEBT, and FMS were conducted in all participants. Through survey and measurements, the general characteristics, such as sex, age, weight, and height were recorded. After the details of the study were explained, all participants provided their informed consent. The tests were demonstrated to increase their accuracy and the actual meas- urements were recorded after one or two demonstrations.
To minimize the standby time and fatigue, the measuring order and distance travelled were flexibly adjusted. To re- move the influence of shoes on the measurements, they were taken off and only socks were worn.
Measurement tools
MMTMMT is a test conducted to evaluate an individual’s max- imum muscular strength and has been the standard for meas- uring muscular strength of the overall body for a long time [19]. The contractile forces of the muscles involved are strongly related to the MMT score [20]. The extensor mus- cles of the ankle play an important role in gait [21].
ROM
The double-armed universal goniometer was used to measure the active ROM of the ankle joint. The basic pos- ture for this set of tests was as follows: the participant was in the supine position, with the fixed arm positioned with the neutral position of the feet and the working arm positioned parallel to the line connecting the outer side of the heel and the end of the 5th toe.
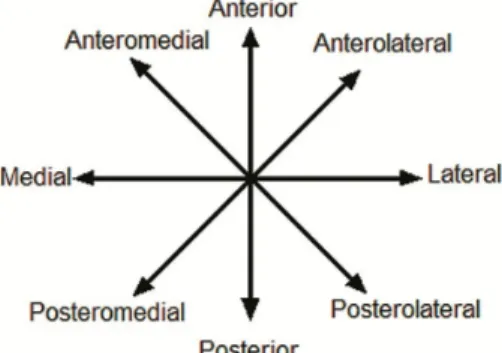
SEBT
SEBT is a test conducted to evaluate the balance of the
subjects by measuring the raised distance while having the
subjects bear their body weight onto one leg and raise the
other leg in 8 directions [22] (Figure 1). While this test is
conducted, the body, the leg bearing the weight, and the
nerves involved must be efficient to maintain movement and
balance over the body’s base of support [23]. SEBT has been
clinically used to accomplish the purpose of research. Parti-
cularly, it is a very reliable and valid tool for measuring the
dynamic balance ability in people with chronic ankle inst-
ability. To conduct SEBT, lines were drawn in 8 directions
(anterior direction, anterolateral direction, lateral direction,
posterolateral direction, posterior direction, posteromedial
direction, medial direction, and anteromedial direction), and
the participant stood at the center of the lines on one leg and
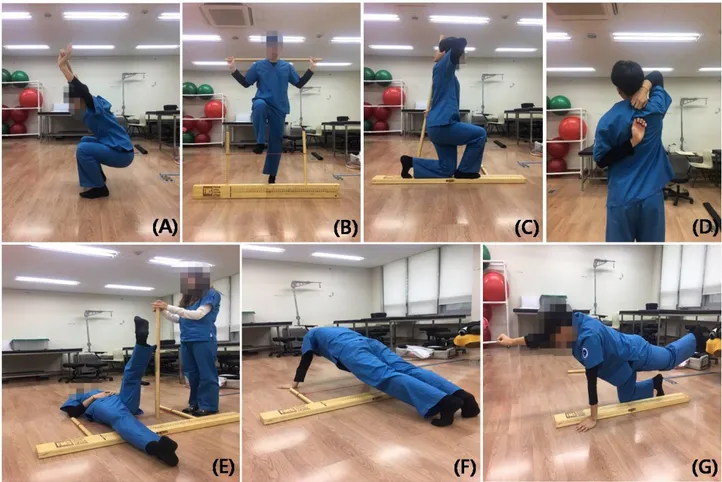
Figure 2. Functional movement screen. (A) Deep squat. (B) Hurdle step. (C) Inline lunge. (D) Shoulder mobility. (E) Active straight leg raise. (F) Trunk stability push-up. (G) Quadruped rotary stability.
raised the other leg as much as possible towards the lines in the clockwise fashion starting from the anterior direction [22].
FMS
FMS is a test conducted to evaluate the seven movements required for balance between mobility and stability (Figure 2). The seven movements are deep squat, hurdle step, inline lunge, shoulder mobility, active straight leg raise, trunk sta- bility push-up, and quadruped rotary stability. In this test, a score ranging from 0 to 3 is assigned for each movement.
The right side and left side are separately tested, and the low- er score between the two is used as the final score. In FMS, all the functional disorders and causes of pain can be re- vealed through the seven basic movements. In case any pain is felt during the test, the test is stopped until it is resumed in the presence of a medical team. Additionally, it is the test that determines the time for patients undergoing rehabilita- tion to return to their daily lives [24,25].
Statistical analysis
IBM SPSS Statistics ver. 20.0 (IBM Co., Armonk, NY, USA) was used to analyze the descriptive statistics and gen- eral characteristics, and the independent t-test was used to compare the data of the tests. The statistical significance lev- el was sea at α=0.05.
Results
General characteristics of the participants
The general characteristics of the participants are shown
in Table 1. Of the 10 adults with DS, 3 were men (30.0%) and
7 women (70.0%), and of the 18 adults without DS, 11 were
men (61.1%) and 7 women (38.9%). The mean age of the
adults with DS was 25.00±2.944 years whereas that of adults
without DS was 21.44±1.580 years. The mean height of the
adults with DS was 153.40±7.675 cm, whereas that of the
adults without DS was 170.52±8.139 cm. The mean weight
of the adults with DS was 65.70±7.675 kg, whereas that of
Table 1. General characteristics of subjects (N=28) Characteristic Adults with DS (n=10) Adults without DS (n=18) Male/female 3 (30.0)/7 (70.0) 11 (61.1)/7 (38.9)
Age (yr) 25.00 (2.944) 21.44 (1.580)
Height (cm) 153.40 (7.675) 170.52 (8.139) Weight (kg) 65.70 (7.675) 64.50 (11.142) Values are presented as n (%) or mean (SD).
DS: Down syndrome.
Table 3. Results of ROM assessments (N=28) Variable Adults with
DS (n=10)
Adults without
DS (n=18) t (p) RDFROM (º) 36.32 (6.425) 38.02 (8.840) 0.534 (0.598) RPFROM (º) 22.36 (6.806) 34.14 (4.637) 5.444 (<0.001) LDFROM (º) 31.86 (8.870) 38.41 (6.580) 2.229 (0.350) LPFROM (º) 25.14 (6.054) 37.43 (4.983) 5.796 (<0.001) Values are presented as mean (SD).
ROM: range of motion, DS: Down syndrome, RDFROM: right dorsi- flexion ROM, RPFROM: right plantarflexion ROM, LDFROM: left dorsiflexion ROM, LPFROM: left plantarflexion ROM.
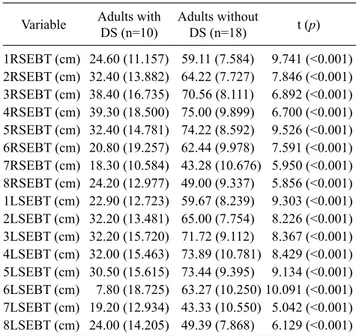
Table 4. Results of the SEBT (N=28)
Variable Adults with DS (n=10)
Adults without
DS (n=18) t (p) 1RSEBT (cm) 24.60 (11.157) 59.11 (7.584) 9.741 (<0.001) 2RSEBT (cm) 32.40 (13.882) 64.22 (7.727) 7.846 (<0.001) 3RSEBT (cm) 38.40 (16.735) 70.56 (8.111) 6.892 (<0.001) 4RSEBT (cm) 39.30 (18.500) 75.00 (9.899) 6.700 (<0.001) 5RSEBT (cm) 32.40 (14.781) 74.22 (8.592) 9.526 (<0.001) 6RSEBT (cm) 20.80 (19.257) 62.44 (9.978) 7.591 (<0.001) 7RSEBT (cm) 18.30 (10.584) 43.28 (10.676) 5.950 (<0.001) 8RSEBT (cm) 24.20 (12.977) 49.00 (9.337) 5.856 (<0.001) 1LSEBT (cm) 22.90 (12.723) 59.67 (8.239) 9.303 (<0.001) 2LSEBT (cm) 32.20 (13.481) 65.00 (7.754) 8.226 (<0.001) 3LSEBT (cm) 32.20 (15.720) 71.72 (9.112) 8.367 (<0.001) 4LSEBT (cm) 32.00 (15.463) 73.89 (10.781) 8.429 (<0.001) 5LSEBT (cm) 30.50 (15.615) 73.44 (9.395) 9.134 (<0.001) 6LSEBT (cm) 7.80 (18.725) 63.27 (10.250) 10.091 (<0.001) 7LSEBT (cm) 19.20 (12.934) 43.33 (10.550) 5.042 (<0.001) 8LSEBT (cm) 24.00 (14.205) 49.39 (7.868) 6.129 (<0.001) Values are presented as mean (SD).
SEBT: star excursion balance test, DS: Down syndrome, 1RSEBT:
right foot towards anterior, 2RSEBT: right foot towards anterola- teral, 3RSEBT: right foot towards lateral, 4RSEBT: right foot towards posterolateral, 5RSEBT: right foot towards posterior, 6RSEBT: right foot towards posteromedial, 7RSEBT: right foot towards medial, 8RSEBT: right foot towards anteromedial, 1LSEBT: left foot towards anterior, 2LSEBT: left foot towards anterolateral, 3LSEBT: left foot towards lateral, 4LSEBT: left foot towards posterolateral, 5LSEBT:
left foot towards posterior, 6LSEBT: left foot towards posteromedial, 7LSEBT: left foot towards medial, 8LSEBT: left foot towards anteromedial.
Table 2. Results of the MMTs (N=28)
Variable Adults with DS (n=10)
Adults without
DS (n=18) t (p)
RD-MMT (kg) 4.15 (3.097) 19.36 (3.982) 10.424 (<0.001) RP-MMT (kg) 3.42 (2.140) 25.92 (12.546) 5.581 (<0.001) LD-MMT (kg) 4.36 (3.610) 19.69 (7.659) 5.938 (<0.001) LP-MMT (kg) 3.84 (2.308) 24.98 (13.079) 5.027 (<0.001) Values are presented as mean (SD).
MMT: manual muscle test, DS: Down syndrome, RD-MMT: right dorsal MMT, RP-MMT: right plantar MMT, LD-MMT: left dorsal MMT, LP-MMT: left plantar MMT.
the adults without DS was 64.50±11.142 kg.
MMT
The results of ankle MMT are shown in Table 2. Right dorsal (RD)-MMT was 4.15±3.097 kg in the adults with DS and 19.36±3.982 kg in those without (p<0.05). Right plantar (RP)-MMT was 3.42±2.140 kg in the adults with DS and 25.92±12.546 kg in those without (p<0.05). Left dorsal (LD)-MMT was 4.36±3.610 kg in the adults with DS and 19.69±7.659 kg in those without (p<0.05). Left plantar (LP)-MMT was 3.84± 2.308 kg in the adults with DS and 24.98±13.079 kg in those without (p<0.05).
ROM
The ROM results of the ankle are demonstrated in Table 3.
Right dorsiflexion ROM (RDFROM) was 36.32°±6.425° in the adults with DS and 38.02°±8.840° in those without, which was not significant (p>0.05). Right plantar flexion ROM (RPFROM) was 22.36°±6.806° in the adults with DS and 34.14°±4.637° in those without (p<0.05). Left dorsi- flexion ROM (LDFROM) was 31.86°±8.870° in the adults with DS and 38.41°±6.580° in those without; the difference was not statistically significant (p>0.05). Left plantar flex- ion ROM (LPFROM) was 25.14°±6.054° in the adults with DS and 37.43°±4.983° in those without (p<0.05).
SEBT
SEBT results are shown in Table 4. Right foot towards the anterior direction on the SEBT (1RSEBT) was 24.60±
11.157 cm in the adults with DS and 59.11±7.584 cm in
those without (p<0.05). Right foot towards the anterolateral
direction (2RSEBT) was 32.40±13.882 cm in the adults with
DS and 64.22±7.727 cm in those without (p<0.05). Right
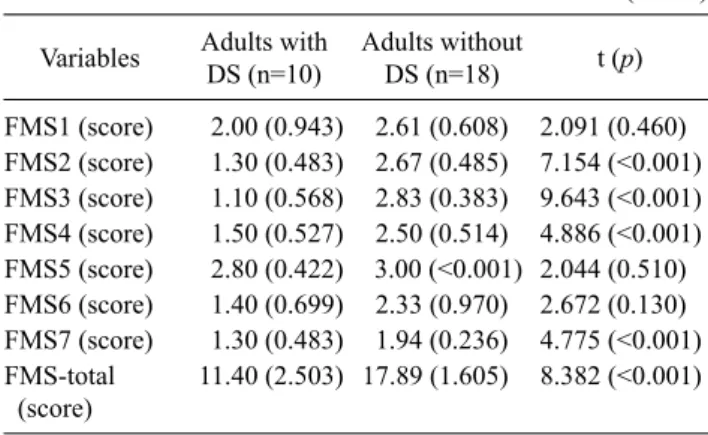
Table 5. Results of FMS (N=28) Variables Adults with
DS (n=10)
Adults without
DS (n=18) t (p) FMS1 (score) 2.00 (0.943) 2.61 (0.608) 2.091 (0.460) FMS2 (score) 1.30 (0.483) 2.67 (0.485) 7.154 (<0.001) FMS3 (score) 1.10 (0.568) 2.83 (0.383) 9.643 (<0.001) FMS4 (score) 1.50 (0.527) 2.50 (0.514) 4.886 (<0.001) FMS5 (score) 2.80 (0.422) 3.00 (<0.001) 2.044 (0.510) FMS6 (score) 1.40 (0.699) 2.33 (0.970) 2.672 (0.130) FMS7 (score) 1.30 (0.483) 1.94 (0.236) 4.775 (<0.001) FMS-total
(score)
11.40 (2.503) 17.89 (1.605) 8.382 (<0.001)
Values are presented as mean (SD).
FMS: functional movement screen, DS: Down syndrome. The scores are representative of individual scores in the following components of FMS-FMS1: deep squat, FMS2: hurdle step, FMS3: inline lunge, FMS4: shoulder mobility, FMS5: active straight leg raise, FMS6:
trunk stability push-up, FMS7: quadruped rotary stability.
foot towards the lateral direction (3RSEBT) was 38.40±16.735 cm in the adults with DS and 70.56± 8.111 cm in those without (p<0.05). Right foot towards the postero- lateral direction (4RSEBT) was 39.30±18.500 cm in the adults with DS and 75.00±9.899 cm in those without (p<0.05). Right foot towards the posterior direction (5RSEBT) was 32.40±14.781 cm in the adults with DS and 74.22±8.592 cm in those without (p<0.05). The right foot to- wards the posteromedial direction (6RSEBT) was 20.80±
19.257 cm for the adults with DS and 62.44±9.978 cm for the normal adults, and, therefore, a significant difference was shown (p<0.05). The right foot towards the medial di- rection (7RSEBT) was 18.30±10.584 cm for the adults with DS and 43.28±10.676 cm for the normal adults, and, there- fore, a significant difference was shown (p<0.05). The right foot towards the anteromedial direction (8RSEBT) was 24.20±12.977 cm in the adults with DS and 49.00± 9.337 cm in those without (p<0.05). The left foot towards the anterior direction (1LSEBT) was 22.90±12.723 cm in the adults with DS and 59.67±8.239 cm in those without (p<0.05). Left foot towards the anterolateral direction (2LSEBT) was 32.20±13.481 cm in the adults with DS and 65.00±7.754 cm in those without (p<0.05). Left foot towards the lateral direc- tion (3LSEBT) was 32.20±15.720 cm in the adults with DS and 71.72±9.112 cm in those without (p<0.05). Left foot to- wards the posterolateral direction (4LSEBT) was 32.00±15.463 cm in the adults with DS and 73.89±10.781 cm in those without (p<0.05). Left foot towards the posterior direction (5LSEBT) was 30.50±15.615 cm in the adults with
DS and 73.44±9.395 cm in those without (p<0.05). Left foot towards the posteromedial direction (6LSEBT) was 7.80±18.725 cm in the adults with DS and 63.27±10.250 cm in those without (p<0.05). Left foot towards the medial di- rection (7LSEBT) was 19.20±12.934 cm in the adults with DS and 43.33±10.550 cm in those without (p<0.05). Left foot towards the anteromedial direction (8LSEBT) was 24.00±14.205 cm in the adults with DS and 49.39±7.868 cm in those without (p<0.05).
FMS
The results of FMS testing are shown in Table 5. The FMS score for the deep squat (FMS1) was 2.00±0.943 in the adults with DS and 2.61±0.608 in those without (p>0.05).
The FMS score for the hurdle step (FMS2) was 1.30±0.483 in the adults with DS and 2.67±0.485 in those without (p<0.05). The FMS score for the inline lunge (FMS3) was 1.10±0.568 in the adults with DS and 2.83±0.383 in those without (p<0.05). The FMS score for shoulder mobility (FMS4) was 1.50±0.527 in the adults with DS and 2.50±
0.514 in those without (p<0.05). The FMS score for the ac- tive straight leg raise (FMS5) was 2.80±0.422 in the adults with DS and 3.00±0.000 in those without (p>0.05). The FMS score for trunk stability push-up (FMS6) was 1.40±
0.699 in the adults with DS and 2.33±0.970 in those without (p>0.05). The FMS score for quadruped rotary stability (FMS7) was 1.30±0.483 in the adults with DS and 1.94±
0.236 in those without (p<0.05). The overall FMS score was 11.40±2.503 in the adults with DS and 17.89±1.605 in those without (p<0.05).
Discussion
Although there is general awareness that adults with DS have insufficient ankle stability, no research or study has fo- cused on the ankle stability in them to calculate the precise results of tests. Therefore, we chose adults with and without DS as the subjects, compared the significant differences in ankle stability between them, and calculated the results.
Based on the significant differences (p<0.05) shown in the
RPFROM, LPFROM, right dorsal flexor MMT, right plan-
tar flexion MMT, left dorsal flexion MMT, and left plantar
flexion MMT between the participants, we were able to
quantitatively establish that the adults with DS demon-
strated severe muscle weakness in comparison to those with-
out DS. Based on the significant differences (p<0.05) shown
in the SEBT tests, we were able to confirm that the adults
with DS demonstrated lower ankle stability in comparison to adults without DS. Based on the significant differences (p<0.05) showed in the FMS tests, we were able to confirm that adults with DS demonstrated lower ankle stability and balance in comparison to adults without DS.
The adults with DS who showed poor results on the MMT also showed a tendency to fall the moment the test began. In this study, the inline lunge included in the FMS was con- ducted to observe the overall balance and muscular strength of the ankle. As a result, although the adults with DS did not fall, most of them failed to complete and gave up in the mid- dle of the process. ROM was normal in adults with DS;
therefore, their lack of muscular strength made it impossible for them to maintain their dynamic balance. This result are related to previous studies using ankle strengthening ex- ercises as an intervention to improve dynamic balance.
Balance and strength improvements are very important for adults with DS, since they can produce greater stability while performing activities of daily living or work related tasks and thus, decreasing the occurrence of accidents or falls resulting in a lower incidence of injuries [26].
Accordingly, to enhance the dynamic stability of adults with DS; at ankle level, it is necessary to improve their ankle sta- bility through strengthening exercises of their ankle plantar and dorsal flexors.
Conflict of Interest
The authors declared no potential conflicts of interest with respect to the authorship and/or publication of this article.
References
1. Lloyd M, Burghardt A, Ulrich DA, Angulo-Barroso R. Physical activity and walking onset in infants with Down syndrome.
Adapt Phys Activ Q 2010;27:1-16.
2. Savelsbergh GJP, van der Kamp J, Ledebt A, Planinsek T.
Information-movement coupling in children with Down syndrome. In: Weeks DJ, Chua R, Elliott D, editors. Perceptual- motor behavior in Down syndrome. Champaign, IL: Human Kinetics; 2000. p. 251-76.
3. Webber A, Virji-Babul N, Edwards R, Lesperance M. Stiffness and postural stability in adults with Down syndrome. Exp Brain Res 2004;155:450-8.
4. Galli M, Rigoldi C, Mainardi L, Tenore N, Onorati P, Albertini G.
Postural control in patients with Down syndrome. Disabil Rehabil 2008;30:1274-8.
5. Chapman RS, Hesketh LJ. Behavioral phenotype of individuals with Down syndrome. Ment Retard Dev Disabil Res Rev 2000;
6:84-95.
6. Pitetti K, Baynard T, Agiovlasitis S. Children and adolescents with Down syndrome, physical fitness and physical activity. J Sport Health Sci 2013;2:47-57.
7. Smith DS. Health care management of adults with Down syndrome. Am Fam Physician 2001;64:1031-8.
8. Bittles AH, Glasson EJ. Clinical, social, and ethical implications of changing life expectancy in Down syndrome. Dev Med Child Neurol 2004;46:282-6.
9. Lim KB, Na YM, Lee HJ, Joo SJ. Comparison of postural control measures between older and younger adults using balance master system. J Korean Acad Rehabil Med 2003;27:418-23.
10. Tsimaras VK, Fotiadou EG. Effect of training on the muscle strength and dynamic balance ability of adults with down syndrome. J Strength Cond Res 2004;18:343-7.
11. Lin HC, Wuang YP. Strength and agility training in adolescents with Down syndrome: a randomized controlled trial. Res Dev Disabil 2012;33:2236-44.
12. Cimolin V, Galli M, Grugni G, Vismara L, Precilios H, Albertini G, et al. Postural strategies in Prader-Willi and Down syndrome patients. Res Dev Disabil 2011;32:669-73.
13. Eyigor S, Karapolat H, Durmaz B, Ibisoglu U, Cakir S. A randomized controlled trial of Turkish folklore dance on the physical performance, balance, depression and quality of life in older women. Arch Gerontol Geriatr 2009;48:84-8.
14. Diener E, Suh EK. Measuring quality of life: economic, social and subjective indicators. Soc Indic Res 1997;40:189-216.
15. Spink MJ, Fotoohabadi MR, Wee E, Hill KD, Lord SR, Menz HB. Foot and ankle strength, range of motion, posture, and de- formity are associated with balance and functional ability in old- er adults. Arch Phys Med Rehabil 2011;92:68-75.
16. Cioni M, Cocilovo A, Rossi F, Paci D, Valle MS. Analysis of an- kle kinetics during walking in individuals with Down syndrome.
Am J Ment Retard 2001;106:470-8.
17. Han SJ, Lee SG, Park SB, Oh KY, Lee KH. Effect of unilateral ankle brace on postural sway and limb load asymmetry. J Korean Acad Rehabil Med 2006;30:508-12.
18. Galli M, Rigoldi C, Brunner R, Virji-Babul N, Giorgio A. Joint stiffness and gait pattern evaluation in children with Down syndrome. Gait Posture 2008;28:502-6.
19. Lunsford BR, Perry J. The standing heel-rise test for ankle plan- tar flexion: criterion for normal. Phys Ther 1995;75:694-8.
20. Perry J, Ireland ML, Gronley J, Hoffer MM. Predictive value of manual muscle testing and gait analysis in normal ankles by dy- namic electromyography. Foot Ankle 1986;6:254-9.
21. Kesar TM, Perumal R, Reisman DS, Jancosko A, Rudolph KS, Higginson JS, et al. Functional electrical stimulation of ankle plantarflexor and dorsiflexor muscles: effects on poststroke gait.
Stroke 2009;40:3821-7.
22. Gribble PA, Hertel J. Considerations for normalizing measures of the star excursion balance test. Meas Phys Educ Exerc Sci 2004;7:89-100.
23. Earl JE, Hertel J. Lower-extremity muscle activation during the star excursion balance tests. J Sport Rehabil 2001;10:93-104.
24. Frost DM, Beach TA, Callaghan JP, McGill SM. Using the func- tional movement screenTM to evaluate the effectiveness of training. J Strength Cond Res 2012;26:1620-30.
25. Parchmann CJ, McBride JM. Relationship between functional
movement screen and athletic performance. J Strength Cond Res 2011;25:3378-84.
26. Hinckson EA, Curtis A. Measuring physical activity in children
and youth living with intellectual disabilities: a systematic review. Res Dev Disabil 2013;34:72-86.